
| This article is part of a series on the |
| Culture of the United States |
|---|
 |
| Society |
| Arts and literature |
| Other |
| Symbols |
|
United States portal |

The United States has a racially and ethnically diverse population.[1] At the federal level, race and ethnicity have been categorized separately. The most recent United States census recognized five racial categories (White, Black, Native American/Alaska Native, Asian, and Native Hawaiian/Other Pacific Islander), as well as people who belong to two or more of the racial categories.[2][3][4] The United States also recognizes the broader notion of ethnicity. The 2000 census and 2010 American Community Survey inquired about the "ancestry" of residents, while the 2020 census allowed people to enter their "origins".[5] The Census Bureau also classified respondents as either Hispanic or Latino, identifying as an ethnicity, which comprises the minority group in the nation.[2][3][4]
White Americans are the majority in every census-defined region (Northeast, Midwest, South, and West) and in every state except Hawaii,[6] but contribute the highest proportion of the population in the Midwest, at 85% per the Population Estimates Program (PEP)[4] or 83% per the American Community Survey (ACS).[7][verification needed] Non-Hispanic whites make up 79% of the Midwest's population, the highest proportion of any region.[4] At the same time, the region with the smallest share of white Americans is the South, which comprise 53%.[4]
Currently, 55% of the African American population lives in the South.[4] A plurality or majority of the other official groups reside in the West. The latter region is home to 42% of Hispanic and Latino Americans, 46% of Asian Americans, 48% of American Indians and Alaska Natives, 68% of Native Hawaiians and Other Pacific Islanders, 37% of the "two or more races" population (Multiracial Americans), and 46% of those self-designated as "some other race".[4][8]
Each of the five inhabited U.S. territories is fairly homogeneous, though each comprises a different primary ethnic group. American Samoa has a high percentage of Pacific Islanders, Guam and the Northern Mariana Islands are mostly Asian and Pacific Islander, Puerto Rico is mostly Hispanic/Latino, and the U.S. Virgin Islands are mostly African American.[9][10][11][12]
YouTube Encyclopedic
-
1/1Views:6 775
-
Race and Sports Video History
Transcription
Racial and ethnic categories
Racial categories
The first United States census in 1790 classed residents as free White people (divided by age and sex), all other free persons (reported by sex and color), and enslaved people. The 2000 census officially recognized six racial categories including people of two or more races; a category called "some other race" was also used in the census and other surveys, but is not official.[2][3][4] In the 2000 census and subsequent Census Bureau surveys, Americans self-described as belonging to these racial groups:[3]
- White American, European American, or Middle Eastern American: those having origins in any of the original peoples of Europe, the Middle East, or North Africa. Following consultations with Middle East and North Africa (MENA) organizations, the Census Bureau announced in 2014 that it would establish a new MENA ethnic category for populations from the Middle East, North Africa, and the Arab world.[15] However, this did not occur on the 2020 census.[16]
- Black or African American: those having origins in any of the native peoples of sub-Saharan Africa. For the 2000 census, this includes people who indicated their race or races as "Black, African Am., or Negro", or wrote in entries such as African American, Afro American, Nigerian, or Haitian.[3]
- American Indian or Alaska Native: those having origins in any of the original peoples of North, Central, and South America.
- Asian American: those having origins in any of the original peoples of the Far East, Southeast Asia, and the Indian subcontinent.
- Native Hawaiian or Other Pacific Islander: those having origins in any of the original peoples of Polynesia, Melanesia, or Micronesia.
- Other: respondents wrote how they identified themselves if different from the preceding categories (e.g. Roma or Aboriginal/Indigenous Australian). However, 95% of the people who report in this category are Hispanic Mestizos.[3][8][17] This is not a standard OMB race category.[3] Responses have included mixed-race terms such as Métis, Creole, and Mulatto, which are generally considered to be categories of multi-racial ancestry (see below),[18] but, write-in entries reported in the 2000 census also included nationalities (as opposed to ethnicities), such as South African, Belizean, or Puerto Rican, as well as other terms for mixed-race groups like Wesort, Melungeon, mixed, interracial, and others.
- Two or more races, widely known as multiracial: those who check off and/or write in more than one race. There is no option labelled "two or more races" or "multiracial" on census and other forms; people who report more than one of the foregoing six options are classified as people of "two or more races" in subsequent processing. Any respondent may identify with any number (including all six) of the racial categories.
In the census, people are asked about their racial identity, including their origins, and whether or not they are of Hispanic ethnicity.[19] These categories are sociopolitical constructs and should not be interpreted as being scientific or anthropological in nature.[2] They have been changed from one census to another, and the racial categories include both "racial" and national origin groups.[20][21]
In 2007, the Equal Employment Opportunity Commission of the U.S. Department of Labor finalized the update of its EEO-1 report[22] format and guidelines concerning the definitions of racial or ethnic categories.
In March 2024, the Office of Management and Budget published revisions to Statistical Policy Directive No. 15: Standards for Maintaining, Collecting, and Presenting Federal Data on Race and Ethnicity that address: (1) combined question for race and ethnicity; (2) adding a "Middle Eastern or North African (MENA)" category; and (3) collecting additional detail to enable data disaggregation.[23][24]
Census-designated ethnicities: Hispanic or Latino origin
The question on Hispanic or Latino origin is separate from the question on race.[3][25] Hispanic and Latino Americans have ethnic origins in a Spanish-speaking country or Brazil. Latin American countries are, like the United States, racially diverse.[26] Consequently, no separate racial category exists for Hispanic and Latino Americans, as they do not constitute a race, nor a national group. When responding to the race question on the census form, each person is asked to choose from among the same racial categories as all Americans, and are included in the numbers reported for those races.[27]
Each racial category may contain Non-Hispanic or Latino and Hispanic or Latino Americans. For example: the White or European American race category contains Non-Hispanic Whites and Hispanic Whites (see White Hispanic and Latino Americans); the Black or African American category contains Non-Hispanic Blacks and Hispanic Blacks (see Black Hispanic and Latino Americans); the Asian American category contains Non-Hispanic Asians and Hispanic Asians (see Asian Hispanic and Latino Americans), and likewise for all the other categories.
Self-identifying as both Hispanic or Latino and not Hispanic or Latino is neither explicitly allowed nor explicitly prohibited.[2]
Ethnicity, national origin, and cultural groups (generally not mentioned in census data)
Social definitions of race
Since the concept of race became widespread in the early United States, people of Native American heritage, African heritage, and European heritage were considered to belong to different races. For nearly three centuries, the criteria for membership in these groups were similar; a person's appearance, their social circle (how they lived), and ancestry were all considered by society when determining someone's race.
The motivations behind historical definitions of racial identity, especially Native American and black identities, have been the topic of much discussion in modern years. According to many anthropologists, these racial designations were a means to concentrate power, wealth, privilege and land in the hands of white people in a society of white hegemony and privilege. Racial distinctions generally had little to do with biology and more to do with the history of slavery, the systemic racism it produced, and specific forms of white supremacy that benefited from specific definitions of racial identity. For example, it has been suggested that the blood quantum laws defining Native American identity enabled whites to acquire indigenous lands during the allotment process, and the one-drop rule of black identity, enforced legally in the early 20th century, enabled them to preserve their agricultural labor force in the South.
The descendants of Native and Black Americans not only had to contend with laws defining their racial identity for the benefit of the majority, but also with a variety of social consequences depending on how they were perceived in society. Compared to other mixed Americans, the blood quantum laws made it easier for a person of mixed European and Native American ancestry to be accepted as white; after a few generations of intermarriage, the offspring of Native and White Americans would no longer legally be considered Native American. They could have treaty rights to land, but because an individual with only one native great-grandparent was no longer was classified as Native American, they lost legal claim to their land under historical allotment rules, making it easier for White Americans to acquire the land for their own development. On the other hand, the same individual who could be denied legal standing in a tribe because he was "too White" to claim property rights might still have enough visually identifiable native ancestry to be considered socially as a "half-breed" and stigmatized by both communities.
The 20th century one-drop rule made it relatively difficult for anyone of known black ancestry to be accepted as white. The child of a black sharecropper and a white person was considered black by the local communities, and would likely become a sharecropper as well, thus adding to the landholder or employer's labor force. Because the agricultural economy of the time benefited from using Black Americans as a labor force, it was advantageous for as many people as possible to be defined as black. Many experts on the Jim Crow period agree that the 20th century notion of invisible blackness shifted the color line in the direction of paleness, and "expanded" the labor force in response to Southern blacks' Great Migration to the North, although others (such as the historians C. Vann Woodward, George M. Fredrickson, and Stetson Kennedy) considered the one-drop rule a consequence of the need to justify the oppression of Black Americans and define whiteness as pure.
Over the centuries, as whites wielded social and political power over people of color in the United States, they created a social order of hypodescent, in which they assigned mixed-race children to the lower-status groups. However, they were often ignorant of the systems of social classification within Native American tribes. The Omaha people, for instance, who had a patrilineal kinship system, classified all children with white fathers as "White", and excluded them as members of the tribe unless they were formally adopted by a male member. Tribal members might care for mixed-race children of White fathers, but they were considered outside the hereditary clan and kinship fundamental to tribal society.[28]
The social construction of hypodescent also related to the racial caste system associated with slavery. It was made explicit by Virginia and other colonies' laws as early as 1662. Virginia incorporated the Roman principle of partus sequitur ventrem into slave law, saying that children of enslaved mothers were born into slavery as well. Under English common law, children's social status was determined by the father, not the mother, but the colonists considered enslaved Africans outside the category of English subjects. Although White men were in positions of power to take sexual advantage of enslaved black women, this meant that their offspring would be considered Black and were enslaved regardless of their parentage. However, most free Black American families listed in the censuses of 1790–1810 were descended from unions between White women and African men in colonial Virginia, from the years when working classes lived and worked closely together, and before slavery had hardened as a racial caste.[29]
In the United States, social and legal conventions developed over time by Whites classified individuals of mixed ancestry into simplified racial categories, but these were always flawed. The decennial censuses conducted since 1790, after slavery was well established in the United States, included a classification of persons by race, with the categories of "White", "Black", "Mulatto", and "Indian". The inclusion of mulatto was a rare explicit acknowledgement of mixed race people, but that status was usually simplified into one race or another in actual society. Before the Civil War, states such as Virginia had a legal definition of whiteness that classified people as white if they were no more than 1/8th black. For example, if not born into slavery, Thomas Jefferson's children by his slave Sally Hemings would have been classified as legally white, as they were 7/8ths White by ancestry. Three of the four surviving children entered white society as adults, and their descendants have identified as white. In the late 18th and 19th centuries, people of mixed race often migrated to frontiers where societies were more open, and they might be accepted as white if they satisfied obligations of citizenship.[29]
The more familiar "one-drop rule" was not adopted by Virginia and other states until the 20th century, but it classified persons with any known African ancestry as black. Passage of these laws was often encouraged by white supremacists and people promoting "racial purity", who disregarded the long history of multi-racial unions in the South.[30] In other countries in the Americas, where mixing among groups was overtly more extensive, social categories have tended to be more numerous and fluid. In some cases, people may move into or out of categories on the basis of a combination of socioeconomic status, social class, ancestry, and appearance.
The term Hispanic as an ethnonym emerged in the 20th century, with the rise of migration of laborers from Spanish-speaking countries of the western hemisphere to the United States. It includes people who may have been considered racially distinct (black, white, native, or other mixed groups) in their home countries. Today, the word "Latino" is often used as a synonym for "Hispanic". Even if such categories were earlier understood as racial categories, today they have begun to represent ethnolinguistic categories, regardless of perceived race. Similarly, the prefix "Anglo" is now used among some Hispanics to refer to non-Hispanic White Americans or European Americans, most of whom speak the English language but are not of primarily English descent. A similar phenomenon of ethnolinguistic identity can historically (and in some cases contemporarily) be seen in the case of the Louisiana Creole people, who may be of any race but share certain cultural characteristics.
Historical trends and influences
The growth of the Hispanic population through immigration and high birth rates is noted as a partial factor for U.S. population gains in the last quarter-century. The 2000 census revealed that Native Americans had reached their highest documented population, 4.5 million, since the U.S. was founded in 1776.[3] In some cases, immigrants and migrants have formed ethnic enclaves; in others, this mixture of races has created ethnically diverse communities. Earlier immigrants to the Americas came from widely separated regions of Afro-Eurasia, and American immigrant populations frequently mixed among themselves and with the indigenous inhabitants of the continents, creating a complex multiracial population.
Throughout American history, efforts to classify the increasingly mixed population of the United States into discrete categories have generated many difficulties. Early efforts to track mixing between groups led to a proliferation of historical categories (such as "mulatto" and "octaroon" among persons with partial African descent) and "blood quantum" distinctions, which became increasingly detached from self-reported ancestry. By the standards used in early censuses, many mixed-race children born in the U.S. were classified as of a different race than one of their biological parents, and even when these standards were no longer commonly accepted, the combination of social perceptions of race and self-identification with a racial identity frequently complicated legal standards of racial identity. Even people who did not identify as mixed faced the issue of unclear legal terminology; until the 2000 census, Hispanic Americans were required to identify as one race on censuses, and without the option to select Latino or Hispanic, confusion flourished.
Historical trends influencing the ethnic demographics of the United States include:
- Patterns of original settlement
- Settlement of the Americas by Native American First Nations and Alaska Native peoples in several waves over thousands of years, beginning at least 15,000 years ago
- Settlement of Pacific islands by Polynesian people, including Native Hawaiians, Samoans in American Samoa,[31] and the Chamorros in Guam and the Northern Mariana Islands
- Settlement of the Antilles, including the U.S. Virgin Islands and Puerto Rico, by the "Ortoiroid" people, and later by the Arawak-speaking ancestors of the Taíno, Ciboney, and Kalinago people
- Colonization
- Spanish colonization of the Americas, including Florida, the Southwest, and Puerto Rico, which are all today considered part of the United States
- French colonization of the Americas, including the Old Northwest and the lower Mississippi River; historical events, including the Expulsion of the Acadians, influenced the ethnic mix, especially in Louisiana, northern New England, and New York
- Dutch colonization of the Americas, mainly of the Hudson River
- British colonization of the Americas, beginning with Caribbean and the Thirteen Colonies
- Danish colonization of the Americas, including what is now known as the United States Virgin Islands
- Penal transportation to the Americas of felons under British rule
- The popularity of indentured servitude, usually from Ireland, until the late 18th century
- The Atlantic slave trade, which brought millions of Africans to the South, Caribbean, and Latin America
- Severe reduction of Native American populations in the contiguous United States, largely due to new infectious diseases carried by European colonists combined with genocidal warfare
- Forced migration
- Deportation and flight of United Empire Loyalists to Canada, the Caribbean, and Britain after the American Revolution
- Forced removal of more than one million African Americans in the domestic slave trade from the Upper South to the Deep South during the early 19th century as Americans developed new lands for plantations
- Territorial conflict with Native Americans and the Indian removal policy of the 19th century displaced many remaining native populations from east of the Mississippi River to territories to the west, especially to what is now Oklahoma
- Immigration
- Historical immigration to the United States from all countries of the world for religious, political and economic reasons, influenced by laws concerning immigration and naturalization in the United States and illegal immigration to the United States, which denied various entry due to discrimination, economic protectionism, and political conflict with their nation of origin
- Transatlantic migrations from Europe, especially in the 19th century, which created ethnic enclaves in many eastern cities and settling many rural areas east of the Mississippi
- Immigration from Asia, which has had the most influence on Hawaii and the West Coast
- Immigration from Mexico and Latin America, which has strongly influenced the Southwest
- Westward expansion of the United States
- The Royal Proclamation of 1763, which restricted the western boundary of European settlement to the watershed east of the Appalachian Mountains
- The Homestead Act, which promoted settlement west of the Mississippi after the Louisiana Purchase
- Settlement of Utah by members of the Church of Jesus Christ of Latter-day Saints
- California Gold Rush
- Oregon Trail
- The Klondike Gold Rush, which promoted settlement of Alaska
- Internal migration
- African Americans escaping from slavery prior to the Civil War, sometimes via the Underground Railroad, and reaching the free North
- The American Industrial Revolution, which promoted urbanization of what was previously a largely agrarian society
- Improved transportation systems increasing the ease of American migration through the country
- The Great Migration and Second Great Migration, in which Black Americans moved to Northern, Midwestern, and Western cities in order to seek economic opportunity and escape racial violence
- Railroads, promoting migration westwards and streetcar suburbs, which created significant ethnic shifts in urban areas
- Natural disasters such as the Dust Bowl
- The suburbanization period after World War II, which produced "white flight" to new housing and away from social unrest, followed by "black flight"
- The development of air conditioning, which encouraged migration from northern areas to the Sun Belt
Racial makeup of the U.S. population
For demographics by specific ethnic groups rather than general race, see "Ancestry" below.
White and European Americans

White and European Americans are the majority of people living in the United States. White people are defined by the United States Census Bureau as those "having origins in any of the original peoples of Europe, the Middle East, or North Africa".[32] Like all official U.S. racial categories, "White" has a "not Hispanic or Latino" and a "Hispanic or Latino" component,[33] the latter consisting mostly of White Mexican Americans and White Cuban Americans.
As of 2019, White Americans are the majority in 49 of the 50 states (plus Puerto Rico). White Americans are not a majority in Hawaii, the District of Columbia, American Samoa, Guam, the Northern Mariana Islands, and the U.S. Virgin Islands.[34][35][36][37] As of the 2020 U.S. Census, non-Hispanic Whites are a majority in 44 states, excluding California, Hawaii, Maryland, Nevada, New Mexico, Texas, the District of Columbia, American Samoa, Guam, the Northern Mariana Islands, Puerto Rico, and the U.S. Virgin Islands.[34][38][35][36][37][39]
The non-Hispanic White percentage of the 50 states and District of Columbia (60.1% in 2019)[40] has been decreasing since the mid-20th century as a result of changes made in immigration policy, most notably the Hart–Celler Act of 1965. If current trends continue, non-Hispanic Whites will drop below 50% of the overall U.S. population by 2043. White Americans overall (non-Hispanic Whites together with White Hispanics) are projected to continue as the majority, at 73% (or 303 million out of 420 million) in 2005, from currently 77%.
Although a high proportion of the population is known to have multiple ancestries, in the 2000 U.S. census, the first with the option to choose more than one, most people still identified with one racial category.[citation needed] In the 2000 census, self-identified German Americans made up 17% of the U.S. population, followed by Irish Americans at 12%, as reported in the 2000 census. This makes German and Irish the largest and second-largest self-reported ancestry groups in the United States. Both groups had high rates of immigration to the U.S. beginning in the mid-19th century, triggered by the Great Famine in Ireland and the failed 1848 Revolution in Germany. English Americans and British Americans are still considered the largest ethnic group, despite the statistical errors caused by events such as the confusion in the 2000 census where many English and British Americans self-identified under the new category entry "American", thus considering themselves indigenous because their families had resided in the US for so long,[41][42][43][44] or, if of mixed European ancestry, identified with a more recent and differentiated ethnic group.[45] 7.2% of the population listed their ancestry as American on the 2000 census (see American ancestry). According to the U.S. Census Bureau, the number of people in the U.S. who reported American and no other ancestry increased from 12.4 million in 1990 to 20.2 million in 2000. This change in reporting represented the largest "growth" of any ethnic group in the United States during the 1990s, but it represented how people reported themselves more than growth through birth rates, for instance, and certainly did not reflect immigration.
Most French Americans are believed to be descended from colonists of Catholic New France; exiled Huguenots, much fewer in number and settling in the eastern English colonies in the late 1600s and early 1700s, needed to assimilate into the majority culture and have intermarried over generations. Some Louisiana Creoles, including the Isleños of Louisiana, and the Hispanos of the Southwest have had, in part, direct Spanish ancestry; most self-reported White Hispanics are of Mexican, Puerto Rican, Cuban, and Salvadoran origins,[46] each of which are multi-ethnic nations. Hispanic immigration has increased from nations of Central and South America.[47]
There are a substantial number of White Americans who are of Eastern and Southern European descent, such as Russian, Polish, Italian, and Greek Americans. Eastern Europeans immigrated to the United States more recently than Western Europeans. Arabs, Turks, Iranians, Israelis, Armenians, and other West Asians are reported as White in the United States census, as a result of a federal court case from 1909, even though most do not identify as White.[48]
Middle Eastern and North African Americans
There are an estimated 3.5 million Middle Eastern Americans according to the U.S. Census Bureau in 2020 comprising 1.06% of the population[49] and including both Arab and non-Arab Americans.[50] The Arab American Institute in 2014 estimated a population of 3.6 million.[51] U.S. census population estimates are based on responses to the ancestry question on the census, which makes it difficult to accurately count Middle Eastern Americans.[51][52] Though Middle Eastern American communities can be found in each of the 50 states, the majority live in just 10 states; nearly a third live in California, New York, and Michigan.[53] More Middle Eastern Americans live in California than any other state, with ethnic groups such as Arabs, Persians, and Armenians being a large percentage, but Middle Eastern Americans represent the highest percentage of the population of Michigan.[53][54] In particular, Dearborn, Michigan has long been home to a high concentration of Middle Eastern Americans.[55][56]
The U.S. Census Bureau is still finalizing the ethnic classification of MENA populations. Middle Eastern Americans are currently counted as racially White on the census, although many do not identify as such. In 2012, prompted in part by post-9/11 discrimination, the American-Arab Anti-Discrimination Committee petitioned the Department of Commerce's Minority Business Development Agency to designate the MENA populations as a minority/disadvantaged community.[57] Following consultations with MENA organizations, the U.S. Census Bureau announced in 2014 that it would establish a new MENA ethnic category for populations from the Middle East, North Africa, and the Arab world, separate from the "white" classification that these populations had previously sought in 1909. The expert groups felt that the earlier "White" designation no longer accurately represents MENA identity, so they successfully lobbied for a distinct categorization.[15][58] This process does not currently include ethnoreligious groups such as Sikhs, as the Bureau only tabulates these groups as followers of religions rather than members of ethnic groups.[59]
According to the Arab American Institute, countries of origin for Arab Americans include Algeria, Bahrain, Egypt, Iraq, Jordan, Kuwait, Lebanon, Libya, Morocco, Oman, Qatar, Palestine, Saudi Arabia, Syria, Tunisia, United Arab Emirates, and Yemen. As of December 2015, the sampling strata for the new MENA category includes the Census Bureau's working classification of 19 MENA groups, as well as Armenian, Afghan, Iranian, Israeli, Azerbaijani, and Georgian groups.[60] The new category will identify "Israeli" as a choice and raises questions as to how the large U.S. Jewish population (7-8 million) will identify.[61]
The new question on the U.S. Census will identify the MENA category to include:[62]
- "Individuals with origins in any of the original peoples of the Middle East or North Africa, including, for example, Lebanese, Iranian, Egyptian, Syrian, Iraqi, and Israeli."
Hispanic and Latino Americans
| Race | Population | % of all Hispanic and Latino Americans |
% of total U.S.
population |
|---|---|---|---|
| White | 26,735,714 | 53.0 | 8.7 |
| Some other race (Mestizo, etc.) |
18,503,103 | 36.7 | 6.0 |
| Two or more races | 3,042,592 | 6.0 | 1.0 |
| Black | 1,243,471 | 2.5 | 0.4 |
| American Indian and Alaska Native | 685,150 | 1.4 | 0.2 |
| Asian | 209,128 | 0.4 | <0.1 |
| Native Hawaiian and Pacific Islander | 58,437 | 0.1 | <0.1 |
| Total | 50,477,594 | 100.0 | 16.3 |
Hispanic and Latino Americans constitute 59.8 million people, or 18.3% of the total U.S. population as of 2018.[64] The category includes people who are of full or partial Hispanic or Latino origin. They typically have origins in the Spanish-speaking nations of Latin America, although a few also come from other places (0.2% of Hispanic and Latino Americans were born in Asia, for example).[65] The group is heterogeneous in race and national ancestry.
The Census Bureau defines "Hispanic or Latino origin" thus:
For Census 2000, American Community Survey: People who identify with the terms "Hispanic" or "Latino" are those who classify themselves in one of the specific Hispanic or Latino categories listed on the Census 2000 or ACS questionnaire ("Mexican," "Puerto Rican," or "Cuban") as well as those who indicate that they are "other Spanish, Hispanic, or Latino". Origin can be viewed as the heritage, nationality group, lineage, or country of birth of the person, or the person's parents or ancestors, before their arrival in the United States. People who identify their origin as Spanish, Hispanic, or Latino may be of any race.[66]
Per the 2019 American Community Survey, the leading ancestries for Hispanic Americans are Mexican (37.2 million) followed by Puerto Rican (5.83 million), Cuban (2.38 million), and Salvadoran (2.31 million).[67] In addition, there are 3.19 million people living in Puerto Rico who are excluded from the count (see Puerto Ricans).
The Hispanic and Latino population in the United States has reached 58 million as of 2016, and has been the principal driver of United States demographic growth since 2000. Mexicans make up most of the Hispanic and Latino population at 35,758,000. The United States also has large Dominican, Guatemalan, Colombian, Honduran, Spanish, Ecuadorian, Peruvian, Salvadoran, Nicaraguan, Venezuelan, Argentine, and Panamanian populations.[68] The population of Hispanic Americans that has received a college education is also growing; in 2015, 40% of Hispanic Americans age 25 and older have had a college experience, but in 2000, the percentage was at a low 30%. Among U.S. states, California houses the largest population of Latinos. In 2019, 15.56 million lived in California.[38][69] As of 2019, the U.S. territory with the largest percentage of Hispanics/Latinos is Puerto Rico (98.9% Hispanic or Latino).[34][11]
The Hispanic or Latino population is young and fast-growing, due to immigration and higher birth rates.[65] For decades it has contributed significantly to U.S. population increases, and this is expected to continue. The Census Bureau projects that by 2050, one-quarter of the population will be Hispanic or Latino.[70][71]
African Americans
African Americans, or Black Americans, are citizens of the United States with African ancestry.[72] According to the Office of Management and Budget, the grouping includes individuals who self-identify as African American and are descended from Africans that were forcibly relocated to the United States and enslaved, as well as those who recently and voluntarily emigrated from nations in the Caribbean and sub-Saharan Africa.[73] Both groups of people may also identify as Black or some other written-in race. However, some immigrants from the continent of Africa do not identify as Black and are not socially perceived as such, such as the Afrikaners of South Africa.[72] According to the 2009 American Community Survey, there were 38,093,725 Black and African Americans in the United States, representing 12.4% of the population. There were 37,144,530 non-Hispanic Blacks, which comprised 12.1% of the population.[74] According to the 2010 U.S. census, this number increased to 42 million when including multiracial African Americans,[73] making up 13% of the total U.S. population.[a][76] African Americans make up the second largest group in the United States, but the third largest group after White Americans and Hispanic or Latino Americans of any race.[77] The majority of the population (55%) lives in the South, and there has been a decrease of African Americans in the Northeast and Midwest.[76] The U.S. state/territory with the highest percentage of African Americans is the U.S. Virgin Islands (76% African American as of 2010).[12]
Most African Americans are the direct descendants of captives from West Africa, who survived the slavery era within the boundaries of the present United States.[78] The first West Africans were brought to Jamestown, Virginia in 1619. The English settlers treated these captives as indentured servants and released them after a number of years. This practice was gradually replaced by the system of race-based slavery used in the Caribbean.[79] All the American colonies had slavery, but it was usually in the form of personal servants in the North (where 2% of the population were enslaved), and field hands in plantations in the South (where 25% were enslaved);[80] by the beginning of the American Revolutionary War, a fifth of the total population was enslaved.[81] During the revolution, some served in the Continental Army or Continental Navy,[82][83] while others fought for the British Empire in units such as Lord Dunmore's Ethiopian Regiment.[84] By 1804, the states north of the Mason–Dixon line had abolished slavery.[85] However, slavery would persist in the southern states until the end of the American Civil War and the passage of the Thirteenth Amendment.[86] Following the end of the Reconstruction Era, which saw the first African American representation in Congress,[87] African Americans became disenfranchised and subject to Jim Crow laws,[88] legislation that would persist until the passage of the Civil Rights Act of 1964 and Voting Rights Act of 1965 due to the civil rights movement.[89]
According to U.S. Census Bureau data, very few African immigrants self-identify as "African-American" (as "African-American" is usually referring to Blacks with deeply rooted ancestry dating back to the U.S. slave period as discussed in the previous paragraph.) On average, less than 5% of African residents self-reported as "African-American" or "Afro-American" in the 2000 U.S. census. The overwhelming majority of African immigrants (~95%) identified instead with their own respective ethnicities. Self-designation as "African-American" or "Afro-American" was highest among individuals from West Africa (4–9%), and lowest among individuals from Cape Verde, East Africa and Southern Africa (0–4%).[90] Nonetheless, African immigrants often develop very successful professional and business working-relationships with African Americans. Immigrants from some Caribbean, Central American, and South American nations and their descendants may or may not also self-identify with the term "African American".[91]
Recent African immigrants in the United States come from countries such as Jamaica, Haiti, Nigeria, Ethiopia, Dominican Republic, Ghana, Trinidad and Tobago, Kenya, Guyana, and Somalia.[92]
Asian Americans
A third significant minority is the Asian American population, which comprised 19.36 million people, or 5.9% of the U.S. population, in 2019.[40] In 2019, 6.12 million Asian Americans lived in California.[38] As of 2019, approximately 532,300 Asians live in Hawaii, forming 37.6% of the islands' people.[34] This makes Hawaii the state with the highest percentage of Asian Americans.[93] Although they were historically first concentrated in Hawaii and the West Coast, Asian Americans now live across the country, living and working in large numbers in New York City, Chicago, Boston, Houston, and other major urban centers. There are also many Asians living in two Pacific U.S. territories (Guam and the Northern Mariana Islands) – as of 2010, Guam's population was 32.2% Asian, and the population of the Northern Mariana Islands was 49.9% Asian.[10]
Filipinos have been in the territories that would become the United States since the 16th century. In 1635, an "East Indian" is listed in Jamestown, Virginia; preceding wider settlement of Indian immigrants on the East Coast in the 1790s and the West Coast in the 1800s. In 1763, Filipinos established the small settlement of Saint Malo, Louisiana, after fleeing mistreatment aboard Spanish ships. Since there were no Filipino women with them, these "Manilamen", as they were known, married Cajun and indigenous women. The first Japanese person to come to the United States, and stay any significant period of time was Nakahama Manjirō who reached the East Coast in 1841, and Joseph Heco became the first Japanese American naturalized U.S. citizen in 1858. As with the new immigration from central and eastern Europe to the East Coast from the mid-19th century on, Asians started immigrating to the United States in large numbers in the 19th century. This first major wave of immigration consisted predominantly of Chinese and Japanese laborers, but also included Korean and South Asian immigrants. Many immigrants also came during and after this period from the Philippines, which was a U.S. colony from 1898 to 1946. Exclusion laws and policies largely prohibited and curtailed Asian immigration until the 1940s. After the US changed its immigration laws during the 1940s to 1960s to make entry easier, a much larger new wave of immigration from Asia began. Today, the largest self-identified Asian American sub-groups, according to census data, are Chinese Americans, Filipino Americans, Indian Americans, Vietnamese Americans, Korean Americans, and Japanese Americans, among other groups.[94]
Not all of Asian Americans' ancestors directly migrated from their country of origin to the US. For example, more than 270,000 people from Guyana, a South American country, reside in the U.S., but a predominant number of Guyanese people are of Indian descent.[95]
Native Americans and Alaska Natives
Indigenous peoples of the Americas, particularly Native Americans, made up 2.9% of the population in 2020, numbering 3.7 million. An additional 5.9 million persons declared part-American Indian or Alaska Native ancestry.[96] Levels of Native American ancestry (distinct from Native American identity) differ. The genomes of self-reported African Americans averaged to 0.8% Native American ancestry, those of European Americans averaged to 0.18%, and those of Latinos averaged to 18.0%.[97][98]
The legal and official designation of who is Native American has aroused controversy by demographers, tribal nations, and government officials for many decades. Federally recognized tribes and state recognized tribes set their own membership requirements; tribal enrollment may require residency on a reservation, documented lineal descent from recognized records, such as the Dawes Rolls, and other criteria. Some tribes have adopted the use of blood quantum, requiring members to have a certain percentage. The federal government requires individuals to certify documented blood quantum of ancestry for certain federal programs, such as education benefits, available to members of recognized tribes. Census takers accept any respondent's identification. Genetic scientists estimated that more than fifteen million other Americans, including African and Hispanic Americans (specifically those of Mexican heritage), may have up to one quarter of Native ancestry.[citation needed]
Once thought to face extinction as a race or culture, Native Americans of numerous tribes have achieved revival of aspects of their cultures, and have fought to retain sovereignty and control of their own affairs for centuries. In recent years, many have started language programs to revive use of traditional languages, established tribally controlled colleges and other schools on their reservations, and developed gaming casinos on their sovereign land to raise revenues for economic development, as well as to promote the education and welfare of their people through health care and construction of improved housing.
Today, more than 800,000 to one million persons claim Cherokee descent in part or as full-bloods; of these, an estimated 300,000 live in California, 160,000 in Oklahoma (of which a majority are Cherokee Nation citizens), and 15,000 in North Carolina, living in ancestral homelands as members of the Eastern Band of Cherokee Indians.[99]
The second largest tribal group is the Navajo, who call themselves Diné and live on a 16‑million-acre[b] Indian reservation covering northeast Arizona, northwest New Mexico, and southeast Utah. It is home to half of the 450,000 members of the Navajo Nation.[citation needed] The third largest group are the Lakota (Sioux) Nation, with distinct federally recognized tribes located in the states of Minnesota, Nebraska, Montana, Wyoming; and North and South Dakota.[citation needed][clarification needed]
As of the 2020 census, the largest self-identified Native American group not combined with another race is Aztec, numbering 378,122 individuals. Though Aztecs are indigenous to Mexico and not the United States, they are nevertheless considered Native American people per census guidelines, which includes any indigenous people from the Americas.[100][101]
Native Hawaiians and other Pacific Islanders Americans
Native Hawaiians and other Pacific Islanders numbered approximately 656,400 in 2019, or 0.2% of the population.[40] Additionally, nearly as many individuals identify themselves as having partial Native Hawaiian ancestry, for a total of 829,949 people of full or part Native Hawaiian ancestry.[102] This group constitutes the smallest minority in the United States. More than half identify as "full-blooded", but historically most Native Hawaiians on the island chain of Hawaii are believed to have some Asian and European ancestry.[citation needed]
Some demographers believe that by 2025, the last full-blooded Native Hawaiian will die off, leaving a culturally distinct but racially mixed population.[citation needed] However, throughout Hawaii, they are working to preserve and assert adaptation of Native Hawaiian customs and the Hawaiian language by establishing cultural schools solely for legally Native Hawaiian students and more.
There are significant Pacific Islander populations living in three Pacific U.S. territories (American Samoa, Guam, and the Northern Mariana Islands). As of 2010, American Samoa's population was 92.6% Pacific Islander (mostly Samoan), Guam's population was 49.3% Pacific Islander (mostly Chamorro), and the population of the Northern Mariana Islands was 34.9% Pacific Islander.[9][10] Out of all U.S. states/territories, American Samoa has the highest percentage of Pacific Islanders.[9]
Two or more races
Self-identified multiracial Americans numbered 7.0 million in 2008, or 2.3% of the population.[7] They have identified as any combination of races (White, Black or African American, Asian, American Indian or Alaska Native, Native Hawaiian or other Pacific Islander, and "some other race") and ethnicities.[103] The U.S. has a growing multiracial identity movement.
While the colonies and southern states protected White fathers by making all children born to slave mothers be classified as slaves, regardless of paternity, they also banned miscegenation or interracial marriage, most notably between Whites and Blacks. However, this did little to stop interracial relationships. Demographers state that, due to new waves of immigration, the American people through the early 20th century were mostly multi-ethnic descendants of various immigrant nationalities, who maintained cultural distinctiveness until, over time, assimilation, migration and integration took place.[citation needed] The civil rights movement through the 20th century gained passage of important legislation to enforce constitutional rights of minorities, including multiracial Americans.
The multiracial population that is part White is the largest percentage of the multiracial population. As of the 2000 census, 7,015,017 people self-identified as White/American Indian and Alaskan Native, 737,492 as White/Black, 727,197 as White/Asian, and 125,628 as White/Native Hawaiian and Pacific Islander.[104]
Genetic admixture
A 2002 study found an average of 18.6% European genetic contribution and 2.7% Native American genetic contribution (with standard errors of 1.5% and 1.4% respectively) in a sample of 232 African Americans.[citation needed] Meanwhile, in a sample of 187 European Americans from State College, Pennsylvania, there was an average of 0.7% West African genetic contribution and 3.2% Native American genetic contribution (with standard errors of 0.9% and 1.6% respectively). Most of the non-European admixture was concentrated in 30% of the sample, with West African admixture ranging from 2 to 20% with an average of 2.3%.[105]
In 1958, Robert Stuckert produced a statistical analysis using historical census data and immigration statistics. He concluded that the growth in the White population could not be attributed solely to births in the White population and immigration from Europe, but was also due to people identifying as White who were partly Black. He concluded that 21% of White Americans had some recent African-American ancestors and that the majority of Americans of known African descent were partly European and not entirely sub-Saharan African.[106]
More recently, many different DNA studies have shown that many African Americans have European admixture, reflecting the long history in this country of the various populations. Proportions of European admixture in African-American DNA have been found in studies to be 17%[107] and between 10.6% and 22.5%.[108] Another recent study found the average to be 21.2%, with a standard error of 1.2%.[105]
The Race, Ethnicity, and Genetics Working Group of the National Human Genome Research Institute notes that "although genetic analyses of large numbers of loci can produce estimates of the percentage of a person's ancestors coming from various continental populations, these estimates may assume a false distinctiveness of the parental populations, since human groups have exchanged mates from local to continental scales throughout history."[109]
Members of other races
In the 2000 census, the non-standard category of "Other"[3] was especially intended to capture responses such as Mestizo and Mulatto,[18] two large multiracial groups in most of the countries of origin of Hispanic and Latino Americans. However, many other responses are captured by the category.
In 2008, 15 million people, nearly five percent of the total U.S. population, were estimated to be "some other race",[7] with 95% of them being Hispanic or Latino.[8]
Due to this category's non-standard status, statistics from government agencies other than the Census Bureau (for example, the Centers for Disease Control's data on vital statistics, or the FBI's crime statistics), but also the Bureau's own official Population Estimates, omit the "some other race" category and include most of the people in this group in the White population, thus including the vast majority (about 90%) of Hispanic and Latino Americans in the White population.[110]
Ancestry
The ancestry of the people of the United States is widely varied and includes descendants of populations from around the world. In addition to its variation, the ancestry of people in the United States is also marked by varying amounts of intermarriage between ethnic and racial groups.
While some Americans can trace their ancestry back to a single ethnic group or population in Europe, Africa, or Asia, these are often first, second and third-generation Americans. Generally, the degree of mixed heritage increases the longer people's ancestors have lived in the United States (see melting pot). There are several means available to discover the ancestry of the people living in the United States, including genealogy, genetics, oral and written history, and analysis of Federal Population Census schedules; in practice, only few of these have been used for a larger part of the population.
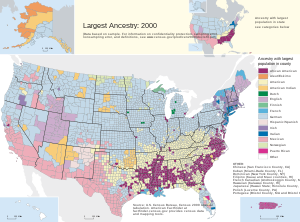
German English Norwegian Dutch Finnish Irish French Italian
Mexican Native Spanish American African American Puerto Rican
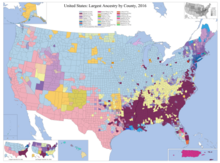

2020 American Community Survey
According to the 2015–2020 American Community Survey, the thirty largest ancestry groups in the United States were as follows.[111][112][113][114]
| Rank | Ancestry | Population | Percent of total population |
|---|---|---|---|
| 1 | German | 42,589,571 | 13.04% |
| 2 | Black or African American (non-Hispanic) | 39,994,653 | 12.22% |
| 3 | Mexican | 36,537,028 | 11.19% |
| 4 | Irish | 31,518,129 | 9.65% |
| 5 | English | 25,213,619 | 7.72% |
| 6 | American | 19,364,103 | 5.93% |
| 7 | Italian | 16,549,022 | 5.07% |
| 8 | Native American | 9,666,058 | 2.9% |
| 9 | French (including French Canadian) | 9,372,988 | 2.87% |
| 10 | Polish | 8,936,002 | 2.74% |
| 11 | Puerto Rican | 5,699,150 | 1.75% |
| 12 | Scottish | 5,298,861 | 1.62% |
| 13 | Norwegian | 4,289,825 | 1.31% |
| 14 | Chinese | 4,151,009 | 1.27% |
| 15 | Asian Indian | 4,143,134 | 1.27% |
| 16 | Dutch | 3,692,889 | 1.13% |
| 17 | Swedish | 3,627,796 | 1.11% |
| 18 | West Indian/Caribbean (non-Hispanic) | 3,008,035 | 0.92% |
| 19 | Scotch-Irish | 2,937,156 | 0.9% |
| 20 | Filipino | 2,884,210 | 0.88% |
| 21 | Russian | 2,538,436 | 0.78% |
| 22 | Cuban | 2,332,584 | 0.71% |
| 23 | Salvadoran | 2,244,914 | 0.68% |
| 24 | Arab | 2,056,594 | 0.62% |
| 25 | Dominican | 2,042,360 | 0.62% |
| 26 | Vietnamese | 1,852,906 | 0.56% |
| 27 | Welsh | 1,851,256 | 0.56% |
| 28 | Guatemalan | 1,484,005 | 0.45% |
| 29 | Korean | 1,477,325 | 0.45% |
| 30 | Portuguese | 1,363,964 | 0.41% |
However, demographers regard the reported number of English Americans as a statistical error, as the index of inconsistency is high and many, if not most, Americans from English stock have a tendency to identify simply as Americans,[115][116][117][118] or, if of mixed European ancestry, with a different European ethnic group.[45]
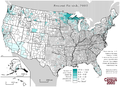
Ancestry maps
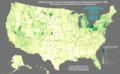
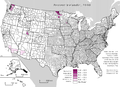
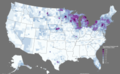
Major ancestries
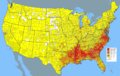
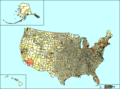
These images display frequencies of self-reported ancestries, as of the 2000 U.S. census. Regional African ancestries are not listed, though an African American map has been added from another source.
-
 Frequency of American ancestry
 -
 Density of Asian Americans
 -
 Percent of Asian Americans
 -
 Density of African Americans
 -
 Percent of African Americans
 -
 Density of Pacific Islander Americans
 -
 Percent of Pacific Islander Americans
 -
 Density of Native Americans
 -
 Percent of Native Americans
 -
 Density of White Americans
 -
 Percent of White Americans
 -
 African ancestry
 -
 Arab ancestry
 -
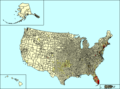
 Density of Hispanic ancestry
 -
 Percent of Hispanic ancestry
 -
 West Indian ancestry


European American ancestries
These images display frequencies of self-reported European American ancestries as of the 2000 U.S. census.
-
-
-
-
-
-

-
 French Canadian ancestry
 -

-

-
-
-

-
-

-
-
-
-

-

-
-

-

-

-


See also
- Culture of the United States
- Culture of the Southern United States
- Demographics of the United States
- Discrimination in the United States
- Ethnocultural politics in the United States
- Historical racial and ethnic demographics of the United States
- History of the United States
- History of the Southern United States
- Immigration to the United States
- Language Spoken at Home
- Nativism in United States politics
- Person of color
- Politics of the United States
- Politics of the Southern United States
- Race and crime in the United States
- Racism against African Americans
- Racism in the United States
- Religion in the United States
- Slavery in the United States
- Xenophobia in the United States
Notes
References
- ^ "Our Diverse Population: Race and Hispanic Origin, 2000" (PDF). United States Census Bureau. Retrieved April 16, 2005.
- ^ a b c d e "Revisions to the Standards for the Classification of Federal Data on Race and Ethnicity". Office of Management and Budget. Archived from the original on February 8, 2004. Retrieved May 5, 2008.
- ^ a b c d e f g h i j Grieco, Elizabeth M; Rachel C. Cassidy. "Overview of Race and Hispanic Origin: 2000" (PDF). United States Census Bureau. Retrieved January 30, 2008.
- ^ a b c d e f g h "United States Census Bureau website". 2008 Population Estimates. United States Census Bureau. Retrieved February 28, 2010.
- ^ "Irish Americans must respond to ethnic question in 2020 US Census". Retrieved May 5, 2021.
- ^ "2016 American Community Survey 1-Year Estimates". U.S. Census Fact Finder. American Community Survey. Archived from the original on August 15, 2019. Retrieved February 19, 2018.
- ^ a b c "B02001. Race – Universe: Total Population". 2008 American Community Survey 1-Year Estimates. United States Census Bureau. Retrieved February 28, 2010.
- ^ a b c "B03002. Hispanic or Latino Origin by Race – Universe: Total Population by region". 2008 American Community Survey 1-Year Estimates. United States Census Bureau. Retrieved March 2, 2010.
- ^ a b c "American Samoa 2010 Demographic Profile". American FactFinder. Archived from the original on May 3, 2017. Retrieved November 29, 2019.
- ^ a b c "American FactFinder". United States Census Bureau. Archived from the original on April 13, 2016.
"Guam / Northern Mariana Islands Demographic Profile Data". American FactFinder. 2010. Archived from the original on November 6, 2018. Retrieved November 29, 2019. - ^ a b "Puerto Rico (ACS 2013–2017 population estimates)". American FactFinder. Archived from the original on February 14, 2020. Retrieved November 29, 2019.
- ^ a b [1] American FactFinder. 2010 U.S. Virgin Islands Demographic Profile Data. Retrieved November 29, 2019.
- ^ "US population by year, race, age, ethnicity, & more". USAFacts. May 18, 2023. Retrieved June 3, 2023.
- ^ "Race and Ethnicity in the United States: 2010 Census and 2020 Census". US Census Bureau. Retrieved December 2, 2021.
- ^ a b "Public Comments to NCT Federal Register Notice" (PDF). U.S. Census Bureau; Department of Commerce. Retrieved April 19, 2016.
- ^ Alshammari, Yousef H (April 1, 2020). "Why is there no MENA category on the 2020 US census?". Al Jazeera. Retrieved September 25, 2020.
- ^ "Persons reporting some other race, percent, 2000". United States Census Bureau. Archived from the original on February 13, 2020. Retrieved July 19, 2019.
- ^ a b "Racial and Ethnic Classifications Used in Census 2000 and Beyond". United States Census Bureau. Archived from the original on November 27, 2001. Retrieved November 2, 2007.
- ^ "U.S. Census Bureau: FAQs". Ask.census.gov. Retrieved May 16, 2013.
- ^ The American FactFinder Archived August 31, 2009, at the Wayback Machine
- ^ "Introduction to Race and Ethnic (Hispanic Origin) Data for the Census 2000 Special EEO File". Archived from the original on August 13, 2009.
- ^ "Final Revisions of the Employer Information Report (EEO-1)". Archived from the original on August 13, 2009.
- ^ Orvis, Karin (March 28, 2024). "OMB Publishes Revisions to Statistical Policy Directive No. 15: Standards for Maintaining, Collecting, and Presenting Federal Data on Race and Ethnicity | OMB". The White House. Retrieved March 28, 2024.
- ^ "U.S. Office of Management and Budget's Statistical Policy Directive No. 15: Standards for Maintaining, Collecting, and Presenting Federal Data on Race and Ethnicity". U.S. Office of Management and Budget Interagency Technical Working Group on Race and Ethnicity Standards. Retrieved March 28, 2024.
- ^ "Short Form Questionnaire" (PDF). United States Census Bureau. Retrieved May 5, 2008.
- ^ "CIA – The World Factbook – Field Listing: Ethnic groups". CIA. Archived from the original on June 13, 2007. Retrieved April 2, 2010.
- ^ "U.S. Census Bureau Guidance on the Presentation and Comparison of Race and Hispanic Origin Data". United States Census Bureau. Retrieved April 6, 2007.
Race and Hispanic origin are two separate concepts in the federal statistical system. People who are Hispanic may be of any race. People in each race group may be either Hispanic or Not Hispanic. Each person has two attributes, their race (or races) and whether or not they are Hispanic.
- ^ Melvin Randolph Gilmore, "The True Logan Fontenelle", Publications of the Nebraska State Historical Society, Vol. 19, edited by Albert Watkins, Nebraska State Historical Society, 1919, p. 64, at GenNet, accessed August 25, 2011
- ^ a b "Home Page". www.freeafricanamericans.com.
- ^ Jones, Suzanne W., Race Mixing: Southern Fiction Since the Sixties, JHU Press, 2006, p. 186, ISBN 9780801883934 [2]
- ^ "American Samoa: Government and society". Encyclopædia Britannica (Online ed.). Retrieved July 1, 2020.
- ^ "About the Topic of Race". Retrieved December 7, 2022.
- ^ "The White Population: 2000" (PDF). United States Census Bureau. August 2001. Retrieved March 10, 2011.
- ^ a b c d "Quick Facts: Hawaii". United States Census Bureau. Retrieved February 10, 2022.
"Quick Facts: District of Columbia". United States Census Bureau. Retrieved February 10, 2022.
"Quick Facts: Puerto Rico". United States Census Bureau. Retrieved February 10, 2022. - ^ a b "American Samoa 2010 Demographic Profile". American FactFinder. Archived from the original on May 3, 2017. Retrieved July 25, 2020.
- ^ a b "American FactFinder". United States Census Bureau. Archived from the original on April 13, 2016.
"American FactFinder". United States Census Bureau. Archived from the original on February 12, 2020. - ^ a b "U.S. Virgin Islands", CIA World Factbook, retrieved July 25, 2020
- ^ a b c "Quick Facts: California". United States Census Bureau. Retrieved February 10, 2022.
"Quick Facts: Maryland". United States Census Bureau. Retrieved February 10, 2022.
"Quick Facts: Nevada". United States Census Bureau. Retrieved February 10, 2022.
"Quick Facts: New Mexico". United States Census Bureau. Retrieved February 10, 2022.
"Quick Facts: Texas". United States Census Bureau. Retrieved February 10, 2022. - ^ "Texas Becomes Nation's Newest "Majority-Minority" State, Census Bureau Announces". United States Census Bureau. Archived from the original on April 20, 2008. Retrieved May 5, 2008.
- ^ a b c "QuickFacts: United States". U.S. Census Bureau. Retrieved July 25, 2020.
- ^ Sharing the Dream: White Males in a Multicultural America By Dominic J. Pulera.
- ^ Farley, Reynolds (January 1, 1991). "The New Census Question about Ancestry: What Did It Tell Us?". Demography. 28 (3): 411–429. doi:10.2307/2061465. JSTOR 2061465. PMID 1936376. S2CID 41503995.
- ^ Stanley Lieberson and Lawrence Santi, 'The Use of Nativity Data to Estimate Ethnic Characteristics and Patterns', Social Science Research, Vol. 14, No. 1 (1985), pp. 44–46.
- ^ Stanley Lieberson and Mary C. Waters, 'Ethnic Groups in Flux: The Changing Ethnic Responses of American Whites', Annals of the American Academy of Political and Social Science, Vol. 487, No. 79 (September 1986), pp. 82–86.
- ^ a b Mary C. Waters, Ethnic Options: Choosing Identities in America (Berkeley: University of California Press, 1990), p. 36.
- ^ "The Hispanic Population: 2010" (PDF). census.gov. U.S. Department of Commerce. Retrieved August 13, 2021.
- ^ Tafoya, Sonya (2004). "Shades of Belonging" (PDF). Pew Hispanic Center. Archived from the original (PDF) on May 28, 2008. Retrieved January 22, 2008.
- ^ Mikati, Massarah (July 6, 2019). "Arab Americans, others of Middle Eastern descent say Census forms make them feel invisible". Houston Chronicle.
- ^ "3.5 Million Reported Middle Eastern and North African Descent in 2020". Census.gov. September 21, 2023. Retrieved May 21, 2024.
- ^ Kayyali, Randa (2006). The Arab Americans. Westport, CT: Greenwood Press. pp. 45–64.
- ^ a b Arab American Institute Foundation (2014). "Demographics" (PDF). Retrieved February 6, 2018.
- ^ Angela Brittingham; G. Patricia de la Cruz (2005). "We the People of Arab Ancestry in the United States" (PDF). U.S. Census Bureau. Retrieved February 6, 2018.
- ^ a b "Quick Facts about Arab Americans" (PDF). Arab American Institute. Retrieved February 9, 2018.
- ^ "Arab American community in California, the largest". Arab America.
- ^ Nabeel, Abraham; Shryock, Andrew (2000). Arab Detroit: From Margin to Mainstream. Detroit, Michigan: Wayne State University Press. ISBN 9780814328125.
- ^ Hassoun, Rosina (2005). Arabs in Michigan. East Lansing, Michigan: Michigan State University Press. ISBN 9780870136672.
- ^ "Lobbying for a 'MENA' category on U.S. Census" Wiltz, Teresea. USA Today. Published October 7, 2014. Accessed December 14, 2015.
- ^ Cohen, Debra Nussbaum. "New U.S. Census Category to Include Israeli' Option". Haaretz. Retrieved December 16, 2015.
- ^ "2015 National Content Test" (PDF). U.S. Census Bureau. pp. 33–34. Retrieved December 13, 2015.
The Office of Management and Budget is undertaking related mid-decade research for coding and classifying detailed national origins and ethnic groups, and is considering adding a Middle Eastern or North African checkbox in a combined race and ethnicity question. Our consultations with external experts on the Asian community have also suggested Sikh receive a unique code classified under Asian. The Census Bureau does not currently tabulate on religious responses to the race or ethnic questions (e.g., Sikh, Jewish, Catholic, Muslim, Lutheran, etc.).
- ^ "2015 National Content Test" (PDF). U.S. Census Bureau. p. 60. Retrieved December 13, 2015.
- ^ Mirsky, Maya (May 4, 2023). "Are Jews white? Proposed census change wades into issue". The Jewish News of Northern California – via Newspapers.com.
- ^ "What Updates to OMB's Race/Ethnicity Standards Mean for the Census Bureau". United States Census Bureau. April 8, 2024.
- ^ Humes, Karen R.; Jones, Nicholas A.; Ramirez, Roberto R. (March 2011). "Overview of Race and Hispanic Origin: 2010" (PDF). United States Census Bureau. Retrieved January 2, 2015.
- ^ "B03002 HISPANIC OR LATINO ORIGIN BY RACE – United States – 2018 American Community Survey 1-Year Estimates". United States Census Bureau. July 1, 2018. Retrieved November 25, 2019.
- ^ a b "United States – Selected Population Profile in the United States (Hispanic or Latino (of any race))". 2008 American Community Survey 1-Year Estimates. United States Census Bureau. Archived from the original on September 2, 2010. Retrieved April 8, 2010.
- ^ "American FactFinder Help; Hispanic or Latino origin". United States Census Bureau. Archived from the original on May 24, 2017. Retrieved September 13, 2017.
- ^ "B03001 HISPANIC OR LATINO ORIGIN BY SPECIFIC ORIGIN - United States - 2019 American Community Survey 1-Year Estimates". United States Census Bureau. July 1, 2019. Retrieved February 4, 2021.
- ^ Noe-Bustamante, Luis; Flores, Antonio; Shah, Sono. "Facts on Hispanics of Honduran origin in the United States, 2017". Pew Research Center. Retrieved February 10, 2022.
- ^ Flores, Antonio (September 18, 2017). "How the U.S. Hispanic population is changing". Pew Research Center.
- ^ "Projected Population of the United States, by Race and Hispanic Origin: 2000 to 2050" (PDF). United States Census Bureau. 2004. Archived from the original (PDF) on March 6, 2008. Retrieved May 5, 2008.
- ^ "US Census Press Releases". United States Census Bureau. March 18, 2004. Archived from the original on March 13, 2008. Retrieved May 5, 2008.
- ^ a b "Race, Ethnicity, and Language data – Standardization for Health Care Quality Improvement" (PDF). Institute of Medicine of the National Academies. Retrieved May 10, 2016.
- ^ a b Sonya Tastogi; Tallese D. Johnson; Elizabeth M. Hoeffel; Malcolm P. Drewery, Jr. (September 2011). "The Black Population: 2010" (PDF). United States Census Bureau. United States Department of Commerce. Retrieved September 11, 2012.
- ^ United States – ACS Demographic and Housing Estimates: 2009 Archived February 11, 2020, at archive.today. Factfinder.census.gov. Retrieved December 9, 2010.
- ^ Grieco, Elizabeth M.; Acosta, Yesenia D.; de la Cruz, G. Patricia; Gamino, Christina; Gryn, Thomas; Larsen, Luke J.; Trevelyan, Edward N.; Walters, Nathan P. (May 2012). "The Foreign Born Population in the United States: 2010" (PDF). American Community Survey Reports. United States Census Bureau. Archived from the original (PDF) on February 9, 2015. Retrieved January 27, 2015.
- ^ a b "2010 Census Shows Black Population has Highest Concentration in the South". United States Census Bureau. United States Department of Commerce. September 29, 2011. Archived from the original on September 15, 2012. Retrieved September 11, 2012.
- ^ Bureau, U.S. Census. "American FactFinder – Results". factfinder2.census.gov.[permanent dead link]
- ^ "The size and regional distribution of the black population". Lewis Mumford Center. Archived from the original on October 12, 2007. Retrieved October 1, 2007.
- ^ "New World Exploration and English Ambition". The Terrible Transformation. PBS. Archived from the original on June 14, 2007. Retrieved September 11, 2011.
- ^ Gomez, Michael A. (1998). Exchanging Our Country Marks: The Transformation of African Identities in the Colonial and Antebellum South. University of North Carolina Press. p. 384. ISBN 9780807846940.
- ^ Wood, Gordon S. (2002). The American revolution: a history. Modern Library. p. 55. ISBN 9780679640578.
- ^ Liberty! The American Revolution (Documentary) Episode II:Blows Must Decide: 1774–1776. ©1997 Twin Cities Public Television, Inc. ISBN 1-4157-0217-9
- ^ Foner, Philip Sheldon (1976). Blacks in the American Revolution. Volume 55 of Contributions in American history. Greenwood Press. p. 70. ISBN 9780837189468.
- ^ "Black Loyalists". Black Presence. The National Archives. Retrieved September 11, 2012.
- ^ Nicholas Boston; Jennifer Hallam (2004). "Freedom & Emancipation". Educational Broadcasting Corporation. Public Broadcasting Service. Retrieved September 11, 2012.
- ^ "13th Amendment to the U.S. Constitution". ourdocuments.gov. National Archives and Records Administration. Retrieved September 11, 2012.
- ^ "The Fifteenth Amendment in Flesh and Blood". Office of the Clerk. United States House of Representatives. Archived from the original on December 11, 2012. Retrieved September 11, 2012.
- ^ Walter, Hazen (2004). American Black History. Lorenz Educational Press. p. 37. ISBN 9780787706036. Retrieved September 11, 2012.
- ^ "The Prize". We Shall Overcome. National Park Service. Retrieved September 11, 2012.
- ^ Kusow, AM. "African Immigrants in the United States: Implications for Affirmative Action". Iowa State University. Retrieved May 10, 2016.
- ^ "Lewis Mumford Center Census 2000 Metropolitan Racial and Ethnic Change Series". October 12, 2007. Archived from the original on October 12, 2007.
- ^ Greenwood, Shannon (January 20, 2022). "1. The Caribbean is the largest origin source of Black immigrants, but fastest growth is among African immigrants".
- ^ "B02001. RACE – Universe: TOTAL POPULATION regions and states". 2008 American Community Survey 1-Year Estimates. United States Census Bureau. Retrieved April 25, 2010.
- ^ "Asian Americans". Pew Research Center's Social & Demographic Trends Project. June 18, 2012. Retrieved June 7, 2016.
- ^ "10 Facts about Guyanese Immigrants in the US You Should Know". May 9, 2016.
- ^ "Overview of 2020 AIAN Redistricting Data: 2020" (PDF). Retrieved January 16, 2022.
- ^ Bryc, Katarzyna; Durand, Eric Y.; Macpherson, J. Michael; Reich, David; Mountain, Joanna L. (January 2015). "The Genetic Ancestry of African Americans, Latinos, and European Americans across the United States". The American Journal of Human Genetics. 96 (1): 37–53. doi:10.1016/j.ajhg.2014.11.010. ISSN 0002-9297. PMC 4289685. PMID 25529636.
- ^ Carl Zimmer (December 24, 2014). "White? Black? A Murky Distinction Grows Still Murkier". The New York Times. Retrieved October 21, 2018.
The researchers found that European-Americans had genomes that were on average 98.6 percent European, .19 percent African, and .18 percent Native American.
- ^ "Research Guides and Class Pages: Native American & Indigenous Studies: Cherokee".
- ^ Bureau, US Census. "Census Bureau Releases 2020 Census Data for Nearly 1,500 Detailed Race and Ethnicity Groups, Tribes and Villages". Census.gov. Retrieved April 1, 2024.
- ^ "Analysis | The Native American population exploded, the census shows. Here's why". Washington Post. October 27, 2023. Retrieved April 1, 2024.
- ^ "B02012. NATIVE HAWAIIAN AND OTHER PACIFIC ISLANDER ALONE OR IN COMBINATION WITH ONE OR MORE OTHER RACES". 2008 American Community Survey 1-Year Estimates. United States Census Bureau. Retrieved May 11, 2010.
- ^ Jones, Nicholas A.; Amy Symens Smith. "The Two or More Races Population: 2000. Census 2000 Brief" (PDF). United States Census Bureau. Retrieved May 8, 2008.
- ^ "Allen Turner". Archived from the original on October 2, 2008. Retrieved November 9, 2008.
- ^ a b Mark D. Shriver; et al. (2003). "Skin pigmentation, biogeographical ancestry and admixture mapping" (PDF). Human Genetics. 112 (4): 387–399. doi:10.1007/s00439-002-0896-y. PMID 12579416. S2CID 7877572. Retrieved August 24, 2017.
- ^ "Robert Stuckert, "African Ancestry Of The White American Population"" (PDF). Retrieved May 16, 2013.
- ^ Collins-Schramm, Heather E. (2002). "Markers that Discriminate Between European and African Ancestry Show Limited Variation Within Africa". Human Genetics. 111 (6): 566–569. doi:10.1007/s00439-002-0818-z. PMID 12436248. S2CID 30319228.
- ^ Parra, Esteban J.; Marcini, Amy; Akey, Joshua; Martinson, Jeremy; Batzer, Mark A.; Cooper, Richard; Forrester, Terrence; Allison, David B.; Deka, Ranjan; Ferrell, Robert E.; Shriver, Mark D. (1998). "Estimating African American Admixture Proportions by Use of Population- Specific Alleles" (PDF). American Journal of Human Genetics. 63 (6): 1839–1851. doi:10.1086/302148. PMC 1377655. PMID 9837836. Archived from the original (PDF) on March 4, 2009. Retrieved May 16, 2013.
- ^ Race, Ethnicity, and Genetics Working Group (2005). "The Use of Racial, Ethnic, and Ancestral Categories in Human Genetics Research". American Journal of Human Genetics. 77 (4): 519–532. doi:10.1086/491747. PMC 1275602. PMID 16175499.
- ^ "The World Factbook – United States". CIA. Retrieved May 8, 2008.
- ^ "Explore Census Data". data.census.gov.
- ^ "Explore Census Data". data.census.gov.
- ^ "Explore Census Data". data.census.gov.
- ^ "Explore Census Data". data.census.gov.
- ^ Pulera, Dominic (October 20, 2004). Sharing the Dream: White Males in Multicultural America. A&C Black. ISBN 9780826416438. Retrieved August 21, 2017 – via Google Books.
- ^ Reynolds Farley, 'The New Census Question about Ancestry: What Did It Tell Us?', Demography, Vol. 28, No. 3 (August 1991), pp. 414, 421.
- ^ Stanley Lieberson and Lawrence Santi, 'The Use of Nativity Data to Estimate Ethnic Characteristics and Patterns', Social Science Research, Vol. 14, No. 1 (1985), pp. 44-46.
- ^ Stanley Lieberson and Mary C. Waters, "Ethnic Groups in Flux: The Changing Ethnic Responses of American Whites", Annals of the American Academy of Political and Social Science, Vol. 487, No. 79 (September 1986), pp. 82-86.
External links
- American Factfinder; keyword search for "Ancestry", all programs; United States Census Bureau
- For additional county-level U.S. maps on a wide range of ethnic and nationality groups, visit the Map Gallery of Ethnic Groups in the United States Archived March 10, 2013, at the Wayback Machine, part of the course materials for American Ethnic Geography at Valparaiso University.
- American terminology for different racial groups by sociologist Pamela E. Oliver