

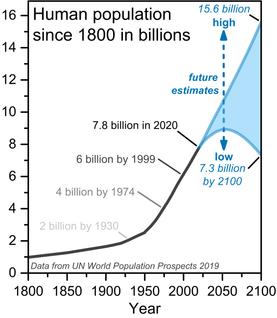
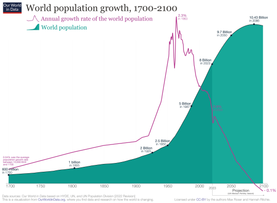
Population growth is the increase in the number of people in a population or dispersed group. Actual global human population growth amounts to around 83 million annually, or 1.1% per year.[2] The global population has grown from 1 billion in 1800 to 7.9 billion in 2020.[3] The UN projected population to keep growing, and estimates have put the total population at 8.6 billion by mid-2030, 9.8 billion by mid-2050 and 11.2 billion by 2100.[4] However, some academics outside the UN have increasingly developed human population models that account for additional downward pressures on population growth; in such a scenario population would peak before 2100.[5] Others have challenged many recent population projections as having underestimated population growth.[6]
The world human population has been growing since the end of the Black Death, around the year 1350.[7] A mix of technological advancement that improved agricultural productivity[8] and sanitation and medical advancement that reduced mortality increased population growth. In some geographies, this has slowed through the process called the demographic transition, where many nations with high standards of living have seen a significant slowing of population growth. This is in direct contrast with less developed contexts, where population growth is still happening.[9] Globally, the rate of population growth has declined from a peak of 2.2% per year in 1963.[10] The global human population is projected to peak during the mid-21st century and decline by 2100.[11]
Population growth alongside increased consumption is a driver of environmental concerns, such as biodiversity loss and climate change,[12][13] due to overexploitation of natural resources for human development.[14] International policy focused on mitigating the impact of human population growth is concentrated in the Sustainable Development Goals which seeks to improve the standard of living globally while reducing the impact of society on the environment while advancing human well-being.[citation needed]
| Years passed |
Year | Pop. (billions) |
|---|---|---|
| – | 1800 | 1 |
| 127 | 1927 | 2 |
| 33 | 1960 | 3 |
| 14 | 1974 | 4 |
| 13 | 1987 | 5 |
| 12 | 1999 | 6 |
| 12 | 2011 | 7 |
| 11 | 2022 | 8 |
| 14 | 2037* | 9 |
| 18 | 2055* | 10 |
| 33 | 2088* | 11 |
| *World Population Prospects 2017 (United Nations Population Division) | ||
YouTube Encyclopedic
-
1/5Views:1 360 730205 32813 446 9946 146 701582 048
-
Human Population Growth - Crash Course Ecology #3
-
How Populations Grow and Change: Crash Course Geography #33
-
Overpopulation – The Human Explosion Explained
-
7 Billion: How Did We Get So Big So Fast? | SKUNK BEAR
-
Exponential Growth and Decay Calculus, Relative Growth Rate, Differential Equations, Word Problems
Transcription
If being alive on Earth were some kind of contest, humans, I think, would win it, hands down. As a population of organisms, we're the Michael Phelps of being alive, only we have like 250,000 times more gold medals. Last week, we talked about exponential growth, when a population grows at a rate proportional to the size of the population, even as that size of the population keeps increasing. Well, since around the year 1650, the human population has been undergoing probably the longest period of exponential growth of any large animal in history, ever. In 1650, there were about 500 million people on the planet. By 1850, the population had doubled to one billion, and it doubled again just 80 years after that, and doubled again just 45 years after that. We are now well past 7 billion now, and counting. So, think about this: Today there are 80-year olds who have watched the population of their species on Earth triple. So, why is this happening? And...how? And how long can it go on? Because it's kind of uncomfortable. Let's say you're shopping for dinner, and bear with me, we're going to relate it back to ecology in a second, but you have a lot of choices at your grocery store. You could buy 5 packs of ramen for a dollar or you could buy some fancy ravioli made by Italian nuns out of organic pasta for like $20 dollars a pound. They're both noodles. They're both food. But, you know, with the ramen you get more, whereas with the handmade stuff it tastes better. It's higher quality. What do you do? It's a perennial problem in nature, and in our lives, satisfying the two competing impulses: do I have more, or do I have the best? Quantity or quality? Tough choice. Although we're not really aware of it, all organisms make a similar choice through how they reproduce. In ecology, we size up who chooses quantity over quality by something called the R vs. K Selection Theory. The R vs. K Selection Theory says that some organisms will reproduce in a way that aims for huge, exponential growth, while others are just content to hit the number of individuals that their habitat can support, that is, the carrying capacity, and then stay around that level. Species that reproduce in a way that leads to very fast growth are called R-selected species, because "R" is the maximum growth rate of a population when you're talking math talk, as we learned last week. Very strongly R-selected animals make a lot of babies in their lifetime and just hope that they make it. If some of the babies get eaten or something, no biggie: there are others where those came from. On the other hand, K-selected species only make a few babies in their lifetime, and invest in them very heavily. "K" in math language is carrying capacity, since K-selected species usually end up living at population densities closer to their carrying capacity than r-selected ones. Of course, things aren't so cut and dry in nature. Most animals aren't very strongly K-selected or r-selected. It's actually, you know, a spectrum: Some organisms, usually smallish ones, reproducing more on the r side, and others, usually larger ones, on the K side. Most species are somewhere in the middle. So, the reason I'm telling you this is to drive home how bananas it is that humans have gotten to the population size we have: Because we tend to reproduce way on the K-selected side of the spectrum. We're pretty big mammals who usually have only a few kids during our lifetimes, and those kids are a total pain in the butt to raise, but we put a ton of resources into them anyway. So even though humans reproduce K-selected-ish-ly, for the past few centuries, our population growth curve has been looking suspiciously like that of a R-selected species. And exponential growth, even for R-selected species, usually does not go on for 350 years. So how did this all happen? Well, the short answer is, humans figured out how to raise our carrying capacity, so far, indefinitely. And we did this by eliminating a bunch of obstacles that would have made our numbers level off at a carrying capacity a long time ago. These obstacles, you will recall, are limiting factors, and we've managed to blast them to pieces in a few different ways. First, we've upped our ability to feed ourselves. Our crazy-rapid population growth started in Europe around the 17th century, because that's when agriculture was becoming echanized, and fancy new farming practices like the domestication of animals and crops, were increasing food production. From Europe, those agricultural practices and their accompanying population explosion spread to the New World and to much of the rest of the world by the mid-19th century. Another game-changer for the human population came in the form of medical advances. Anton van Leeuwenhoek, Father of Microbiology all around really smart guy, was the first modern scientist to propose the germ theory of disease in 1700, and even though it took about a century and a half for people to take it seriously, it revolutionized human health, leading to things like vaccinations. Suddenly people stopped dying of stupid, avoidable stuff as they had been for thousands of years, which meant that everybody lived longer: childhood survival rates improved, and those kids went on to make their own babies and get very, very old. And we also increased our carrying capacity by not being so disgusting. We figured out that you can't just sit around in your own poop and live to tell the tale. So sewage systems became a thing. In Europe at least, it started around the 1500s, but they weren't widely used until the 1800s, and we all benefited from that. And finally, we've gotten a lot better at living comfortably in inhospitable places. That is to say, people had been living in deserts and tundra for thousands of years, but in the 20th century, we expanded the human habitat to pretty much everywhere in the world, thanks to heating, air conditioning, warm clothes, airplanes and trucks that bring food everywhere from Svalbard, Norway to New South Wales. So for all those reasons and more, humans have been able to avoid that old party pooper, Carrying Capacity. Which is good because I don't like it when people die. Its just...it's just a downer. And a lot of smart scientists, mathematicians and economists have argued that each person born in the past 350 years has not only represented another mouth to feed but also two hands to work to raise the human carrying capacity, just enough for themselves and a teensy bit more. So then as our population grows, our carrying capacity grows right along with it, like some really steep escalator going up and the ceiling just above our heads. And if it stayed there, we'd all get squished, but it keeps moving. But of course this can't go on forever. The human population does have a carrying capacity, it's just that nobody's sure what that is. Back in 1679, it was Leeuwenhoek himself who was the first to publicly hazard a guess about the earth's carrying capacity for humans, guessing it to be around 13.4 billion people. Since then, estimates have ranged from 1 billion to 1 trillion, which is 1,000 billion. So that seems a little extreme, but the averages of these estimates are from 10-15 billion folks. Now, we need a lot of obvious things to survive: food, clean water, nonrenewable resources like metals and fossil fuels. But everything that we consume requires space, whether it's space to grow, to mine, to produce, or to put our waste. So a lot of ecologists make their estimates of how many people this planet can handle based on an ecological footprint, a calculation of how much land and how many resources each person on the planet requires to live. That footprint is very different depending on where you live and what your habits are. People in India use a lot fewer resources, and therefore, space, than Americans, for example. Meat eaters require a lot more acreage than vegetarians. In fact, if everybody on the planet ate as much meat as the wealthiest people in the world do, current food harvests could feed less than half of the present world's population. So, despite the fact that the earth is a very big place, space is a real limiting factor for us. And as our population grows, there will probably be more conflict over how our space is used. For instance, if there really were a trillion people on the planet, everybody would have to live, grow food on and poop on a 12m x 12m patch of ground, about half the size of tennis court. So it could be that you could fit a thousand billion people on Earth, but I can guarantee that those people would have a hard time getting along with each other. But how about we stop thinking about ourselves just for a moment. As we take up more space, we also leave less space for other species. And as we use resources, like trees, soil, and clean water, that reduces the amount available to all kinds of other organisms. This is why biologists say that we are living through one of the biggest extinction events in recent geological history: We're outcompeting other species for the very basics of life. And eventually, or in the case of oil and water, already, we're starting to compete with ourselves as a species. So, serious stuff here. But here's a little glimmer of hope: Unlike some other animals, a lot of our actions are based on a little thing called culture, and human culture has brought about some huge changes in the last 50 years. The fact is, even though the human population continues to grow, the rate of population growth actually peaked around 1962, and has been declining ever since. At its peak, the human population was growing at about 2.2% per year, and these days, it's declined to around 1.1% per year, and it's still falling. Families in most industrialized countries are getting smaller and smaller. But why? Well, part of it has to do with women. As women in developed nations get more education, they are having babies later in life. And when an animal doesn't reproduce to its fullest potential, meaning it doesn't start having babies as soon as it's sexually able to, that animal is going to have fewer offspring. Also, if you give women more choices and more education, they might be liable to choose a second career in astrophysicists rather than becoming a mother. Another reason for the falling population growth rate has to do with the way that we live our lives. Back in the early the 20th century, more of the world worked on farms and maybe ate their own food. Kids were a real asset to a farm back then. It's a good example of that idea about more hands doing more work to increase the carrying capacity of the human population. Yeah, kids were extra mouths to feed, but they were also a really important work force, and you could just feed the kids the stuff you were producing. That's what we call a positive feedback loop: as the population grows, the workforce gets bigger, and the place, as a result, supports more of us. But these days, that's not happening so much anymore. More and more people are living in cities, where you don't need kids to help with the crops, so fewer people are having them, because a) they cost a lot of money to raise, b) they're not bringing in money like they were back on the farm, c) a lot of people have access to good birth control so they don't have as many "oops children." All these factors together are forming a negative feedback loop: The effects of reproduction in this case work to slow down the rate of reproduction. But just because our population's growth rate is decreasing doesn't mean that this juggernaut of humanity is going to stop anytime soon. In addition to reminding us that the rules of ecology apply to us just like any other organism, human population is important to think about because we kind of need to do something about it. And I think pretty much every other species on the planet would agree with me on that. Thanks for watching this episode of Crash Course Ecology and thanks to all the people who helped us put it together. If you want to review anything from this episode there's a table of contents over there. And if you have any questions or ideas or comments, we're on Facebook and Twitter, and of course, down in the comments below. We'll see you next time.
History
World population has been rising continuously since the end of the Black Death, around the year 1350.[7] Population began growing rapidly in the Western world during the industrial revolution. The most significant increase in the world's population has been since the 1950s, mainly due to medical advancements[16] and increases in agricultural productivity.[17][18]
Haber process
Due to its dramatic impact on the human ability to grow food, the Haber process, named after one of its inventors, the German chemist Fritz Haber, served as the "detonator of the population explosion", enabling the global population to increase from 1.6 billion in 1900 to 7.7 billion by November 2019.[19]
Thomas McKeown hypotheses
Some of the reasons for the "Modern Rise of Population"[20] were particularly investigated by the British health scientist Thomas McKeown (1912–1988). In his publications, McKeown challenged four theories about the population growth:
- McKeown stated that the growth in Western population, particularly surging in the 19th century, was not so much caused by an increase in fertility, but largely by a decline of mortality particularly of childhood mortality followed by infant mortality,[21][22]
- The decline of mortality could largely be attributed to rising standards of living, whereby McKeown put most emphasis on improved nutritional status,
- McKeown questioned the effectiveness of public health measures, including sanitary reforms, vaccination and quarantine,[23]
- The “McKeown thesis" states that curative medicine measures played little role in mortality decline, not only prior to the mid-20th century[21] but also until well into the 20th century.[24]
Although the McKeown thesis has been heavily disputed, recent studies have confirmed the value of his ideas.[25] His work is pivotal for present day thinking about population growth, birth control, public health and medical care. McKeown had a major influence on many population researchers, such as health economists and Nobel prize winners Robert W. Fogel (1993) and Angus Deaton (2015). The latter considered McKeown as "the founder of social medicine".[26]
Growth rate models
The "population growth rate" is the rate at which the number of individuals in a population increases in a given time period, expressed as a fraction of the initial population. Specifically, population growth rate refers to the change in population over a unit time period, often expressed as a percentage of the number of individuals in the population at the beginning of that period. This can be written as the formula, valid for a sufficiently small time interval:

A positive growth rate indicates that the population is increasing, while a negative growth rate indicates that the population is decreasing. A growth ratio of zero indicates that there were the same number of individuals at the beginning and end of the period—a growth rate may be zero even when there are significant changes in the birth rates, death rates, immigration rates, and age distribution between the two times.[27]
A related measure is the net reproduction rate. In the absence of migration, a net reproduction rate of more than 1 indicates that the population of females is increasing, while a net reproduction rate less than one (sub-replacement fertility) indicates that the population of females is decreasing.
Most populations do not grow exponentially, rather they follow a logistic model. Once the population has reached its carrying capacity, it will stabilize and the exponential curve will level off towards the carrying capacity, which is usually when a population has depleted most its natural resources.[28] In the world human population, growth may be said to have been following a linear trend throughout the last few decades.[10]

Logistic equation
The growth of a population can often be modelled by the logistic equation[29]

where
- = the population after time t;
- = time a population grows;
- = the relative growth rate coefficient;
- = the carrying capacity of the population; defined by ecologists as the maximum population size that a particular environment can sustain.[28]


As it is a separable differential equation, the population may be solved explicitly, producing a logistic function:
- ,

where and is the initial population at time 0.


Population growth rate
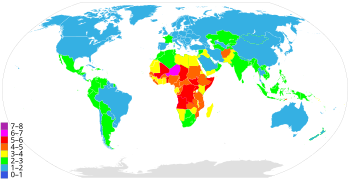
| 7–8 children 6–7 children | 5–6 children 4–5 children | 3–4 children 2–3 children | 1–2 children 0–1 children |
The world population growth rate peaked in 1963 at 2.2% per year and subsequently declined.[10] In 2017, the estimated annual growth rate was 1.1%.[30] The CIA World Factbook gives the world annual birthrate, mortality rate, and growth rate as 1.86%, 0.78%, and 1.08% respectively.[31] The last 100 years have seen a massive fourfold increase in the population, due to medical advances, lower mortality rates, and an increase in agricultural productivity made possible by the Green Revolution.[32]
The annual increase in the number of living humans peaked at 88.0 million in 1989, then slowly declined to 73.9 million in 2003, after which it rose again to 75.2 million in 2006. In 2017, the human population increased by 83 million.[30] Generally, developed nations have seen a decline in their growth rates in recent decades, though annual growth rates remain above 2% in some countries of the Middle East and Sub-Saharan Africa, and also in South Asia, Southeast Asia, and Latin America.[33]
In some countries the population is declining, especially in Eastern Europe, mainly due to low fertility rates, high death rates and emigration. In Southern Africa, growth is slowing due to the high number of AIDS-related deaths. Some Western Europe countries might also experience population decline.[34] Japan's population began decreasing in 2005.[35]
The United Nations Population Division projects world population to reach 11.2 billion by the end of the 21st century. The Institute for Health Metrics and Evaluation projects that the global population will peak in 2064 at 9.73 billion and decline to 8.89 billion in 2100. [11] A 2014 study in Science concludes that the global population will reach 11 billion by 2100, with a 70% chance of continued growth into the 22nd century.[36][37] The German Foundation for World Population reported in December 2019 that the global human population grows by 2.6 people every second, and could reach 8 billion by 2023.[38][39]
Growth by country
According to United Nations population statistics, the world population grew by 30%, or 1.6 billion humans, between 1990 and 2010.[40] In number of people the increase was highest in India (350 million) and China (196 million). Population growth rate was among highest in the United Arab Emirates (315%) and Qatar (271%).[40]
| Rank | Country | Population | Annual Growth (%) | |||
|---|---|---|---|---|---|---|
| 1990 | 2010 | 2020 (est.)[41] | 1990–2010 | 2010–2020 | ||
| World | 5,306,425,000 | 6,895,889,000 | 7,503,828,180 | 1.3% | 0.8% | |
| 1 | 1,139,060,000 | 1,341,335,000 | 1,384,688,986 | 0.8% | 0.3% | |
| 2 | 873,785,000 | 1,224,614,000 | 1,333,000,000 | 1.7% | 0.9% | |
| 3 | 253,339,000 | 310,384,000 | 329,256,465 | 1.0% | 0.6% | |
| 4 | 184,346,000 | 239,871,000 | 262,787,403 | 1.3% | 0.9% | |
| 5 | 149,650,000 | 194,946,000 | 208,846,892 | 1.3% | 0.7% | |
| 6 | 111,845,000 | 173,593,000 | 207,862,518 | 2.2% | 1.8% | |
| 7 | 97,552,000 | 158,423,000 | 203,452,505 | 2.5% | 2.5% | |
| 8 | 105,256,000 | 148,692,000 | 159,453,001 | 1.7% | 0.7% | |
| 9 | 148,244,000 | 142,958,000 | 142,122,776 | -0.2% | −0.1% | |
| 10 | 122,251,000 | 128,057,000 | 126,168,156 | 0.2% | −0.1% | |
Many of the world's countries, including many in Sub-Saharan Africa, the Middle East, South Asia and South East Asia, have seen a sharp rise in population since the end of the Cold War. The fear is that high population numbers are putting further strain on natural resources, food supplies, fuel supplies, employment, housing, etc. in some of the less fortunate countries. For example, the population of Chad has ultimately grown from 6,279,921 in 1993 to 10,329,208 in 2009,[42] further straining its resources. Vietnam, Mexico, Nigeria, Egypt, Ethiopia, and the DRC are witnessing a similar growth in population.
The following table gives some example countries or territories:
| Country/territory | Life expectancy in years (2008) |
Total population growth from 1960s to 2007–2011 | |||||
|---|---|---|---|---|---|---|---|
| 1967 | 1990 | 1994 | 2002 | 2008 | |||
| N/A* | N/A* | 3,437,000[43] | 4,298,269 | 5,673,520[44] | 61[45] | 2,236,520 | |
| 23,457,000*[46] | 50,974,000* [47] | 54,939,000[43] | 67,673,031(2003) | 79,221,000[48] | 55[45] | 55,764,000 | |
| 14,355,000†[46] | 25,204,000† [47] | 27,361,000†[43] | 38,114,160 (2003)† | 42,272,000†[44] | 50†[45] | 27,917,000 | |
| 3,410,000[46] | 5,679,000[47] | 6,183,000[43] | 9,253,493(2003) | 10,329,208 (2009)[42] | 47[45] | 6,919,205 | |
| 3,546,000[46] | 7,732,000[47] | 8,846,000[43] | 10,790,352 (2001) | 15,306,252 (2009)[49] | 44[45] | 11,760,252 | |
| 61,450,000[46] | 88,500,000[47] | 108,467,000[43] | 129,934,911 | 158,259,000[44] | 47[45] | 96,809,000 | |
| 4,745,000[46] | 8,156,000[47] | 10,462,000[43] | 11,340,480 | 14,517,176(2010)[50] | 50[45] | 9,772,176 | |
| 1,050,000[46] | 2,025,000 [47] | 2,211,000[43] | 2,667,859 (2003) | 3,291,000 (2009)[42] | 54[45] | 2,241,000 | |
| 3,607,000[46] | 7,327,000[47] | 8,102,000[43] | 9,967,215 | 13,711,597 (2009)[51] | 57[45] | 10,104,597 | |
| 343,000[46] | 861,000[47] | 1,081,000[43] | 1,367,124 (2000) | 1,705,000[44] | 55[45] | 1,362,000 | |
| 11,833,126 [46] | 25,012,000[47] | 27,325,000 [43] | 32,818,500 (2003) | 34,895,000[48][52] | 74[45] | 23,061,874 | |
| 16,353,000[46] | 35,562,000[47] | 42,552,000[43] | 55,225,478 (2003) | 70,916,439 [48][53] | 54[45] | 54,563,439 | |
| 30,083,419 [46] | 53,153,000[47] | 58,326,000[43] | 70,712,345 (2003) | 79,089,650 [48][54] | 72[45] | 49,006,231 | |
(overseas region of France) |
418,000[46] | N/A[47] | N/A[43] | 720,934 (2003) | 827,000 (2009) [44] | N/A[45] | 409,000 |
(British Overseas Territory) |
2,500[46] | N/A[47] | N/A[43] | 2,967 (2003) | 3,140(2010)[55] | N/A[45] | 640 |
| 8,935,500[46] | 13,173,000[47] | 13,994,000[43] | 15,116,435 | 17,224,200 (2011) | 77[45] | 8,288,700 | |
| 19,191,000[46] | 32,987,000[47] | 34,520,000[43] | 41,088,227 | 45,925,397 (2010)[56] | 73[45] | 26,734,397 | |
| 85,655,000[46] | 150,368,000[47] | 153,725,000[43] | 174,468,575 (2000) | 190,732,694 (2010) [57] | 72[45] | 105,077,694 | |
| 45,671,000[46] | 86,154,000[47] | 93,008,000[43] | 103,400,165 (2000) | 112,322,757 (2010)[58] | 76[45] | 66,651,757 | |
| 476,727 (1966)[46] | 765,000[47] | 771,000[43] | 844,330 (2001) | 849,000[52] (2010) | 70[45] | 372,273 | |
| 6,050 [46] | 10,000[47] | N/A[43] | 12,329 | 9,322 (2011)[59] | N/A[45] | 3,272 | |
| 1,876,000[46] | 2,420,000[47] | 2,429,000[43] | 2,695,867 (2003) | 2,847,232[60](2010) | 74[45] | 971,232 | |
| 11,540,764 [46] | 17,086,000[47] | 17,843,000[43] | 19,546,792 (2003) | 26,838,200[61] (2010) | 82[45] | 10,066,508 | |
| 1,965,500 (1964)[46] | 3,250,000[47] | 3,414,000[43] | 3,510,484 | 2,986,952 (July 2010 est.)[42][62] | 78[45] | 1,021,452 | |
| 31,944,000[46] | 38,180,000[47] | 38,554,000[43] | 38,626,349 (2001) | 38,192,000 (2010)[63] | 75[45] | 6,248,000 | |
| 10,212,000[46] | 10,553,000[47] | 10,261,000[43] | 10,106,017 | 9,979,000 (2010)[64] | 73[45] | -142,000 | |
| 8,226,564 (1965)[46] | 8,980,000[47] | 8,443,000[43] | 7,707,495(2000) | 7,351,234 (2011)[65] | 73[45] | -875,330 | |
| 55,068,000 (1966)[46] | 57,411,000[47] | 58,091,000[43] | 58,789,194 | 62,008,048 (2010)[66] | 79[45] | 7,020,048 | |
| 2,884,002 (1966)[46] | 3,503,000[47] | 3,571,000[43] | 3,840,838 (2000) | 4,470,700[67] (2010) | 78[45] | 1,586,698 | |
| 720,000,000[46] | 1,139,060,000[47] | 1,208,841,000[43] | 1,286,975,468 (2004) | 1,339,724,852 (2010)[68] | 73[45] | 619,724,852 | |
| 98,274,961 (1965)[46] | 123,537,000[47] | 124,961,000[43] | 127,333,002 | 127,420,000 (2010)[69] | 82[45] | 28,123,865 | |
| 511,115,000[46] | 843,931,000[47] | 918,570,000[43] | 1,028,610,328 (2001) | 1,210,193,422 (2011)[70] | 69[45] | 699,078,422 | |
| 1,956,000 (1967)[46] | 3,003,000 (1990) [47] | 2,930,000 (1994)[43] | 4,452,732 (2002) | 5,076,700 (2010)[71] | 82 (2008)[45] | 3,120,700 | |
| 24,000 (1967)[46] | 29,000 (1990) [47] | N/A (1994)[43] | 31,842 (2000) | 35,586[72] (2010) | (2008)[45] | 11,586 | |
| 8,716,000 (1967)[46] | 10,123,000 (1990) [47] | 10,426,000 (1994)[43] | 10,964,020 (2001)[73] | 11,305,118 (2011)[74] | N/A (2008)[45] | 2,589,118 | |
(Danish dependency) |
38,000 (1967)[46] | N/A (1990) [47] | N/A (1994)[43] | 46,345 (2000) | 48,917 (2010) [75] | N/A (2008)[45] | 18,917 |
| 20,000 (1967)[46] | 29,000 (1990) [47] | N/A (1994)[43] | 33,307 (2000) | 35,789 (2009)[76] | (2008)[45] | 15,789 | |
| 29,207,856 (1966)[46] | 42,793,000 (1990) [47] | 44,453,000 (1994)[43] | 48,324,000 (2003) | 48,875,000 (2010) [77] | (2008)[45] | 19,667,144 | |
| 12,700,000 (1967)[46] | 21,773,000 (1990) [47] | 23,483,000 (1994)[43] | 22,224,195 (2002) | 24,051,218 (2010)[78] | (2008)[45] | 11,351,218 | |
| 107,200 (1967)[46] | 266,000 (1990) [47] | 280,000 (1994)[43] | 332,844 (2001) | 401,890 (2011)[79] | 76 (2008)[45] | 306,609 | |
| 10,671,000 (1967)[46] | 17,861,000 (1990) [47] | 19,489,000 (1994)[43] | 21,793,293 (2002) | 27,565,821 (2010)[80] | (2008)[45] | 16,894,821 | |
| 32,680,000 (1967)[46] | 57,196,000 (1990) [47] | 59,396,000 (1994)[43] | 60,606,947 (2000)[81] | 63,878,267 (2011)[82] | (2008)[45] | 31,198,267 | |
| 2,520,000 (1967)[46] | 2,701,000 (1990) [47] | 2,915,000 (1994)[43] | 3,727,703[83] (2003) | 4,224,000[44] (2009) | - (2008)[45] | ||
| 5,600,000 (1967)[46] | 12,116,000 (1990) [47] | 13,844,000 (1994)[43] | 17,585,540 (2003) | 22,457,763 (2011)[84] | -(2008)[45] | ||
| 182,00 (1967)[46] | 503,000 (1990) [47] | 549,000 (1994)[43] | 667,238 (2003) | 1,234,596[85] (2010) | 75 (2008)[45] | ||
| 11,741,000 (1967)[46] | 16,993,000 (1990) [47] | 17,685,000 (1994)[43] | 19,607,519 (2002) | 20,238,000[52] (2009) | - (2008)[45] | ||
| 6,050,000 (1967)[46] | 6.712,000 (1990) [47] | 6,994,000 (1994)[43] | 7,261,200 (2002) | 7,866,500[86] (2010) | - (2008)[45] | ||
| 335,000 (1967)[46] | 381,000 (1990) [47] | 401,000 (1994)[43] | 439,539 (2001) | 511,840 (2011)[87] | - (2008)[45] | ||
| 19,105,056 (1966)[46] | 23,200,000 (1990)[47] | 22,736,000 (1994)[43] | 21,680,974 (2002) | 21,466,174[88] (2011) | - (2008)[45] | ||
(associated state of New Zealand) |
1,900 (1966)[46] | N/A (1990)[47] | N/A (1994)[43] | 2,134 (2002) | 1,398 (2009)[89] | N/A (2008)[45] | -502 |
(New Zealand territory) |
5,194 (1966)[46] | N/A (1990)[47] | N/A (1994)[43] | 1,445 (2001) | 1,416 (2009) | N/A (2008)[45] | -3,778 |
| 1,876,000 (1967)[46] | 2,420,000 (1990) [47] | 2,429,000 (1994)[43] | 2,695,867 (2003) | 2,847,232[60] (2010) | 74 (2008)[45] | 971,232 | |
| 32,031,000 (1967)[46] | 32,322,000 (1990)[47] | 34,180,000 (1994)[43] | 37,812,817 (2002) | 40,091,359 (2010) | 74 (2008)[45] | 8,060,359 | |
| 49,890,660 (1967)[46] | 56,440,000 (1990)[47] | 57,747,000 (1994)[43] | 59,551,000 (2001) | 63,136,180 (2011)[90] | 81 (2008)[45] | ||
| 52,334,000 (1967)[46] | 57,662,000 (1990)[47] | 57,193,000 (1994)[43] | 56,995,744 (2002) | 60,605,053[91] (2011) | 80 (2008)[45] | ||
| 774,000 (1967)[46] | 1,075,000 (1990)[47] | 1,104,000 (1994)[43] | 1,179,137 (2000) | 1,288,000 (2009)[52] | 75 (2008)[45] | 514,000 | |
| 4,717,000 (1967)[46] | 9,197,000 (1990)[47] | 10,322,000 (1994)[43] | 12,974,361 (2000) | 13,276,517 (2009) | 70 (2008)[45] | 8,559,517 | |
| 8,033,000 (1967)[46] | 10,609,000 (1990)[47] | 10,960,000 (1994)[43] | 11,177,743 (2002) | 11,239,363 (2009)[92] | 77 (2008)[45] | ||
| 246,000 (1967)[46] | 255,000 (1990) [47] | 261,000 (1994)[43] | 250,012 (2001) | 284,589 (2010)[42] | 73 (2008)[45] | 18,589 | |
| 131,377 (1967)[46] | 164,000 (1990) [47] | 164,000 (1994)[43] | 178,173 (2003) | 179,000 (2009)[44] | N/A (2008)[45] | ||
| 7,765,981 (1967)[46] | 8,559,000 (1990) [47] | 8,794,000 (1994)[43] | 8,920,705 (2002) | 9,354,462 (2009) | 81 (2008)[45] | ||
| 4,664,000 (1967)[46] | 4,986,000 (1990) [47] | 5,095,000 (1994)[43] | 5,175,783 (2002) | 5,374,781 (2010) | N/A (2008)[45] | ||
| 9,440,000 (1967)[46] | 10,525,000 (1990)[47] | 9,830,000 (1994)[43] | 10,355,824 (2001) | 10,647,763[93] (2011) | N/A (2008)[45] | ||
| 7,323,981 (1967)[46] | 7,712,000 (1990) [47] | 8,031,000 (1994)[43] | 8,032,926 (2001) | 8,404,252 (2011) | N/A (2008)[45] | ||
| 1,738,000 (1967)[46] | 4,545,000 (1990)[47] | 5,225,000(1994)[43] | 5,499,074 (2002) | 6,420,000 (2009)[44] | 77 (2008)[45] | ||
| 12,385,000 (1967)[46] | 21,550,000 (1990)[47] | 23,080,000(1994)[43] | 27,949,639 (2002) | 29,496,000 (2010) | 70 (2008)[45] | ||
| 528,000 (1967)[46] | 965,000 (1990) [47] | 1,050,000 (1994)[43] | 1,345,479 (2002) | 1,647,000[44] (2009) | 48 (2008)[45] | ||
| 5,203,066 (1967)[46] | 10,020,000 (1990)[47] | 10,674,000 (1994)[43] | 10,766,500 (2003) | 18,498,000[52][94] (2009) | 38 (2008)[45] | ||
| 277,000 (1967)[46] | 348,000 (1990)[47] | 389,000 (1994)[43] | 474,214 (2000) | 676,000 (2009)[52] | 61 (2008)[45] | ||
| 2,505,000 (1967)[46] | 4,736,000 (1990)[47] | 5,246,000 (1994)[43] | 8,500,500 (2002) | 8,791,832 (2009) | 59 (2008)[45] | ||
| 2,770,000 (1967)[46] | 4,139,000 (1990)[47] | 4,742,000 (1994)[43] | 5,635,967 (2002) | 6,800,000[95] (2011) | 56 (2008)[45] | ||
| 10,500,000 (1967)[46] | 18,961,000 (1990)[47] | 21,360,000 (1994)[43] | 25,284,463 (2002) | 29,331,000[52] (2009) | - (2008)[45] | ||
| 25,781,090 (1966)[46] | 54,608,000 (1990)[47] | 59,778,000 (1994)[43] | 66,622,704 (2002) | 75,330,000 (2010)[96] | 71 (2008)[45] | 49,548,910 | |
| 20,014,880 (1966)[46] | 26,603,000 (1990)[47] | 29,248,000(1994)[43] | 31,081,900 (2001) | 32,623,490 (2011)[97] | 81 (2008)[45] | ||
| 199,118,000 (1967)[46] | 249,995,000 (1990)[47] | 260,650,00(1994)[43] | 281,421,906 (2000) | 308,745,538 (2010)[98] | 78 (2008)[45] | ||
| 7,931,000 (1967)[46] | 18,795,000 (1990)[47] | 20,621,000 (1994)[43] | 24,227,297 (2002) | 32,369,558 (2009) | 52 (2008)[45] |
- Notes
- * Eritrea left Ethiopia in 1991.
- † Split into the nations of Sudan and South Sudan during 2011.
- ‡ Japan and the Ryukyu Islands merged in 1972.
- # India and Sikkim merged in 1975.
| Population growth 1990–2012 (%)[99] | |
|---|---|
| Africa | 73.3% |
| Middle East | 68.2% |
| Asia (excl. China) | 42.8% |
| China | 19.0% |
| OECD Americas | 27.9% |
| Non-OECD Americas | 36.6% |
| OECD Europe | 11.5% |
| OECD Asia Oceania | 11.1% |
| Non-OECD Europe and Eurasia | -0.8% |

Future population
Population projections are attempts to show how the human population statistics might change in the future.[100] These projections are an important input to forecasts of the population's impact on this planet and humanity's future well-being.[101] Models of population growth take trends in human development and apply projections into the future.[102] These models use trend-based-assumptions about how populations will respond to economic, social and technological forces to understand how they will affect fertility and mortality, and thus population growth.[102]
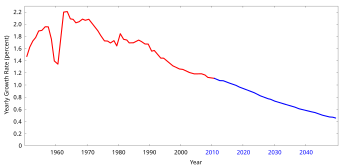
The 2022 projections from the United Nations Population Division (chart #1) show that annual world population growth peaked at 2.3% per year in 1963, has since dropped to 0.9% in 2023, equivalent to about 74 million people each year, and projected that it could drop even further to minus 0.1% by 2100.[103] Based on this, the UN projected that the world population, 8 billion as of 2023[update], would peak around the year 2086 at about 10.4 billion, and then start a slow decline, assuming a continuing decrease in the global average fertility rate from 2.5 births per woman during the 2015–2020 period to 1.8 by the year 2100, (the medium-variant projection).[104][105]
However, estimates outside of the United Nations have put forward alternative models based on additional downward pressure on fertility (such as successful implementation of education and family planning goals in the UN's Sustainable Development Goals) which could result in peak population during the 2060–2070 period rather than later.[102][106]
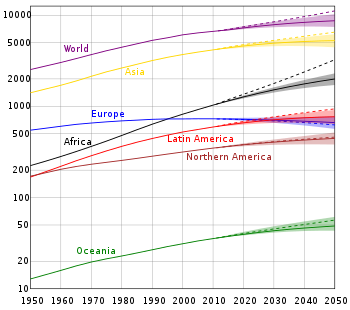
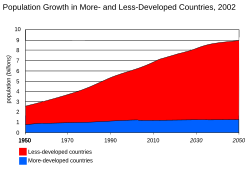
According to the UN, of the predicted growth in world population between 2020 and 2050, all of that change will come from less developed countries, and more than half will come from sub-Saharan Africa.[107] Half of the growth will come from just eight countries, five of which are in Africa.[104][105] The UN predicts that the population of sub-Saharan Africa will double by 2050.[107] The Pew Research Center observes that 50% of births in the year 2100 will be in Africa.[108] Other organizations project lower levels of population growth in Africa, based particularly on improvement in women's education and successful implementation of family planning.[109]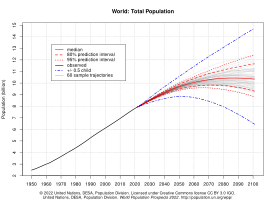
Even though the global fertility rate continues to fall, chart #2 shows that because of population momentum the global population will continue to grow, although at a steadily slower rate, until the mid 2080s (the median line).
The main driver of long-term future population growth on this planet is projected to be the continuing evolution of fertility and mortality.[102]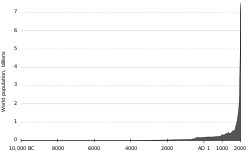
See also
- List of countries by population growth rate
- Demographic history
- Demographic transition
- Density dependence
- Ecological overshoot
- Epidemiological transition
- Human population planning
- Irruptive growth
- Overshoot (population)
- Population decline
- Population density
- World population
- Estimates of historical world population
- Zero population growth
References
- ^ "Absolute increase in global population per year". Our World in Data. Archived from the original on 28 February 2021. Retrieved 15 February 2020.
- ^ "World Population Prospects 2017 – Data Booklet (ST/ESA/SER.A/401)" (PDF). United Nations Department of Economic and Social Affairs. 2017. p. 3. Archived (PDF) from the original on 7 March 2022. Retrieved 13 April 2022.
- ^ "World Population 2017". Retrieved 1 April 2020.
- ^ "World Population Prospects: The 2017 Revision: Key Findings and Advance Tables" (PDF). United Nations Department of Economic and Social Affairs, Population Division. p. 2. Archived (PDF) from the original on 26 June 2019. Retrieved 5 January 2019.
- ^ Roser, Max (9 May 2013). "Future Population Growth". Our World in Data.
- ^ O'Sullivan, Jane Nancy (2023). "Demographic Delusions: World Population Growth Is Exceeding Most Projections and Jeopardising Scenarios for Sustainable Futures". World. 4 (3): 545–568. doi:10.3390/world4030034.
- ^ a b "Black death 'discriminated' between victims". Australian Broadcasting Corporation. 29 January 2008. Archived from the original on 20 December 2016. Retrieved 3 November 2008.
- ^ Hopfenberg, Russell. "An expansion of the demographic transition model: the dynamic link between agricultural productivity and population." Biodiversity 15.4 (2014): 246–254.
- ^ Population Reference Bureau. "2013 World Population Factsheet" (PDF). Population Reference Bureau. Archived from the original (PDF) on 18 February 2018. Retrieved 5 December 2014.
- ^ a b c Roser, Max; Ritchie, Hannah; Ortiz-Ospina, Esteban (9 May 2013). "World Population Growth". Our World in Data.
- ^ a b Vollset, Stein Emil; Goren, Emily; Yuan, Chun-Wei; Cao, Jackie; Smith, Amanda E.; Hsiao, Thomas; Bisignano, Catherine; Azhar, Gulrez S.; Castro, Emma; Chalek, Julian; Dolgert, Andrew J.; Frank, Tahvi; Fukutaki, Kai; Hay, Simon I.; Lozano, Rafael; Mokdad, Ali H.; Nandakumar, Vishnu; Pierce, Maxwell; Pletcher, Martin; Robalik, Toshana; Steuben, Krista M.; Wunrow, Han Yong; Zlavog, Bianca S.; Murray, Christopher J L. (14 July 2020). "Fertility, mortality, migration, and population scenarios for 195 countries and territories from 2017 to 2100: a forecasting analysis for the Global Burden of Disease Study". Lancet (pdf). 396 (10258): 1285–1306. doi:10.1016/S0140-6736(20)30677-2. PMC 7561721. PMID 32679112.
- ^ Stokstad, Erik (5 May 2019). "Landmark analysis documents the alarming global decline of nature". Science. AAAS. Retrieved 20 October 2022.
Driving these threats are the growing human population, which has doubled since 1970 to 7.6 billion, and consumption. (Per capita of use of materials is up 15% over the past 5 decades.)
- ^ Crist, Eileen; Ripple, William J.; Ehrlich, Paul R.; Rees, William E.; Wolf, Christopher (2022). "Scientists' warning on population" (PDF). Science of the Total Environment. 845: 157166. Bibcode:2022ScTEn.845o7166C. doi:10.1016/j.scitotenv.2022.157166. PMID 35803428. S2CID 250387801.
- ^ United Nations Environment Programme (2021). Making Peace with Nature: A scientific blueprint to tackle the climate, biodiversity and pollution emergencies. Nairobi. https://www.unep.org/resources/making-peace-nature
- ^ "United Nations - World Population Prospects 2017". Archived from the original on 22 March 2018. Retrieved 7 July 2017.
- ^ Greenwood, B. (19 June 2014). "The contribution of vaccination to global health: past, present and future". Philosophical Transactions of the Royal Society of London. Series B, Biological Sciences. 369 (1645). Philosophical Transactions of the Royal Society: 20130433. doi:10.1098/rstb.2013.0433. PMC 4024226. PMID 24821919.
- ^ Armelagos, George J., Alan H. Goodman, and Kenneth H. Jacobs. "The origins of agriculture: Population growth during a period of declining health." Population and Environment 13.1 (1991): 9-22.
- ^ Taiz, Lincoln. "Agriculture, plant physiology, and human population growth: past, present, and future." Theoretical and Experimental Plant Physiology 25 (2013): 167-181.
- ^ Smil, Vaclav (1999). "Detonator of the population explosion" (PDF). Nature. 400 (6743): 415. Bibcode:1999Natur.400..415S. doi:10.1038/22672. S2CID 4301828.
- ^ McKeown, Thomas (1976). The Modern Rise of Population. London, UK: Edward Arnold. ISBN 9780713159868.
- ^ a b McKeown T, Brown RG (1955). "Medical evidence related to English population changes in the eighteenth century". Population Studies. 9 (2): 119–141. doi:10.1080/00324728.1955.10404688. JSTOR 2172162.
- ^ McKeown T, Brown RG, Record RG (1972). "An interpretation of the modern rise of population in Europe". Population Studies. 26 (3): 345–382. doi:10.1080/00324728.1972.10405908. JSTOR 2173815. PMID 11630563.
- ^ McKeown T, Record RG (1962). "Reasons for the Decline of Mortality in England and Wales during the Nineteenth Century". Population Studies. 16 (2): 94–122. doi:10.2307/2173119. JSTOR 2173119.
- ^ McKeown T, Record RG, Turner RD (1975). "An Interpretation of the Decline of Mortality in England and Wales during the Twentieth Century". Population Studies. 29 (3): 391–422. doi:10.1080/00324728.1975.10412707. JSTOR 2173935. PMID 11630508.
- ^ Korotayev, A. V.; Malkov, A. S. (2016). "Compact Mathematical Model of the World System Economic and Demographic Growth, 1 CE–1973 CE". International Journal of Mathematical Models and Methods in Applied Sciences. 10: 200–209.
- ^ Deaton, Angus (2013). The Great Escape. Health, wealth, and the origins of inequality. Princeton and Oxford: Princeton University Press. pp. 91–93. ISBN 978-0-691-15354-4.
McKeown's views, updated to modern circumstances, are still important today in debates between those who think that health is primarily determined by medical discoveries and medical treatment and those who look to the background social conditions of life.
- ^ Association of Public Health Epidemiologists in Ontario Archived 22 May 2008 at the Wayback Machine
- ^ a b Reece, Jane; Urry, Lisa; Cain, Michael; Wasserman, Steven; Minorsky, Peter; Jackson, Robert (2014). Campbell Biology. Pearson.
- ^ Stewart, James; Clegg, Daniel (2012). Brief Applied Calculus. Brooks/Cole Cengage Learning.
- ^ a b "World Population Prospects 2017". Archived from the original on 11 July 2017.
- ^ "The World Factbook". 20 November 2015. Retrieved 4 January 2016.
- ^ "BBC NEWS - South Asia - The end of India's green revolution?". 29 May 2006.
- ^ "International Programs". Archived from the original on 1 July 2009.
- ^ "UN population projections". Archived from the original on 14 September 2010. Retrieved 23 May 2009.
- ^ "Japan sees biggest population fall". the Guardian. Associated Press. 2 January 2009.
- ^ Carrington, Damien (18 September 2014). "World population to hit 11bn in 2100 – with 70% chance of continuous rise". The Guardian. Retrieved 19 December 2016.
- ^ Gerland, P.; Raftery, A. E.; Ev Ikova, H.; Li, N.; Gu, D.; Spoorenberg, T.; Alkema, L.; Fosdick, B. K.; Chunn, J.; Lalic, N.; Bay, G.; Buettner, T.; Heilig, G. K.; Wilmoth, J. (14 September 2014). "World population stabilization unlikely this century". Science. 346 (6206): 234–7. Bibcode:2014Sci...346..234G. doi:10.1126/science.1257469. ISSN 1095-9203. PMC 4230924. PMID 25301627.
- ^ Hook, Chris (20 December 2019). "Earth's population set to soar to 7.75 billion people by New year's Eve". Seven News. Retrieved 2 January 2020.
- ^ Silk, John (21 December 2019). "World's population to hit 7.75 billion in 2019". Deutsche Welle. Retrieved 14 March 2021.
- ^ a b "World Population Prospects - Population Division - United Nations". Archived from the original on 7 May 2011. Retrieved 28 May 2012.
- ^ "East Asia/Southeast Asia :: China — The World Factbook - Central Intelligence Agency". www.cia.gov. Retrieved 15 May 2019.
- ^ a b c d e Barbados: People. World Factbook of CIA
- ^ a b c d e f g h i j k l m n o p q r s t u v w x y z aa ab ac ad ae af ag ah ai aj ak al am an ao ap aq ar as at au av aw ax ay az ba bb bc bd be bf bg bh bi bj bk bl bm bn bo bp bq br bs bt bu bv bw bx The British Collins Longman Student Atlas, the 1996 and in 1998 publications, ISBN 978-0-00-448879-0 for the 1998 edition, ISBN 0-00-448365-0 for the 1996 edition
- ^ a b c d e f g h i "World Population Prospects: The 2008 Revision: Selected Tables: Annex Tables" (PDF). United Nations. 2009. Table A.1. Total Population by Sex in 2009 and Sex Ratio by Country in 2009. Retrieved 12 March 2009. NB: The preliminary results of the National population census in Guinea-Bissau put the figure at 1,449,230, according to email information by the Instituto Nacional de Estudos e Pesquisa, Bissau.
- ^ a b c d e f g h i j k l m n o p q r s t u v w x y z aa ab ac ad ae af ag ah ai aj ak al am an ao ap aq ar as at au av aw ax ay az ba bb bc bd be bf bg bh bi bj bk bl bm bn bo bp bq br bs bt bu bv bw bx 'Modern School Atlas (96th edition)', ISBN 978-1-84907-013-3.
- ^ a b c d e f g h i j k l m n o p q r s t u v w x y z aa ab ac ad ae af ag ah ai aj ak al am an ao ap aq ar as at au av aw ax ay az ba bb bc bd be bf bg bh bi bj bk bl bm bn bo bp bq br bs bt bu bv bw The British Oxford economic atlas of the World 4th edition, ISBN 0-19-894107-2
- ^ a b c d e f g h i j k l m n o p q r s t u v w x y z aa ab ac ad ae af ag ah ai aj ak al am an ao ap aq ar as at au av aw ax ay az ba bb bc bd be bf bg bh bi bj bk bl bm bn bo bp bq br bs bt bu bv bw The British Collins Atlas of the World, the 1993 edition, ISBN 0-00-448038-4
- ^ a b c d Ethiopia Central Statistics Office -- Population Projection for mid-2008 Archived 5 January 2012 at the Wayback Machine
- ^ Central Intelligence Agency (2009). "Niger". The World Factbook. Retrieved 10 January 2010.
- ^ "Mali preliminary 2009 census". Institut National de la Statistique. Archived from the original on 18 April 2010. Retrieved 12 January 2010.
- ^ Central Intelligence Agency (2009). "Senegal". The World Factbook. Retrieved 10 January 2010.
- ^ a b c d e f g "World Population Prospects, Table A.1" (PDF). United Nations. 2010. Retrieved 12 March 2009.[dead link]
- ^ The World Factbook- Congo, Democratic Republic of the. Central Intelligence Agency.
- ^ "Central Agency for Population Mobilisation and Statistics — Population Clock (July 2008)". Msrintranet.capmas.gov.eg. Archived from the original on 8 September 2010. Retrieved 25 August 2010.
- ^ "Falkland Islands (Islas Malvinas)". The World Factbook. CIA. Retrieved 5 March 2010.
- ^ "Departamento Administrativo Nacional de Estadística". Dane.gov.co. Archived from the original on 5 September 2015. Retrieved 22 August 2010.
- ^ IBGE. Censo 2010: população do Brasil é de 190.732.694 pessoas.
- ^ "INEGI 2010 Census Statistics". inegi.org.mx. Retrieved 25 November 2010.
- ^ Central Intelligence Agency (2011). "Nauru". The World Factbook. Retrieved 12 February 2011.
- ^ a b "The World Factbook". 19 October 2021.
- ^ "Population clock". Australian Bureau of Statistics website. Commonwealth of Australia. Retrieved 12 April 2011. The population estimate shown is automatically calculated daily at 00:00 UTC and is based on data obtained from the population clock on the date shown in the citation.
- ^ "IFs Forecast - Version 7.00-Google Public Data Explorer".
- ^ "Wzrasta liczba ludności Polski - Wiadomości - WP.PL". Wiadomosci.wp.pl. 23 July 2010. Archived from the original on 5 October 2013. Retrieved 27 July 2010.
- ^ Hungarian Central Statistical Office. Retrieved 25 July 2010.
- ^ "Archived copy" (PDF). Archived from the original (PDF) on 5 September 2011. Retrieved 31 December 2011.
{{cite web}}: CS1 maint: archived copy as title (link) - ^ "Total population at 1 January". Eurostat. 11 March 2011. Retrieved 29 April 2011.
- ^ "CSO – Population and Migration Estimates April 2010" (PDF). September 2010. Archived from the original (PDF) on 20 September 2010. Retrieved 21 September 2010.
- ^ Communiqué of the National Bureau of Statistics of People's Republic of China on Major Figures of the 2010 Population Census Archived 8 November 2013 at the Wayback Machine
- ^ "Statistics Bureau Home Page/Population Estimates Monthly Report".
- ^ "Provisional Population Totals - Census 2011". Indian Census Bureau 2011. Retrieved 29 March 2011.
- ^ "Population (Mid Year Estimates) & Land Area". Statistics Singapore. 31 August 2010. Archived from the original on 14 September 2010.
- ^ Monaco, The World Factbook, Central Intelligence Agency. Retrieved 7 June 2010.
- ^ "Πίνακας 1. Πληθυσμός κατά φύλο και ηλικία" (PDF). National Statistical Service of Greece: Population census of 18 March 2001. Archived from the original (PDF) on 25 March 2009.
- ^ "Total population". Eurostat. 1 January 2010. Retrieved 8 January 2010.
- ^ "Hagstova F?roya". Archived from the original on 10 December 2013. Retrieved 10 December 2015. (Faroese)
- ^ Bevölkerungsstatistik 30. Juni 2009 Archived 14 November 2013 at the Wayback Machine, Landesverwaltung Liechtenstein.
- ^ "총인구, 인구성장률 : 지표상세화면". Index.go.kr. Retrieved 29 October 2010.
- ^ 한반도 인구 7천400만명 시대 임박. Joins (in Korean). 1 October 2009. Archived from the original on 17 April 2010. Retrieved 14 April 2010.
- ^ "Brunei". CIA World Factbook. 2011. Retrieved 13 January 2011.
- ^ "Laporan Kiraan Permulaan 2010". Jabatan Perangkaan Malaysia. p. iii. Archived from the original on 8 July 2011. Retrieved 31 January 2011.
- ^ "Population and Housing Census 2000, National Statistical Office". Web.nso.go.th. 1 April 2000. Archived from the original on 14 November 2017. Retrieved 25 April 2010.
- ^ "Archived copy" (PDF). Archived from the original (PDF) on 16 July 2011. Retrieved 16 July 2011.
{{cite web}}: CS1 maint: archived copy as title (link) - ^ "Central Intelligence Agency. March 2011 est". Cia.gov. Retrieved 23 April 2011.
- ^ "Central Intelligence Agency. March 2011 est". Cia.gov. Retrieved 23 April 2011.
- ^ "REMARKABLE GROWTH EXPATS OUTNUMBER BAHRAINIS IN 2010 CENSUS". Bahraini Census 2010. 28 November 2010. Archived from the original on 19 February 2011. Retrieved 14 February 2011.
- ^ "Population size and population composition". Swiss Federal Statistical Office. Swiss Federal Statistical Office, Neuchâtel. 2010. Archived from the original on 28 June 2016. Retrieved 29 April 2011.
- ^ "Population: 511 840 habitants au 1er janvier 2011", Le Portail des statistiques: Grand-Duché de Luxembourg, 3 May 2011. (in French) Retrieved 4 May 2011.
- ^ "Romania - Population". epp.eurostat.ec.europa.eu. Retrieved 26 May 2011.
- ^ "Niue". The World Factbook. Central Intelligence Agency. Retrieved 20 July 2009.
- ^ "Population totale par sexe et âge au 1er janvier 2011, France métropolitaine". INSEE (in French). Government of France. Retrieved 20 January 2011.
- ^ "Monthly demographic balance: January–November 2010" (PDF) (in Italian). Istat. 28 March 2011. Archived from the original (PDF) on 22 July 2012. Retrieved 2 April 2011.
- ^ Anuario Estadístico de Cuba 2009. Edición 2010 Archived 16 July 2010 at the Wayback Machine, Oficina Nacional de Estadísticas, República de Cuba. Accessed on 6 November, 2010. Note: An exchange rate of 1 CUC to 1.08 USD was used to convert GDP.[1]
- ^ Pordata, "Base de Dados Portugal Contemporâneo". Accessed on 7 March 2011.
- ^ "Population Forecast to 2060 by International Futures hosted by Google Public Data Explorer". Retrieved 13 July 2011.
- ^ "Background notes - Laos". US Dept. of State. Retrieved 20 January 2011.
- ^ "Official Iranian Population clock". Amar.org.ir. Archived from the original on 22 July 2011. Retrieved 13 July 2011.
- ^ "Estimated population of Canada, 1605 to present". Statistics Canada. 6 July 2009. Retrieved 17 April 2011.
- ^ "Resident Population Data – 2010". U.S. Census Bureau. 2010. Archived from the original on 28 October 2011. Retrieved 22 December 2010.
- ^ CO2 Emissions from Fuel Combustion Archived 2 December 2015 at the Wayback Machine Population 1971–2014 IEA (PDF Page 74, marked page 72)
- ^ "Population Projections". United States Census Bureau.
- ^ Kaneda, Toshiko (June 2014). "Understanding Population Projections: Assumptions Behind the Numbers" (PDF). Population Reference Bureau.
- ^ a b c d Roser, Max (2013-05-09). "Future Population Growth". Our World in Data.
- ^ Roser, Max; Ritchie, Hannah (March 18, 2023). "Two centuries of rapid global population growth will come to an end". Our World in Data.
- ^ a b c "World Population Prospects 2022, Standard Projections, Compact File, Estimates tab, Total Population as of 1 January (thousands) column". United Nations Department of Economic and Social Affairs, Population Division. 2022.
- ^ a b c "World Population Prospects 2022, Standard Projections, Compact File, Variant tab, Total Population as of 1 January (thousands) column". United Nations Department of Economic and Social Affairs, Population Division. 2022.
- ^ Vollset, Stein Emil; Goren, Emily; Yuan, Chun-Wei; Cao, Jackie; Smith, Amanda E.; Hsiao, Thomas; Bisignano, Catherine; Azhar, Gulrez S.; Castro, Emma; Chalek, Julian; Dolgert, Andrew J. (2020-10-17). "Fertility, mortality, migration, and population scenarios for 195 countries and territories from 2017 to 2100: a forecasting analysis for the Global Burden of Disease Study". The Lancet. 396 (10258): 1285–1306. doi:10.1016/S0140-6736(20)30677-2. ISSN 0140-6736. PMC 7561721. PMID 32679112.
- ^ a b "Population". United Nations. Retrieved 1 May 2023.
- ^ Cilluffo, Anthony; Ruiz, Neil (June 17, 2019). "World's Population is Projected to Nearly Stop Growing by the end of the Century". Pew Research Center.
- ^ Kaneda, Toshiko; Falk, Marissa; Patierno, Kaitlyn (March 27, 2021). "Understanding and Comparing Population Projections in Sub-Saharan Africa". Population Reference Bureau.
- ^ "World Population Prospects 2022 , Graphs / Profiles". United Nations Department of Economic and Social Affairs, Population Division. 2022.
External links
- "World Population Prospects". Website of the United Nations Population Division. Archived from the original on 11 July 2017.
- "Food Production and Population Growth". Daniel Quinn, Alan D. Thornhill, PhD. Ecofuture. Population and Sustainability Media, Non-fiction.
- "Probabilistic Population Projections, 2nd Revision". Website of the United Nations Population Division. Archived from the original on 4 October 2013.
- "Population Growth and the Food Supply". Population Institute of Canada.
- "World population growth and trends 1950-2050". US Census. Archived from the original on 7 July 2010.
- "Feeding the Ten Billion-Plants and Population Growth". PGR Newsletter FAO-Bioversity L.T. Evans. 2000. Cambridge University Press. ISBN 0-521-64685-5. Published in Issue No. 125, page 39 to 40 - (5802) characters
| Authority control databases: National |
|---|