
Sandoval County | |
|---|---|
 Sandoval County Courthouse in Bernalillo | |
 Seal | |
 Location within the U.S. state of New Mexico | |
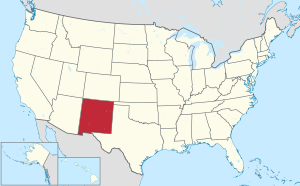 New Mexico's location within the U.S. | |
| Coordinates: 35°41′N 106°51′W / 35.69°N 106.85°W | |
| Country | |
| State | |
| Founded | 1903 |
| Named for | Sandoval family |
| Seat | Bernalillo |
| Largest city | Rio Rancho |
| Area | |
| • Total | 3,716 sq mi (9,620 km2) |
| • Land | 3,711 sq mi (9,610 km2) |
| • Water | 5.3 sq mi (14 km2) 0.1% |
| Population (2020) | |
| • Total | 148,834 |
| • Density | 35/sq mi (14/km2) |
| Time zone | UTC−7 (Mountain) |
| • Summer (DST) | UTC−6 (MDT) |
| Congressional districts | 1st, 3rd |
| Website | www |
Sandoval County (Spanish: Condado de Sandoval) is located in the U.S. state of New Mexico. As of the 2020 census, the population was 148,834, making it the fourth-most populous county in New Mexico. The county seat is Bernalillo.[1]
Sandoval County is part of the Albuquerque metropolitan area.
YouTube Encyclopedic
-
1/5Views:1 5029514793074 542
-
Sandoval County, New Mexico: Sacred Places, Cultural Melting Pot
-
Fenton Lake || Trout🎣 || Sandoval County, New Mexico || lakes in New Mexico #nmtrue #travelvlog
-
Travel Guide New Mexico tm, Sandoval County
-
Travel Guide New Mexico tm Sandoval County Corrales New Mexico
-
Travel Guide New Mexico tm Sandoval County Rio Rancho New Mexico
Transcription
History
Sandoval County was created in 1903 from the northern part of Bernalillo County. Its name comes from one of the large land-holding Spanish families in the area. The original county seat was Corrales, but it was moved to Bernalillo in 1905.[2]
Mormon Battalion Monument (New Mexico) is in the county.
Geography
According to the U.S. Census Bureau, the county has a total area of 3,716 square miles (9,620 km2), of which 3,711 square miles (9,610 km2) is land and 5.3 square miles (14 km2) (0.1%) is water.[3] The highest point in the county is the summit of Redondo Peak, at 11,254 feet (3,430 m).
A relatively small portion of the county exists as a geographically separate exclave between Los Alamos County and Santa Fe County. This came about when Los Alamos County was created; the land that became the exclave would have been part of Los Alamos but was excluded owing to its sacred status among the local Indians. Rather than be ceded to neighboring Santa Fe (or Los Alamos) it has remained part of Sandoval.
Adjacent counties
- Rio Arriba County - north
- Los Alamos County - northeast (west of the exclave)
- Santa Fe County - east (in two locations near Los Alamos County including the exclave)
- Bernalillo County - south
- Cibola County - southwest
- McKinley County - west
- San Juan County - northwest
Native American Reservations

Sandoval County has 12 Indian reservations and two joint-use areas lying within its borders. This is the second highest number of reservations of any county in the United States (after San Diego County, California, which has 18 reservations.) Riverside County, California also has 12 reservations, but no joint-use areas.
- Cochiti Pueblo (partly in Santa Fe County)
- Jemez Pueblo
- Jicarilla Apache Indian Reservation (partly in Rio Arriba County)
- Laguna Pueblo (partly in Bernalillo, Cibola and Valencia Counties)
- Navajo Nation (extending into six other counties in New Mexico, plus three in Arizona and one in Utah)
- San Felipe Pueblo
- San Felipe/Santa Ana joint use area
- San Felipe/Santo Domingo joint use area
- San Ildefonso Pueblo (partly in Santa Fe County)
- Sandia Pueblo (partly in Bernalillo County)
- Santa Ana Pueblo
- Santa Clara Pueblo (partly in Rio Arriba and Santa Fe counties)
- Santo Domingo Pueblo (partly in Santa Fe County)
- Zia Pueblo
National protected areas
- Bandelier National Monument (part)
- Cibola National Forest (part)
- El Camino Real de Tierra Adentro National Historic Trail (part)
- Kasha-Katuwe Tent Rocks National Monument
- Santa Fe National Forest (part)
- Valles Caldera National Preserve (part)
Demographics
| Census | Pop. | Note | %± |
|---|---|---|---|
| 1910 | 8,579 | — | |
| 1920 | 8,863 | 3.3% | |
| 1930 | 11,144 | 25.7% | |
| 1940 | 13,898 | 24.7% | |
| 1950 | 12,438 | −10.5% | |
| 1960 | 14,201 | 14.2% | |
| 1970 | 17,492 | 23.2% | |
| 1980 | 34,799 | 98.9% | |
| 1990 | 63,319 | 82.0% | |
| 2000 | 89,908 | 42.0% | |
| 2010 | 131,561 | 46.3% | |
| 2020 | 148,834 | 13.1% | |
| U.S. Decennial Census[4] 1790–1960[5] 1900–1990[6] 1990–2000[7] 2010–2016[8] | |||
2000 census
As of the 2000 census,[10] there were 89,908 people, 31,411 households, and 23,621 families living in the county. The population density was 24 people per square mile (9.3 people/km2). There were 34,866 housing units at an average density of 9 per square mile (3.5/km2). The racial makeup of the county was 65.08% White, 16.28% Native American, 1.71% Black or African American, 0.99% Asian, 0.11% Pacific Islander, 12.37% from other races, and 3.47% from two or more races. 29.40% of the population were Hispanic or Latino of any race.
There were 31,411 households, out of which 38.60% had children under the age of 18 living with them, 57.70% were married couples living together, 12.20% had a female householder with no husband present, and 24.80% were non-families. 19.90% of all households were made up of individuals, and 6.90% had someone living alone who was 65 years of age or older. The average household size was 2.84 and the average family size was 3.29.
In the county, the population was spread out, with 29.60% under the age of 18, 7.50% from 18 to 24, 30.10% from 25 to 44, 22.20% from 45 to 64, and 10.60% who were 65 years of age or older. The median age was 35 years. For every 100 females there were 95.20 males. For every 100 females age 18 and over, there were 91.70 males.
The median income for a household in the county was $44,949, and the median income for a family was $48,984. Males had a median income of $36,791 versus $26,565 for females. The per capita income for the county was $19,174. About 9.00% of families and 12.10% of the population were below the poverty line, including 15.60% of those under age 18 and 9.20% of those age 65 or over.
2010 census
As of the 2010 census, there were 131,561 people, 47,602 households, and 34,548 families living in the county.[11] The population density was 35.5 inhabitants per square mile (13.7/km2). There were 52,287 housing units at an average density of 14.1 per square mile (5.4/km2).[12] The racial makeup of the county was 68.0% white, 12.9% American Indian, 2.1% black or African American, 1.5% Asian, 0.1% Pacific islander, 11.5% from other races, and 3.9% from two or more races. Those of Hispanic or Latino origin made up 35.1% of the population.[11] In terms of ancestry, 13.2% were German, 9.3% were Irish, 8.7% were English, and 3.3% were American.[13]
Of the 47,602 households, 37.6% had children under the age of 18 living with them, 53.9% were married couples living together, 12.5% had a female householder with no husband present, 27.4% were non-families, and 22.0% of all households were made up of individuals. The average household size was 2.75 and the average family size was 3.22. The median age was 37.9 years.[11]
The median income for a household in the county was $57,158 and the median income for a family was $65,906. Males had a median income of $48,967 versus $35,101 for females. The per capita income for the county was $25,979. About 8.3% of families and 11.4% of the population were below the poverty line, including 14.0% of those under age 18 and 10.8% of those age 65 or over.[14]
Communities
City
Town
- Bernalillo (county seat)
- Edgewood (part)
Villages
Census-designated places
Unincorporated community
Politics
Since New Mexico obtained statehood in 1912, Sandoval county has been remarkably accurate in predicting the winner of each presidential race. The only elections where Sandoval County failed to back the overall winner were in 1912 (Theodore Roosevelt won the state on the Bull Moose ticket), 1944, 1968, and 2016. Hillary Clinton won a plurality, but not majority, of votes in Sandoval county in 2016 due to Gary Johnson (who previously served as Governor of New Mexico) winning an abnormally high number of votes that election.
| Year | Republican | Democratic | Third party | |||
|---|---|---|---|---|---|---|
| No. | % | No. | % | No. | % | |
| 2020 | 34,174 | 44.64% | 40,588 | 53.01% | 1,800 | 2.35% |
| 2016 | 25,905 | 41.99% | 27,707 | 44.91% | 8,078 | 13.09% |
| 2012 | 24,387 | 45.10% | 27,236 | 50.36% | 2,455 | 4.54% |
| 2008 | 25,193 | 42.97% | 32,669 | 55.72% | 768 | 1.31% |
| 2004 | 22,628 | 50.80% | 21,421 | 48.09% | 492 | 1.10% |
| 2000 | 15,423 | 48.57% | 14,899 | 46.92% | 1,433 | 4.51% |
| 1996 | 11,015 | 41.65% | 13,081 | 49.46% | 2,352 | 8.89% |
| 1992 | 8,491 | 36.02% | 10,951 | 46.45% | 4,132 | 17.53% |
| 1988 | 9,411 | 49.50% | 9,332 | 49.09% | 268 | 1.41% |
| 1984 | 9,005 | 55.43% | 7,080 | 43.58% | 161 | 0.99% |
| 1980 | 6,762 | 53.74% | 4,740 | 37.67% | 1,080 | 8.58% |
| 1976 | 4,110 | 44.34% | 5,072 | 54.72% | 87 | 0.94% |
| 1972 | 3,507 | 50.25% | 3,293 | 47.18% | 179 | 2.56% |
| 1968 | 1,959 | 41.43% | 2,609 | 55.18% | 160 | 3.38% |
| 1964 | 1,077 | 24.37% | 3,332 | 75.38% | 11 | 0.25% |
| 1960 | 1,447 | 35.13% | 2,672 | 64.87% | 0 | 0.00% |
| 1956 | 1,979 | 55.68% | 1,574 | 44.29% | 1 | 0.03% |
| 1952 | 1,795 | 52.06% | 1,647 | 47.77% | 6 | 0.17% |
| 1948 | 1,675 | 47.33% | 1,851 | 52.30% | 13 | 0.37% |
| 1944 | 1,439 | 51.48% | 1,354 | 48.44% | 2 | 0.07% |
| 1940 | 1,990 | 49.12% | 2,060 | 50.85% | 1 | 0.02% |
| 1936 | 1,800 | 46.18% | 2,094 | 53.72% | 4 | 0.10% |
| 1932 | 1,562 | 46.24% | 1,808 | 53.52% | 8 | 0.24% |
| 1928 | 1,700 | 59.44% | 1,159 | 40.52% | 1 | 0.03% |
| 1924 | 1,587 | 58.52% | 1,096 | 40.41% | 29 | 1.07% |
| 1920 | 1,194 | 57.46% | 884 | 42.54% | 0 | 0.00% |
| 1916 | 611 | 45.43% | 734 | 54.57% | 0 | 0.00% |
| 1912 | 211 | 22.93% | 126 | 13.70% | 583 | 63.37% |
Education
School districts include:[16]
- Albuquerque Public Schools
- Bernalillo Public Schools
- Cuba Independent Schools
- Jemez Valley Public Schools
- Los Alamos Public Schools
- Rio Rancho Public Schools
Bureau of Indian Education (BIE) schools include:
See also
References
- ^ "Find a County". National Association of Counties. Retrieved June 7, 2011.
- ^ "Bernalillo is now the county seat". Santa Fe New Mexican. May 8, 1905. p. 8. Retrieved April 28, 2017 – via Library of Congress.
- ^ "2010 Census Gazetteer Files". United States Census Bureau. August 22, 2012. Archived from the original on January 1, 2015. Retrieved January 2, 2015.
- ^ "U.S. Decennial Census". United States Census Bureau. Retrieved January 2, 2015.
- ^ "Historical Census Browser". University of Virginia Library. Retrieved January 2, 2015.
- ^ "Population of Counties by Decennial Census: 1900 to 1990". United States Census Bureau. Retrieved January 2, 2015.
- ^ "Census 2000 PHC-T-4. Ranking Tables for Counties: 1990 and 2000" (PDF). United States Census Bureau. Archived (PDF) from the original on March 27, 2010. Retrieved January 2, 2015.
- ^ "State & County QuickFacts". United States Census Bureau. Retrieved September 30, 2013.
- ^ "Population and Housing Unit Estimates". Retrieved December 23, 2019.
- ^ "U.S. Census website". United States Census Bureau. Retrieved January 31, 2008.
- ^ a b c "DP-1 Profile of General Population and Housing Characteristics: 2010 Demographic Profile Data". United States Census Bureau. Archived from the original on February 13, 2020. Retrieved January 24, 2016.
- ^ "Population, Housing Units, Area, and Density: 2010 - County". United States Census Bureau. Archived from the original on February 13, 2020. Retrieved January 24, 2016.
- ^ "DP02 SELECTED SOCIAL CHARACTERISTICS IN THE UNITED STATES – 2006-2010 American Community Survey 5-Year Estimates". United States Census Bureau. Archived from the original on February 13, 2020. Retrieved January 24, 2016.
- ^ "DP03 SELECTED ECONOMIC CHARACTERISTICS – 2006-2010 American Community Survey 5-Year Estimates". United States Census Bureau. Archived from the original on February 13, 2020. Retrieved January 24, 2016.
- ^ Leip, David. "Dave Leip's Atlas of U.S. Presidential Elections". uselectionatlas.org. Retrieved April 2, 2018.
- ^ "2020 CENSUS - SCHOOL DISTRICT REFERENCE MAP: Sandoval County, NM" (PDF). U.S. Census Bureau. Archived (PDF) from the original on January 10, 2022. Retrieved July 12, 2022. - Text list
Places adjacent to Sandoval County, New Mexico | ||||||||||||||||
|---|---|---|---|---|---|---|---|---|---|---|---|---|---|---|---|---|
| ||||||||||||||||
Municipalities and communities of Sandoval County, New Mexico, United States | ||
|---|---|---|
| City |  | |
| Towns | ||
| Villages | ||
| CDPs | ||
| Unincorporated community | ||
| Indian reservations | ||
| Footnotes | ‡This populated place also has portions in an adjacent county or counties | |
| History |  | ||
|---|---|---|---|
| Areas | |||
| Metropolitan area |
| ||
| Transportation | |||
| Landmarks | |||
| Education |
| ||
| Media | |||
| People | |||
| Politics |
| ||
| Culture | |||
Atrisco Heritage Academy HS, Kirtland Air Force Base, and National Museum of Nuclear Science & History are adjacent to but outside of the city limits. | |||
| International | |
|---|---|
| National | |
35°41′N 106°51′W / 35.69°N 106.85°W