To install click the Add extension button. That's it.

The source code for the WIKI 2 extension is being checked by specialists of the Mozilla Foundation, Google, and Apple. You could also do it yourself at any point in time.

4,5
Kelly Slayton
Congratulations on this excellent venture… what a great idea!
Alexander Grigorievskiy
I use WIKI 2 every day and almost forgot how the original Wikipedia looks like.
Live Statistics
English Articles
Improved in 24 Hours
Added in 24 Hours
What we do. Every page goes through several hundred of perfecting techniques; in live mode. Quite the same Wikipedia. Just better.
.
Leo
Newton
Brights
Milds

Results of the 1990 Australian federal election (House of Representatives)

From Wikipedia, the free encyclopedia

1990 Australian federal election

← 1987 24 March 1990 (1990-03-24) 1993 →

All 148 seats in the House of Representatives
75 seats were needed for a majority in the House
40 (of the 76) seats in the Senate
Registered10,728,435 Increase 3.62%
Turnout10,225,800 (95.31%)
(Increase1.47 pp)
  First party Second party
 
Leader Bob Hawke Andrew Peacock
Party Labor Liberal/National coalition
Leader since 8 February 1983 9 May 1989
Leader's seat Wills (Vic.) Kooyong (Vic.)
Last election 86 seats 62 seats
Seats won 78 seats 69 seats
Seat change Decrease 8 Increase 7
First preference vote 3,904,138 4,302,127
Percentage 39.44% 43.46%
Swing Decrease 6.46% Decrease 2.44%
TPP 49.90% 50.10%
TPP swing Decrease 0.93 Increase 0.93

Results by division for the House of Representatives, shaded by winning party's margin of victory.

Prime Minister before election

Bob Hawke
Labor

Subsequent Prime Minister

Bob Hawke
Labor

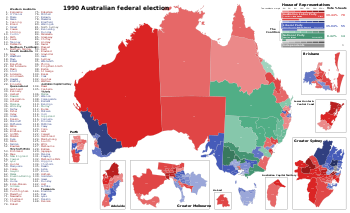
The following tables show results for the Australian House of Representatives at the 1990 federal election held on 24 March 1990.[1]

Australia

House of Reps (IRV) — 1990–93 — Turnout 95.32% (CV) — Informal 3.19%
Party Votes % Swing Seats Change
    Liberal 3,440,902 34.76 +0.44 55 Increase 12
  National 833,557 8.42 –3.10 14 Decrease 5
  Country Liberal 27,668 0.28 +0.05 0 Steady
Liberal–National coalition 4,302,127 43.46 –2.44 69 Increase 7
  Labor 3,904,138 39.44 –6.46 78 Decrease 8
  Democrats 1,114,216 11.26 +5.26
  Greens (state-based)[a] 137,351 1.37
  Call to Australia 96,497 0.97
  Grey Power 20,984 0.21
  Democratic Socialist 20,668 0.21 +0.20
  Independent EFF 9,375 0.09
  Rex Connor Labor 8,277 0.08
  New Australia 7,043 0.07
  Nuclear Disarmament 5,578 0.06 –0.05
  Environment Inds 4,866 0.05
  Citizens Electoral Council 3,524 0.04
  Democratic Labor 2,564 0.03 –0.01
  Socialist 2,255 0.02
  Conservative 1,734 0.02
  Pensioner 1,170 0.01 –0.03
  Against Further Immigration 835 0.01
  Independents[b] 257,139 2.60 +0.94 1 Increase 1
Total 9,899,674 148  
Two-party-preferred vote
  Labor 4,930,837 49.90 −0.93 78 Decrease 8
  Liberal–National coalition 4,950,072 50.10 +0.93 69 Increase 7
Invalid/blank votes 326,126 3.19 –1.75
Turnout 10,225,800 95.32
Registered voters 10,728,131
Source: Federal Elections 1990

States

New South Wales

1990 Australian federal election
(New South Wales)

← 1987 24 March 1990 1993 →

All 51 New South Wales seats in the Australian House of Representatives
and 6 seats in the Australian Senate
  First party Second party
 
Leader Bob Hawke Andrew Peacock
Party Labor Liberal/National coalition
Last election 28 seats 23 seats
Seats won 30 seats 20 seats
Seat change Increase 2 Decrease 3
Popular vote 1,380,780 1,352,770
Percentage 41.16% 40.32%
Swing Increase 4.0 Decrease 4.7
TPP 51.94% 48.61%
TPP swing Increase 1.65 Decrease 1.65
Turnout 95.4% (CV) — Informal 3.1%[2]
Party Votes % Swing Seats Change
    Liberal 975,083 32.76 −4.19 12 Decrease 1
  National 377,687 10.53 −0.52 8 Decrease 2
Liberal/National Coalition 1,352,770 40.32 −4.72 20 Decrease 3
  Labor 1,380,780 41.16 +4.01 30 Increase 2
  Democrats 342,540 10.21 +6.34
  Independents[b] 166,832 4.97 +1.55 1 Increase 1
  Green Alliance[c] 45,819 1.37
  Call to Australia 21,646 0.65
  Independent EFF 9,375 0.28
  Rex Connor Labor 8,277 0.25
  New Australia 6,376 0.19
  Democratic Socialist 5,809 0.17
  Grey Power 5,034 0.15
  Environment Inds 4,866 0.15
  Nuclear Disarmament 3,210 0.10 +0.07
  Socialist 1,337 0.04
Total 3,354,671 51
Two-party-preferred vote
  Labor 1,706,398 51.94 +1.65 Increase 2
  Liberal/National Coalition 1,578,738 48.06 –1.65 Decrease 3
Invalid/blank votes 108,134 3.1 –1.5
Turnout 3,462,805 95.4
Registered voters 3,630,841
Source: Federal Elections 1990

Victoria

1990 Australian federal election
(Victoria)

← 1987 24 March 1990 1993 →

All 38 Victorian seats in the Australian House of Representatives
and 6 seats in the Australian Senate
  First party Second party
 
Leader Andrew Peacock Bob Hawke
Party Liberal/National coalition Labor
Last election 15 24 seats
Seats won 24 seats 14 seats
Seat change Increase 9 Decrease 10
Popular vote 1,172,809 951,674
Percentage 45.7% 37.1%
Swing Increase 1.4 Decrease 9.8
TPP 52.5% 47.5%
TPP swing Increase 5.1 Decrease 5.1
Turnout 95.7% (CV) — Informal 3.5%[2]
Party Votes % Swing Seats Change
    Liberal 1,018,740 39.7 +1.7 21 Increase 9
  National 154,069 6.0 −0.3 3 Steady
Liberal/National Coalition 1,172,809 45.7 +1.4 24 Increase 9
  Labor 951,674 37.1 −9.8 14 Decrease 10
  Democrats 319,149 12.43 +5.7
  Independents 55,357 2.16 −4.3
  Call to Australia 52,554 2.05
  Democratic Socialist 6,836 0.27
  Citizens Electoral Council 3,524 0.14
  Democratic Labor 2,564 0.10 −0.04
  Socialist 918 0.04
  Pensioner 910 0.04
  Against Further Immigration 835 0.03
Total 2,567,139 38 Decrease 1
Two-party-preferred vote
  Liberal/National Coalition 1,347,048 52.54 +5.1 24 Increase 9
  Labor 1,216,633 47.46 −5.1 14 Decrease 10
Invalid/blank votes 94,334 3.54 −1.7
Turnout 2,661,464 95.68
Registered voters 2,781,547
Source: Federal Elections 1990

Queensland

1990 Australian federal election
(Queensland)

← 1987 24 March 1990 1993 →

All 24 Queensland seats in the Australian House of Representatives
and 6 seats in the Australian Senate
  First party Second party
 
Leader Bob Hawke Andrew Peacock
Party Labor Liberal/National coalition
Last election 13 11 seats
Seats won 15 seats 9 seats
Seat change Increase 2 Decrease 2
Popular vote 695,291 756,680
Percentage 41.6% 45.3%
Swing Decrease 3.4 Decrease 4.6
TPP 50.19% 49.81%
TPP swing Increase 0.87 Decrease 0.87
Turnout 94.7% (CV) — Informal 2.2%[2]
Party Votes % Swing Seats Change
    Liberal 476,560 28.51 7.49 6 Increase 1
  National 280,120 16.76 –12.09 3 Decrease 3
Liberal/National Coalition 756,680 45.27 –4.60 9 Decrease 2
  Labor 695,291 41.59 –3.37 15 Increase 2
  Democrats 193,817 11.59 6.71
  Independent 11,499 0.69 0.51
  Greens 10,054 0.60 0.60
  Democratic Socialist 2,728 0.16 0.16
  Conservative 1,528 0.09 0.09
Total 1,671,597 24
Two-party-preferred vote
  Labor 837,508 50.19 +0.87 15 Increase 2
  Liberal/National Coalition 831,015 49.81 –0.87 9 Decrease 2
Invalid/blank votes 38,065 2.23 –1.18
Turnout 1,709,662 94.71
Registered voters 1,805,141
Source: Federal Elections 1990

Western Australia

1990 Australian federal election
(Western Australia)

← 1987 24 March 1990 1993 →

All 14 Western Australia seats in the Australian House of Representatives
and 6 seats in the Australian Senate
  First party Second party
 
Leader Andrew Peacock Bob Hawke
Party Liberal/National coalition Labor
Last election 4 seats 9 seats
Seats won 6 seats 8 seats
Seat change Increase 2 Decrease 1
Popular vote 414,551 316,186
Percentage 46.3% 35.3%
Swing Decrease 2.4 Decrease 12.2
TPP 52.87% 47.13%
TPP swing Increase 3.78 Decrease 3.78
Turnout 94.5% (CV) — informal 3.7%[2]
Party Votes % Swing Seats Change
    Liberal 392,870 43.91 2.12 6 Increase 2
  National 21,681 2.42 -4.48 Steady
Liberal/National Coalition 414,551 46.33 -2.36 4 Increase 2
  Labor 316,186 35.34 -12.14 9 Decrease 1
  Democrats 75,197 8.40 +4.97
  Greens 67,164 7.51
  Grey Power 12,043 1.35
  Independents 5,756 0.64 +0.25
  Democratic Socialist 3,336 0.37
  Pensioner 260 0.03
  Conservative 206 0.02
Total 894,699 13 Increase 1
Two-party-preferred vote
  Labor 420,816 47.13 -3.78 8 Decrease 1
  Liberal/National Coalition 472,092 52.87 3.78 6 Increase 2
Invalid/blank votes 34,418 3.70 -2.86
Turnout 929,117 94.53
Registered voters 982,901
Source: Federal Elections 1990

South Australia

1990 Australian federal election
(South Australia)

← 1987 24 March 1990 1993 →

All 13 South Australian seats in the Australian House of Representatives
and 6 seats in the Australian Senate
  First party Second party
 
Leader Andrew Peacock Bob Hawke
Party Liberal/National coalition Labor
Last election 5 seats 8 seats
Seats won 6 seats 7 seats
Seat change Increase 1 Decrease 1
Popular vote 381,172 339,218
Percentage 42.6% 38.0%
Swing Increase 0.1 Decrease 6.6
TPP 50.5% 49.5%
TPP swing Increase 0.7 Decrease 0.7
Turnout 96.0% (CV) — Informal 3.7%[2]
Party Votes % Swing Seats Change
  Liberal 381,172 42.65 +0.14 6 Increase 1
  Labor 339,218 37.95 -6.60 7 Decrease 1
  Democrats 135,546 15.17 +7.38
  Call to Australia 22,297 2.49
  Independents 8,104 0.91 0.02
  Grey Power 3,907 0.44
  Greens 1,878 0.21
  Democratic Socialist 1,632 0.18
Total 893,754 13
Two-party-preferred vote
  Labor 441,659 49.5 -0.7 7 Decrease 1
  Liberal/National Coalition 450.503 50.5 +0.7 6 Increase 1
Invalid/blank votes 34,143 3.68 -3.16
Turnout 927,897 96.01
Registered voters 966,431
Source: Federal Elections 1990

Tasmania

1990 Australian federal election
(Tasmania)

← 1987 24 March 1990 1993 →

All 5 Tasmanian seats in the Australian House of Representatives
and 6 seats in the Australian Senate
  First party Second party
 
Leader Andrew Peacock Bob Hawke
Party Liberal/National coalition Labor
Last election 4 seats 1 seat
Seats won 4 seats 1 seat
Seat change Steady Steady
Popular vote 140,722 115,053
Percentage 48.61% 39.74%
Swing Decrease 2.44 Decrease 3.25
TPP 52.1% 47.9%
TPP swing Decrease 1.0 Increase 1.0
Turnout 96.5% (CV) — Informal 2.3%[2]
Party Votes % Swing Seats Change
  Liberal 140,722 48.61 −2.44 4 Steady
  Labor 115,053 39.74 −3.25 1 Steady
  Democrats 24,876 8.59 +2.63 Steady
  United Tasmania 6,367 2.20
  Independent 2,159 0.75
  Democratic Socialist 327 0.11
Total 289,504 5
Two-party-preferred vote
  Liberal 138,556 52.10 −1.00 4 Steady
  Labor 150,709 47.90 +1.00 1 Steady
Invalid/blank votes 9,774 3.27 −1.68
Turnout 299,278 96.5
Registered voters 300,763
Source: Federal Elections 1990

Territories

Australian Capital Territory

1990 Australian federal election
(Australian Capital Territory)

← 1987 1 December 1990 1993 →

Both Australian Capital Territory seats in the Australian House of Representatives
and both seats in the Australian Senate
  First party Second party
 
Leader Bob Hawke Andrew Peacock
Party Labor Coalition
Last election 2 seats 0 seats
Seats won 2 0
Seat change Steady Steady
Popular vote 71,830 55,755
Percentage 44.88% 34.83%
Swing Decrease 9.04 Increase 4.55
TPP 58.54% 41.46%
TPP swing Decrease 4.71 Increase 4.71
Turnout 94.1% (CV) — Informal 2.9%[2]
Party Votes % Swing Seats Change
  Labor 71,830 44.88 -9.04 2 Steady
  Liberal 55,755 34.83 4.55 Steady
  Democrats 23,091 14.43 7.59
  Green Democratic 6,069 3.79 0.00
  Nuclear Disarmament 2,368 1.48 -3.19
  Independent 949 0.59 -0.96
Total 160,062 2
Two-party-preferred vote
  Labor 93,498 58.54 -4.71 2 Steady
  Liberal 66,206 41.46 4.71 0 Steady
Invalid/blank votes 4,871 2.95 -0.53
Turnout 164,933 95.78
Registered voters 172,200
Source: Psephos Adam Carr's Election Archive 1990

Northern Territory

1990 Australian federal election
(Northern Territory)

← 1987 1 December 1990 1993 →

The one Northern Territory seat in the Australian House of Representatives
and both seats in the Australian Senate
  First party Second party
 
Leader Bob Hawke Andrew Peacock
Party Labor Coalition
Last election 1 seat 0 seats
Seats won 1 0
Seat change Steady Steady
Popular vote 34,106 27,668
Percentage 50.0% 40.5%
Swing Increase 3.1 Increase 4.5
TPP 55.0% 45.0%
TPP swing Increase 2.8 Decrease 2.8
1990 Australian federal election: Northern Territory[3]
Party Candidate Votes % ±%
Labor Warren Snowdon 34,106 50.0 +3.1
Country Liberal Helen Galton 27,668 40.5 +4.5
Independent Don Beaton 1,900 2.8 +2.8
Independent Bob Liddle 1,427 2.1 +2.1
Independent Tig Donnellan 1,380 2.0 +2.0
Independent Strider 975 1.4 +1.4
Independent Ron Sterry 801 1.2 +1.2
Total formal votes 68,257 96.6
Informal votes 2,387 3.4
Turnout 70,644 89.4
Two-party-preferred result
Labor Warren Snowdon 37,498 55.0 +2.8
Country Liberal Helen Galton 30,650 45.0 -2.8
Labor hold Swing +2.8

See also

Notes

  1. ^ There was no federal Australian Greens party at this election. The Greens total includes Greens Western Australia (67,164), NSW Green Alliance[c] (45,819), Queensland Greens (10,054), United Tasmania Group (6,367), Greens South Australia (1,878) and ACT Green Democratic Alliance (6,069).
  2. ^ a b The independent member was Ted Mack (NSW).
  3. ^ a b At this election the Greens in New South Wales were a loose alliance largely organised by local groups, with 18 candidates running under a variety of names: Australian Gruen Party (Fowler, Macarthur, Mackellar, Macquarie, Prospect, St George, Throsby and Werriwa), the Greens (Phillip and Wentworth), Illawarra Greens (Cunningham and Hughes), Sydney Greens, South Sydney Greens (Kingsford Smith), Central Coast Green Party (Dobell and Robertson), Greens in Lowe and Cowper Greens.

References

  1. ^ Newman, G; Kopras, A (20 July 1990). "Federal Elections 1990" (PDF). Background Paper 18 1990. Parliamentary Research Service. ISSN 1034-8107. Retrieved 20 June 2022.
  2. ^ a b c d e f g "1990 House of Representatives". Psephos Adam Carr's Election Archive. Retrieved 10 June 2022.
  3. ^ "1990 House of Representatives: Northern Territory". Psephos Adam Carr's Election Archive. Retrieved 22 June 2022.
This page was last edited on 17 April 2023, at 22:48
Basis of this page is in Wikipedia. Text is available under the CC BY-SA 3.0 Unported License. Non-text media are available under their specified licenses. Wikipedia® is a registered trademark of the Wikimedia Foundation, Inc. WIKI 2 is an independent company and has no affiliation with Wikimedia Foundation.