
This is a list of electoral division results for the Australian 1946 federal election.[1]
Overall
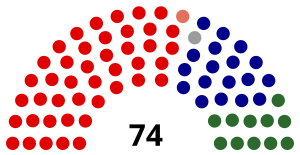
- This section is an excerpt from 1946 Australian federal election § House of Representatives
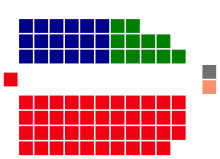
Labor: 43 seats
Liberal: 18 seats
Country: 11 seats
Lang Labor: 1 seat
Independent: 1 seat
| Party | Votes | % | Swing | Seats | Change | ||
|---|---|---|---|---|---|---|---|
| Labor | 2,159,953 | 49.71 | −0.22 | 43 | −6 | ||
| Liberal–Country coalition | 1,896,349 | 43.65 | +13.20 | 29 | +6 | ||
| Liberal | 1,431,682 | 32.95 | +11.05 | 18 | +4 | ||
| Country | 464,667 | 10.70 | +2.16 | 11 | +2 | ||
| Labor (Non-Communist) | 69,138 | 1.59 | +0.87 | 1 | +1 | ||
| Communist | 64,811 | 1.49 | +1.49 | 0 | 0 | ||
| Services | 55,140 | 1.27 | +1.27 | 0 | 0 | ||
| Protestant People's | 20,111 | 0.46 | +0.46 | 0 | 0 | ||
| Independents | 79,040 | 1.82 | −10.34 | 2[a] | -1 | ||
| Total | 4,344,542 | 75 | |||||
| Two-party-preferred (estimated) | |||||||
| Labor | Win | 54.10 | −4.10 | 43 | −6 | ||
| Liberal–Country coalition | 45.90 | +4.10 | 29 | +6 | |||
- Notes
- Independent: Doris Blackburn (Bourke, Vic.)
- In South Australia, the Liberal Party was known as the Liberal and Country League.
New South Wales
| |||||||||||||||||||||||||||||||||||||
All 28 NSW seats in the House of Representatives 14 seats needed for a majority | |||||||||||||||||||||||||||||||||||||
|---|---|---|---|---|---|---|---|---|---|---|---|---|---|---|---|---|---|---|---|---|---|---|---|---|---|---|---|---|---|---|---|---|---|---|---|---|---|
| |||||||||||||||||||||||||||||||||||||


Barton
- This section is an excerpt from Electoral results for the Division of Barton § 1946
| Party | Candidate | Votes | % | ±% | |
|---|---|---|---|---|---|
| Labor | Herbert Evatt | 48,740 | 66.9 | −7.3 | |
| Liberal | George Hohnen | 24,064 | 33.1 | +10.1 | |
| Total formal votes | 72,804 | 98.1 | |||
| Informal votes | 1,389 | 1.9 | |||
| Turnout | 74,193 | 96.8 | |||
| Labor hold | Swing | −8.7 | |||
Calare
- This section is an excerpt from Electoral results for the Division of Calare § 1946
| Party | Candidate | Votes | % | ±% | |
|---|---|---|---|---|---|
| Labor | John Breen | 22,988 | 47.2 | −7.2 | |
| Liberal | John Howse | 14,270 | 29.3 | +29.3 | |
| Country | Harold Thorby | 11,189 | 23.0 | −7.9 | |
| Independent | Madge Roberts | 296 | 0.6 | +0.6 | |
| Total formal votes | 48,743 | 98.3 | |||
| Informal votes | 840 | 1.7 | |||
| Turnout | 49,583 | 94.5 | |||
| Two-party-preferred result | |||||
| Liberal | John Howse | 25,247 | 51.8 | +11.7 | |
| Labor | John Breen | 23,496 | 48.2 | −11.7 | |
| Liberal gain from Labor | Swing | +11.7 | |||
Cook
- This section is an excerpt from Electoral results for the Division of Cook (1906–1955) § 1946
| Party | Candidate | Votes | % | ±% | |
|---|---|---|---|---|---|
| Labor | Tom Sheehan | 38,407 | 65.1 | −3.8 | |
| Lang Labor | Arthur Brittain | 8,423 | 14.3 | +14.3 | |
| Liberal | Frank Preacher | 7,306 | 12.4 | +12.4 | |
| Communist | Lance Sharkey | 4,341 | 7.4 | +7.4 | |
| Independent | Frederick Fairbrother | 559 | 0.9 | +0.9 | |
| Total formal votes | 59,036 | 96.0 | |||
| Informal votes | 2,441 | 4.0 | |||
| Turnout | 61,477 | 95.0 | |||
| Two-party-preferred result | |||||
| Labor | Tom Sheehan | 73.4 | −3.0 | ||
| Lang Labor | Arthur Brittain | 26.6 | +26.6 | ||
| Labor hold | Swing | −3.0 | |||
Cowper
- This section is an excerpt from Electoral results for the Division of Cowper § 1946
| Party | Candidate | Votes | % | ±% | |
|---|---|---|---|---|---|
| Country | Sir Earle Page | 31,785 | 57.2 | +11.7 | |
| Labor | George Mitchell | 21,253 | 38.2 | −2.3 | |
| Independent | Richard Williams | 2,544 | 4.6 | +4.6 | |
| Total formal votes | 55,582 | 99.6 | |||
| Informal votes | 798 | 1.4 | |||
| Turnout | 56,380 | 95.2 | |||
| Two-party-preferred result | |||||
| Country | Sir Earle Page | 59.5 | +6.9 | ||
| Labor | George Mitchell | 40.5 | −6.9 | ||
| Country hold | Swing | +6.9 | |||
Dalley
- This section is an excerpt from Electoral results for the Division of Dalley § 1946
| Party | Candidate | Votes | % | ±% | |
|---|---|---|---|---|---|
| Labor | Sol Rosevear | 38,571 | 63.4 | −11.4 | |
| Liberal | Leslie Webster | 14,674 | 24.1 | +24.1 | |
| Lang Labor | Kenneth Falvey | 7,549 | 12.4 | +12.4 | |
| Total formal votes | 60,794 | 97.5 | |||
| Informal votes | 1,531 | 2.5 | |||
| Turnout | 62,325 | 94.8 | |||
| Two-party-preferred result | |||||
| Labor | Sol Rosevear | 73.7 | −7.4 | ||
| Liberal | Leslie Webster | 26.3 | +26.3 | ||
| Labor hold | Swing | −7.4 | |||
Darling
- This section is an excerpt from Electoral results for the Division of Darling § 1946
| Party | Candidate | Votes | % | ±% | |
|---|---|---|---|---|---|
| Labor | Joe Clark | 27,449 | 60.7 | −10.9 | |
| Country | John McGirr | 12,229 | 27.0 | +27.0 | |
| Protestant People | Cyril Glassop | 5,533 | 12.2 | +12.2 | |
| Total formal votes | 45,211 | 97.7 | |||
| Informal votes | 1,058 | 2.3 | |||
| Turnout | 46,269 | 89.8 | |||
| Two-party-preferred result | |||||
| Labor | Joe Clark | 66.8 | −4.8 | ||
| Country | John McGirr | 32.2 | +32.2 | ||
| Labor hold | Swing | −4.8 | |||
East Sydney
- This section is an excerpt from Electoral results for the Division of East Sydney § 1946
| Party | Candidate | Votes | % | ±% | |
|---|---|---|---|---|---|
| Labor | Eddie Ward | 37,863 | 65.5 | -3.5 | |
| Liberal | Ivan Dougherty | 16,348 | 28.3 | +4.8 | |
| Protestant People | Wal Campbell | 3,578 | 6.2 | +6.2 | |
| Total formal votes | 57,789 | 97.1 | |||
| Informal votes | 1,716 | 2.9 | |||
| Turnout | 59,505 | 92.0 | |||
| Two-party-preferred result | |||||
| Labor | Eddie Ward | 67.6 | -3.4 | ||
| Liberal | Ivan Dougherty | 32.4 | +3.4 | ||
| Labor hold | Swing | -3.4 | |||
Eden-Monaro
- This section is an excerpt from Electoral results for the Division of Eden-Monaro § 1946
| Party | Candidate | Votes | % | ±% | |
|---|---|---|---|---|---|
| Labor | Allan Fraser | 25,231 | 50.2 | +1.3 | |
| Liberal | Denzil Macarthur-Onslow | 18,560 | 36.9 | +15.9 | |
| Country | Pat Osborne | 3,292 | 6.5 | +6.5 | |
| Country | Allan Backhouse | 2,883 | 5.7 | +5.7 | |
| Services | Victor Brown | 322 | 0.6 | +0.6 | |
| Total formal votes | 50,288 | 97.4 | |||
| Informal votes | 1,321 | 2.6 | |||
| Turnout | 51,609 | 95.0 | |||
| Two-party-preferred result | |||||
| Labor | Allan Fraser | 52.7 | -2.7 | ||
| Liberal | Denzil Macarthur-Onslow | 47.3 | +47.3 | ||
| Labor hold | Swing | -2.7 | |||
Gwydir
- This section is an excerpt from Electoral results for the Division of Gwydir § 1946
| Party | Candidate | Votes | % | ±% | |
|---|---|---|---|---|---|
| Labor | William Scully | 22,434 | 48.7 | -10.8 | |
| Country | Thomas Treloar | 16,513 | 35.4 | +5.4 | |
| Protestant People | William Campbell | 2,661 | 5.8 | +5.8 | |
| Liberal | Thomas Mort | 1,689 | 3.7 | +3.7 | |
| Independent Country | Ben Wade | 1,350 | 2.9 | +2.9 | |
| Services | Tom Carmody | 914 | 2.0 | +2.0 | |
| Independent | George McDonald | 381 | 0.8 | +0.8 | |
| Independent | Kevin Nott | 322 | 0.7 | +0.7 | |
| Total formal votes | 46,064 | 95.7 | |||
| Informal votes | 2,054 | 4.3 | |||
| Turnout | 48,118 | 92.6 | |||
| Two-party-preferred result | |||||
| Labor | William Scully | 51.2 | -12.5 | ||
| Country | Thomas Treloar | 48.8 | +12.5 | ||
| Labor hold | Swing | -12.5 | |||
Hume
- This section is an excerpt from Electoral results for the Division of Hume § 1946
| Party | Candidate | Votes | % | ±% | |
|---|---|---|---|---|---|
| Labor | Arthur Fuller | 26,720 | 51.8 | +2.2 | |
| Country | Warren McDonald | 17,474 | 33.9 | −4.4 | |
| Liberal | Geoffrey Davey | 7,397 | 14.3 | +14.3 | |
| Total formal votes | 51,591 | 98.3 | |||
| Informal votes | 872 | 1.7 | |||
| Turnout | 52,463 | 92.4 | |||
| Two-party-preferred result | |||||
| Labor | Arthur Fuller | 54.2 | −2.1 | ||
| Country | Warren McDonald | 45.8 | +2.1 | ||
| Labor hold | Swing | −2.1 | |||
Hunter
- This section is an excerpt from Electoral results for the Division of Hunter § 1946
| Party | Candidate | Votes | % | ±% | |
|---|---|---|---|---|---|
| Labor | Rowley James | 25,366 | 76.9 | -23.1 | |
| Liberal | Ted Fletcher | 10,208 | 17.3 | +17.3 | |
| Lang Labor | John Cain | 3,392 | 5.8 | +5.8 | |
| Total formal votes | 58,966 | 98.1 | |||
| Informal votes | 1,119 | 1.9 | |||
| Turnout | 60,085 | 95.8 | |||
| Two-party-preferred result | |||||
| Labor | Rowley James | 80.3 | -19.7 | ||
| Liberal | Ted Fletcher | 19.7 | +19.7 | ||
| Labor hold | Swing | -19.7 | |||
Lang
- This section is an excerpt from Electoral results for the Division of Lang § 1946
| Party | Candidate | Votes | % | ±% | |
|---|---|---|---|---|---|
| Labor | Dan Mulcahy | 37,918 | 51.7 | -9.8 | |
| Liberal | John Paget | 24,963 | 34.0 | +9.4 | |
| Communist | Adam Ogston | 5,508 | 7.5 | +1.1 | |
| Lang Labor | Sidney Bell | 4,995 | 6.8 | +6.8 | |
| Total formal votes | 73,384 | 97.7 | |||
| Informal votes | 1,708 | 2.3 | |||
| Turnout | 75,092 | 96.7 | |||
| Two-party-preferred result | |||||
| Labor | Dan Mulcahy | 64.6 | -6.4 | ||
| Liberal | John Paget | 35.4 | +6.4 | ||
| Labor hold | Swing | -6.4 | |||
Macquarie
- This section is an excerpt from Electoral results for the Division of Macquarie § 1946
| Party | Candidate | Votes | % | ±% | |
|---|---|---|---|---|---|
| Labor | Ben Chifley | 33,412 | 58.4 | -6.6 | |
| Liberal | Eric Spooner | 17,106 | 29.9 | +2.3 | |
| Country | Cecil Williams | 5,342 | 9.3 | +9.3 | |
| Independent | John Sutton | 1,344 | 2.3 | +2.3 | |
| Total formal votes | 57,204 | 98.1 | |||
| Informal votes | 1,121 | 1.9 | |||
| Turnout | 58,325 | 93.6 | |||
| Two-party-preferred result | |||||
| Labor | Ben Chifley | 60.5 | -8.3 | ||
| Liberal | Eric Spooner | 39.5 | +8.3 | ||
| Labor hold | Swing | -8.3 | |||
Martin
- This section is an excerpt from Electoral results for the Division of Martin § 1946
| Party | Candidate | Votes | % | ±% | |
|---|---|---|---|---|---|
| Labor | Fred Daly | 35,998 | 55.0 | +8.1 | |
| Liberal | Frederick Jacobs | 29,507 | 45.0 | +11.7 | |
| Total formal votes | 65,505 | 98.1 | |||
| Informal votes | 1,258 | 1.9 | |||
| Turnout | 66,763 | 96.2 | |||
| Labor hold | Swing | -0.7 | |||
New England
- This section is an excerpt from Electoral results for the Division of New England § 1946
| Party | Candidate | Votes | % | ±% | |
|---|---|---|---|---|---|
| Country | Joe Abbott | 29,664 | 60.6 | +15.2 | |
| Labor | Leigh Cuthbertson | 19,310 | 39.4 | -7.5 | |
| Total formal votes | 48,974 | 98.2 | |||
| Informal votes | 880 | 1.8 | |||
| Turnout | 49,854 | 93.9 | |||
| Country hold | Swing | +9.5 | |||
Newcastle
- This section is an excerpt from Electoral results for the Division of Newcastle § 1946
| Party | Candidate | Votes | % | ±% | |
|---|---|---|---|---|---|
| Liberal | Billy Hughes | 40,845 | 55.9 | +11.8 | |
| Labor | Leo Haylen | 32,247 | 44.1 | +8.4 | |
| Total formal votes | 73,092 | 98.0 | |||
| Informal votes | 1,503 | 2.0 | |||
| Turnout | 74,595 | 96.1 | |||
| Liberal hold | Swing | +2.8 | |||
North Sydney
- This section is an excerpt from Electoral results for the Division of North Sydney § 1946
| Party | Candidate | Votes | % | ±% | |
|---|---|---|---|---|---|
| Labor | David Watkins | 38,203 | 58.9 | -10.3 | |
| Liberal | Allen Fairhall | 15,124 | 23.3 | +23.3 | |
| Communist | Stan Deacon | 4,616 | 7.1 | -4.2 | |
| Lang Labor | Charles Dicker | 2,474 | 3.8 | +3.8 | |
| Services | Grahame Bland | 1,466 | 2.3 | +2.3 | |
| Independent | Edwin Dark | 923 | 1.4 | +1.4 | |
| Independent | Frederick Wilson | 723 | 1.1 | +1.1 | |
| Independent | Isabel Longworth | 626 | 1.0 | +1.0 | |
| Social Credit | Arthur Clarke | 360 | 0.6 | +0.6 | |
| Service | Harry Ellis | 336 | 0.5 | +0.5 | |
| Total formal votes | 64,851 | 94.7 | |||
| Informal votes | 3,653 | 5.3 | |||
| Turnout | 68,504 | 95.8 | |||
| Two-party-preferred result | |||||
| Labor | David Watkins | 71.3 | ? | ||
| Liberal | Allen Fairhall | 28.7 | +28.7 | ||
| Labor hold | Swing | ? | |||
Parkes
- This section is an excerpt from Electoral results for the Division of Parkes (1901–1969) § 1946
| Party | Candidate | Votes | % | ±% | |
|---|---|---|---|---|---|
| Labor | Les Haylen | 32,806 | 50.1 | +1.6 | |
| Liberal | Athol Richardson | 32,642 | 49.9 | +22.1 | |
| Total formal votes | 65,448 | 98.2 | |||
| Informal votes | 1,176 | 1.8 | |||
| Turnout | 66,624 | 95.6 | |||
| Labor hold | Swing | -2.8 | |||
Parramatta
- This section is an excerpt from Electoral results for the Division of Parramatta § 1946
| Party | Candidate | Votes | % | ±% | |
|---|---|---|---|---|---|
| Liberal | Howard Beale | 43,070 | 60.1 | +21.8 | |
| Labor | Dudley Jeffree | 28,645 | 39.9 | +2.5 | |
| Total formal votes | 71,715 | 98.1 | |||
| Informal votes | 1,417 | 1.9 | |||
| Turnout | 73,132 | 95.0 | |||
| Liberal hold | Swing | +0.8 | |||
Reid
- This section is an excerpt from Electoral results for the Division of Reid § 1946
| Party | Candidate | Votes | % | ±% | |
|---|---|---|---|---|---|
| Labor | Charles Morgan | 29,547 | 40.7 | +5.9 | |
| Lang Labor | Jack Lang | 25,049 | 34.5 | +34.5 | |
| Liberal | Jeffrey Blaxland | 15,755 | 21.7 | +10.8 | |
| Services | William Beckett | 2,194 | 3.0 | +3.0 | |
| Total formal votes | 72,545 | 97.6 | |||
| Informal votes | 1,805 | 2.4 | |||
| Turnout | 74,350 | 96.0 | |||
| Two-party-preferred result | |||||
| Lang Labor | Jack Lang | 39,316 | 54.2 | +7.4 | |
| Labor | Charles Morgan | 33,229 | 45.8 | -7.4 | |
| Lang Labor gain from Labor | Swing | +7.4 | |||
Richmond
- This section is an excerpt from Electoral results for the Division of Richmond § 1946
| Party | Candidate | Votes | % | ±% | |
|---|---|---|---|---|---|
| Country | Larry Anthony | 37,826 | 68.3 | +20.1 | |
| Labor | Keith Compton | 17,567 | 31.7 | +0.1 | |
| Total formal votes | 55,393 | 98.6 | |||
| Informal votes | 814 | 1.4 | |||
| Turnout | 56,207 | 93.7 | |||
| Country hold | Swing | +4.7 | |||
Riverina
- This section is an excerpt from Electoral results for the Division of Riverina § 1946
| Party | Candidate | Votes | % | ±% | |
|---|---|---|---|---|---|
| Labor | Joe Langtry | 19,898 | 43.5 | -11.8 | |
| Country | Hugh Roberton | 16,284 | 35.6 | +2.9 | |
| Liberal | Christopher Lethbridge | 7,086 | 15.5 | +15.5 | |
| Lang Labor | John Gosling | 2,230 | 4.9 | +4.9 | |
| Independent | William Pow | 246 | 0.5 | +0.5 | |
| Total formal votes | 45,744 | 96.4 | |||
| Informal votes | 1,714 | 3.6 | |||
| Turnout | 47,458 | 92.8 | |||
| Two-party-preferred result | |||||
| Labor | Joe Langtry | 23,134 | 50.6 | -12.5 | |
| Country | Hugh Roberton | 22,610 | 49.4 | +12.5 | |
| Labor hold | Swing | -12.5 | |||
Robertson
- This section is an excerpt from Electoral results for the Division of Robertson § 1946
| Party | Candidate | Votes | % | ±% | |
|---|---|---|---|---|---|
| Labor | Thomas Williams | 32,865 | 50.5 | +0.9 | |
| Liberal | Roy Wheeler | 24,483 | 37.6 | +0.3 | |
| Country | George Watkins | 4,624 | 7.1 | +7.1 | |
| Lang Labor | Ian Grant | 3,113 | 4.8 | +4.8 | |
| Total formal votes | 65,085 | 97.1 | |||
| Informal votes | 1,965 | 2.9 | |||
| Turnout | 67,050 | 93.8 | |||
| Two-party-preferred result | |||||
| Labor | Thomas Williams | 53.8 | -5.1 | ||
| Liberal | Roy Wheeler | 46.2 | +5.1 | ||
| Labor hold | Swing | -5.1 | |||
Warringah
- This section is an excerpt from Electoral results for the Division of Warringah § 1946
| Party | Candidate | Votes | % | ±% | |
|---|---|---|---|---|---|
| Liberal | Percy Spender | 48,625 | 62.8 | +14.3 | |
| Labor | George Godfrey | 28,773 | 37.2 | +3.5 | |
| Total formal votes | 77,398 | 98.3 | |||
| Informal votes | 1,337 | 1.7 | |||
| Turnout | 78,735 | 94.4 | |||
| Liberal hold | Swing | +2.3 | |||
Watson
- This section is an excerpt from Electoral results for the Division of Watson (1934–1969) § 1946
| Party | Candidate | Votes | % | ±% | |
|---|---|---|---|---|---|
| Labor | Max Falstein | 38,025 | 53.7 | +1.4 | |
| Liberal | Charles de Monchaux | 24,246 | 34.2 | +6.7 | |
| Protestant People | Charles Wilson | 6,177 | 8.7 | +8.7 | |
| Services | Wallace Knox | 2,364 | 3.3 | +3.3 | |
| Total formal votes | 70,812 | 97.5 | |||
| Informal votes | 1,809 | 2.5 | |||
| Turnout | 72,621 | 94.8 | |||
| Two-party-preferred result | |||||
| Labor | Max Falstein | 56.7 | -5.4 | ||
| Liberal | Charles de Monchaux | 45.3 | +5.4 | ||
| Labor hold | Swing | -5.4 | |||
Wentworth
- This section is an excerpt from Electoral results for the Division of Wentworth § 1946
| Party | Candidate | Votes | % | ±% | |
|---|---|---|---|---|---|
| Liberal | Eric Harrison | 40,790 | 54.3 | +21.4 | |
| Labor | Jessie Street | 31,432 | 41.8 | -1.7 | |
| Lang Labor | Charles Walsh | 2,898 | 3.9 | +3.9 | |
| Total formal votes | 75,120 | 98.0 | |||
| Informal votes | 1,501 | 2.0 | |||
| Turnout | 76,621 | 93.8 | |||
| Two-party-preferred result | |||||
| Liberal | Eric Harrison | 55.3 | +3.7 | ||
| Labor | Jessie Street | 44.7 | -3.7 | ||
| Liberal hold | Swing | +3.7 | |||
Werriwa
- This section is an excerpt from Electoral results for the Division of Werriwa § 1946
| Party | Candidate | Votes | % | ±% | |
|---|---|---|---|---|---|
| Labor | Bert Lazzarini | 39,408 | 54.0 | −14.7 | |
| Liberal | Ray Watson | 26,993 | 37.0 | +37.0 | |
| Communist | Les Mullin | 6,511 | 8.9 | +8.9 | |
| Total formal votes | 72,912 | 98.0 | |||
| Informal votes | 1,478 | 2.0 | |||
| Turnout | 74,390 | 94.9 | |||
| Two-party-preferred result | |||||
| Labor | Bert Lazzarini | 62.1 | −12.6 | ||
| Liberal | Ray Watson | 37.9 | +37.9 | ||
| Labor hold | Swing | −12.6 | |||
West Sydney
- This section is an excerpt from Electoral results for the Division of West Sydney § 1946
| Party | Candidate | Votes | % | ±% | |
|---|---|---|---|---|---|
| Labor | William O'Connor | 29,417 | 56.6 | -13.1 | |
| Lang Labor | Thomas Ryan | 7,671 | 14.8 | +14.8 | |
| Liberal | John Mant | 6,300 | 12.1 | +12.1 | |
| Communist | Stan Moran | 4,380 | 8.4 | +8.4 | |
| Protestant People | Ronald Sarina | 2,162 | 4.2 | +4.2 | |
| Independent | Malinda Ivey | 2,063 | 4.0 | +4.0 | |
| Total formal votes | 51,993 | 94.8 | |||
| Informal votes | 2,829 | 5.2 | |||
| Turnout | 54,822 | 91.9 | |||
| Two-party-preferred result | |||||
| Labor | William O'Connor | 77.4 | -1.8 | ||
| Lang Labor | Thomas Ryan | 22.6 | +22.6 | ||
| Labor hold | Swing | -1.8 | |||
Victoria
| ||||||||||||||||||||||||||||
All 20 Victorian seats in the House of Representatives 10 seats needed for a majority | ||||||||||||||||||||||||||||
|---|---|---|---|---|---|---|---|---|---|---|---|---|---|---|---|---|---|---|---|---|---|---|---|---|---|---|---|---|
| ||||||||||||||||||||||||||||
Balaclava
- This section is an excerpt from Electoral results for the Division of Balaclava § 1946
| Party | Candidate | Votes | % | ±% | |
|---|---|---|---|---|---|
| Liberal | Thomas White | 45,137 | 58.4 | +6.8 | |
| Labor | Maurice Ashkanasy | 32,087 | 41.6 | +5.3 | |
| Total formal votes | 77,224 | 98.3 | |||
| Informal votes | 1,348 | 1.7 | |||
| Turnout | 78,572 | 93.4 | |||
| Liberal hold | Swing | +1.8 | |||
Ballaarat
- This section is an excerpt from Electoral results for the Division of Ballarat § 1946
| Party | Candidate | Votes | % | ±% | |
|---|---|---|---|---|---|
| Labor | Reg Pollard | 25,827 | 53.1 | −1.4 | |
| Liberal | Arnold Caddy | 22,812 | 46.9 | +6.2 | |
| Total formal votes | 48,639 | 98.7 | |||
| Informal votes | 617 | 1.3 | |||
| Turnout | 49,256 | 95.7 | |||
| Labor hold | Swing | −4.8 | |||
Batman
- This section is an excerpt from Electoral results for the Division of Batman § 1946
| Party | Candidate | Votes | % | ±% | |
|---|---|---|---|---|---|
| Labor | Frank Brennan | 39,754 | 58.3 | −6.0 | |
| Liberal | John McColl | 20,930 | 30.7 | +9.8 | |
| Independent | Allan Brennan | 4,250 | 6.2 | +6.2 | |
| Communist | George Oke | 3,222 | 4.7 | +4.7 | |
| Total formal votes | 68,156 | 97.3 | |||
| Informal votes | 1,881 | 2.7 | |||
| Turnout | 70,037 | 95.7 | |||
| Two-party-preferred result | |||||
| Labor | Frank Brennan | 66.7 | −7.9 | ||
| Liberal | John McColl | 33.3 | +7.9 | ||
| Labor hold | Swing | −7.9 | |||
Bendigo
- This section is an excerpt from Electoral results for the Division of Bendigo § 1946
| Party | Candidate | Votes | % | ±% | |
|---|---|---|---|---|---|
| Labor | Ernest Duus | 19,613 | 42.9 | +0.1 | |
| Country | George Rankin | 15,780 | 34.5 | −10.4 | |
| Liberal | Joseph Hall | 10,323 | 22.6 | +22.6 | |
| Total formal votes | 45,716 | 98.6 | |||
| Informal votes | 664 | 1.4 | |||
| Turnout | 46,380 | 95.4 | |||
| Two-party-preferred result | |||||
| Country | George Rankin | 25,172 | 55.1 | +2.8 | |
| Labor | Ernest Duus | 20,544 | 44.9 | −2.8 | |
| Country hold | Swing | +2.8 | |||
Bourke
- This section is an excerpt from Electoral results for the Division of Bourke § 1946
| Party | Candidate | Votes | % | ±% | |
|---|---|---|---|---|---|
| Labor | Bill Bryson | 30,620 | 45.4 | +7.7 | |
| Independent Labor | Doris Blackburn | 18,625 | 27.6 | +27.6 | |
| Liberal | Russell Stokes | 16,889 | 25.0 | +6.7 | |
| Services | Henry Brand | 1,333 | 2.0 | +2.0 | |
| Total formal votes | 67,467 | 96.6 | |||
| Informal votes | 2,342 | 3.4 | |||
| Turnout | 69,809 | 93.3 | |||
| Two-party-preferred result | |||||
| Independent Labor | Doris Blackburn | 34,478 | 51.1 | +4.7 | |
| Labor | Bill Bryson | 32,989 | 48.9 | −4.7 | |
| Independent Labor gain from Labor | Swing | +4.7 | |||
Corangamite
- This section is an excerpt from Electoral results for the Division of Corangamite § 1946
| Party | Candidate | Votes | % | ±% | |
|---|---|---|---|---|---|
| Liberal | Allan McDonald | 25,999 | 54.9 | +7.7 | |
| Labor | Henry Stacpoole | 21,317 | 45.1 | +0.0 | |
| Total formal votes | 47,316 | 99.2 | |||
| Informal votes | 393 | 0.8 | |||
| Turnout | 47,709 | 94.7 | |||
| Liberal hold | Swing | +1.8 | |||
Corio
- This section is an excerpt from Electoral results for the Division of Corio § 1946
| Party | Candidate | Votes | % | ±% | |
|---|---|---|---|---|---|
| Labor | John Dedman | 34,330 | 56.4 | +4.1 | |
| Liberal | Frederick Wallace | 25,546 | 42.0 | +24.5 | |
| Independent | Winifred West | 968 | 1.6 | +1.6 | |
| Total formal votes | 60,844 | 98.6 | |||
| Informal votes | 838 | 1.4 | |||
| Turnout | 61,682 | 94.6 | |||
| Two-party-preferred result | |||||
| Labor | John Dedman | 57.2 | +2.4 | ||
| Liberal | Frederick Wallace | 42.8 | +42.8 | ||
| Labor hold | Swing | +2.4 | |||
Deakin
- This section is an excerpt from Electoral results for the Division of Deakin § 1946
| Party | Candidate | Votes | % | ±% | |
|---|---|---|---|---|---|
| Liberal | William Hutchinson | 36,262 | 56.7 | +24.0 | |
| Labor | Arthur Smith | 27,710 | 43.3 | +5.6 | |
| Total formal votes | 63,972 | 98.5 | |||
| Informal votes | 1,002 | 1.5 | |||
| Turnout | 64,974 | 93.7 | |||
| Liberal hold | Swing | +0.0 | |||
Fawkner
- This section is an excerpt from Electoral results for the Division of Fawkner § 1946
| Party | Candidate | Votes | % | ±% | |
|---|---|---|---|---|---|
| Liberal | Harold Holt | 39,047 | 53.5 | +20.1 | |
| Labor | Bill Bourke | 30,835 | 42.2 | +9.4 | |
| Independent | Mascotte Brown | 2,121 | 2.9 | +2.9 | |
| Services | Harold Rettig | 1,042 | 1.4 | +1.4 | |
| Total formal votes | 73,045 | 97.1 | |||
| Informal votes | 2,155 | 2.9 | |||
| Turnout | 75,200 | 89.5 | |||
| Two-party-preferred result | |||||
| Liberal | Harold Holt | 56.2 | -1.8 | ||
| Labor | Bill Bourke | 43.8 | +1.8 | ||
| Liberal hold | Swing | -1.8 | |||
Flinders
- This section is an excerpt from Electoral results for the Division of Flinders § 1946
| Party | Candidate | Votes | % | ±% | |
|---|---|---|---|---|---|
| Liberal | Rupert Ryan | 36,615 | 54.4 | +17.6 | |
| Labor | Frank Lee | 30,698 | 45.6 | +6.0 | |
| Total formal votes | 67,313 | 98.4 | |||
| Informal votes | 1,087 | 1.6 | |||
| Turnout | 68,400 | 93.5 | |||
| Liberal hold | Swing | +2.6 | |||
Gippsland
- This section is an excerpt from Electoral results for the Division of Gippsland § 1946
| Party | Candidate | Votes | % | ±% | |
|---|---|---|---|---|---|
| Country | George Bowden | 28,526 | 55.2 | +18.7 | |
| Labor | Adam Keltie | 20,196 | 39.1 | -6.0 | |
| Communist | Wally Williames | 2,994 | 5.8 | +5.8 | |
| Total formal votes | 51,716 | 98.4 | |||
| Informal votes | 824 | 1.6 | |||
| Turnout | 52,540 | 94.6 | |||
| Two-party-preferred result | |||||
| Country | George Bowden | 55.8 | +3.4 | ||
| Labor | Adam Keltie | 44.2 | -3.4 | ||
| Country hold | Swing | +3.4 | |||
Henty
- This section is an excerpt from Electoral results for the Division of Henty § 1946
| Party | Candidate | Votes | % | ±% | |
|---|---|---|---|---|---|
| Liberal | Jo Gullett | 41,069 | 52.1 | +14.0 | |
| Labor | Val Doube | 37,785 | 47.9 | +47.9 | |
| Total formal votes | 78,854 | 98.5 | |||
| Informal votes | 1,196 | 1.5 | |||
| Turnout | 80,050 | 95.0 | |||
| Liberal hold | Swing | +14.0 | |||
| Party | Candidate | Votes | % | ±% | |
|---|---|---|---|---|---|
| Liberal | Jo Gullett | 38,718 | 54.3 | +16.2 | |
| Labor | Val Doube | 32,556 | 45.7 | +45.7 | |
| Total formal votes | 71,274 | 98.5 | |||
| Informal votes | 1,086 | 1.5 | |||
| Turnout | 72,360 | 89.5 | |||
| Liberal gain from Independent | Swing | +9.8 | |||
Indi
- This section is an excerpt from Electoral results for the Division of Indi § 1946
| Party | Candidate | Votes | % | ±% | |
|---|---|---|---|---|---|
| Country | John McEwen | 33,634 | 65.9 | +7.1 | |
| Independent Country | John Chanter | 17,406 | 34.1 | +34.1 | |
| Total formal votes | 51,040 | 98.1 | |||
| Informal votes | 1,005 | 1.9 | |||
| Turnout | 52,045 | 92.9 | |||
| Country hold | Swing | +6.7 | |||
Kooyong
- This section is an excerpt from Electoral results for the Division of Kooyong § 1946
| Party | Candidate | Votes | % | ±% | |
|---|---|---|---|---|---|
| Liberal | Robert Menzies | 49,298 | 61.7 | +13.1 | |
| Labor | Albert Nicholls | 25,494 | 31.9 | +5.2 | |
| Communist | Ted Laurie | 5,134 | 6.4 | −1.8 | |
| Total formal votes | 79,926 | 98.4 | |||
| Informal votes | 1,299 | 1.6 | |||
| Turnout | 81,225 | 93.7 | |||
| Two-party-preferred result | |||||
| Liberal | Robert Menzies | 63.3 | +0.8 | ||
| Labor | Albert Nicholls | 36.7 | −0.8 | ||
| Liberal hold | Swing | +0.8 | |||
Maribyrnong
- This section is an excerpt from Electoral results for the Division of Maribyrnong § 1946
| Party | Candidate | Votes | % | ±% | |
|---|---|---|---|---|---|
| Labor | Arthur Drakeford | 48,424 | 65.8 | -1.8 | |
| Liberal | Adrian Cole | 25,155 | 34.2 | +34.2 | |
| Total formal votes | 73,579 | 98.3 | |||
| Informal votes | 1,297 | 1.7 | |||
| Turnout | 74,876 | 95.7 | |||
| Labor hold | Swing | -8.7 | |||
Melbourne
- This section is an excerpt from Electoral results for the Division of Melbourne § 1946
| Party | Candidate | Votes | % | ±% | |
|---|---|---|---|---|---|
| Labor | Arthur Calwell | 42,922 | 73.4 | +9.6 | |
| Liberal | Reg Cooper | 15,572 | 26.6 | +9.2 | |
| Total formal votes | 58,494 | 96.3 | |||
| Informal votes | 2,235 | 3.7 | |||
| Turnout | 60,729 | 89.9 | |||
| Labor hold | Swing | -1.8 | |||
Melbourne Ports
- This section is an excerpt from Electoral results for the Division of Melbourne Ports § 1946
| Party | Candidate | Votes | % | ±% | |
|---|---|---|---|---|---|
| Labor | Jack Holloway | 43,905 | 66.7 | -6.1 | |
| Liberal | Douglas Dennis | 21,884 | 33.3 | +6.1 | |
| Total formal votes | 65,789 | 97.5 | |||
| Informal votes | 1,705 | 2.5 | |||
| Turnout | 67,494 | 92.2 | |||
| Labor hold | Swing | -6.1 | |||
Wannon
- This section is an excerpt from Electoral results for the Division of Wannon § 1946
| Party | Candidate | Votes | % | ±% | |
|---|---|---|---|---|---|
| Labor | Don McLeod | 24,387 | 47.3 | -4.1 | |
| Liberal | Dan Mackinnon | 15,262 | 29.6 | +11.0 | |
| Country | Leonard Rodda | 11,955 | 23.1 | +1.5 | |
| Total formal votes | 51,604 | 98.9 | |||
| Informal votes | 551 | 1.1 | |||
| Turnout | 52,155 | 96.9 | |||
| Two-party-preferred result | |||||
| Labor | Don McLeod | 26,409 | 51.2 | -2.9 | |
| Liberal | Dan Mackinnon | 25,195 | 48.8 | +2.9 | |
| Labor hold | Swing | -2.9 | |||
Wimmera
- This section is an excerpt from Electoral results for the Division of Wimmera § 1946
| Party | Candidate | Votes | % | ±% | |
|---|---|---|---|---|---|
| Country | Winton Turnbull | 26,551 | 62.1 | +3.1 | |
| Labor | Alfred Loveridge | 16,216 | 37.9 | +37.9 | |
| Total formal votes | 42,767 | 98.6 | |||
| Informal votes | 601 | 1.4 | |||
| Turnout | 43,368 | 94.1 | |||
| Country hold | Swing | +3.1 | |||
| Party | Candidate | Votes | % | ±% | |
|---|---|---|---|---|---|
| Country | Winton Turnbull | 15,284 | 43.1 | +43.1 | |
| Country | Anthony Everett | 6,724 | 19.0 | +19.0 | |
| Independent Country | James Stoddart | 6,361 | 17.9 | +17.9 | |
| Independent Labor | John Smith | 2,923 | 8.2 | +8.2 | |
| Independent | Arnold Eberle | 2,042 | 5.8 | +5.8 | |
| Independent Labor | Frederick Arlington-Burke | 1,824 | 5.1 | +5.1 | |
| Independent | Louis Phillips | 312 | 0.9 | +0.9 | |
| Total formal votes | 35,470 | 95.5 | |||
| Informal votes | 1,692 | 4.5 | |||
| Turnout | 37,162 | 82.9 | |||
| Two-party-preferred result | |||||
| Country | Winton Turnbull | 20,924 | 59.0 | +59.0 | |
| Country | Anthony Everett | 14,546 | 41.0 | +41.0 | |
| Country gain from Independent | Swing | +59.0 | |||
Yarra
- This section is an excerpt from Electoral results for the Division of Yarra § 1946
| Party | Candidate | Votes | % | ±% | |
|---|---|---|---|---|---|
| Labor | James Scullin | 39,880 | 63.7 | +3.3 | |
| Liberal | Kenneth Bisney | 18,934 | 30.2 | +11.6 | |
| Communist | Ken Miller | 3,838 | 6.1 | -4.7 | |
| Total formal votes | 62,652 | 96.6 | |||
| Informal votes | 2,221 | 3.4 | |||
| Turnout | 64,873 | 93.1 | |||
| Two-party-preferred result | |||||
| Labor | James Scullin | 69.3 | -5.0 | ||
| Liberal | Kenneth Bisney | 30.7 | +5.0 | ||
| Labor hold | Swing | -5.0 | |||
Queensland
| ||||||||||||||||||||||||||||
All 10 Queensland seats in the House of Representatives 5 seats needed for a majority | ||||||||||||||||||||||||||||
|---|---|---|---|---|---|---|---|---|---|---|---|---|---|---|---|---|---|---|---|---|---|---|---|---|---|---|---|---|
| ||||||||||||||||||||||||||||
Brisbane
- This section is an excerpt from Electoral results for the Division of Brisbane § 1946
| Party | Candidate | Votes | % | ±% | |
|---|---|---|---|---|---|
| Labor | George Lawson | 33,763 | 54.6 | +3.7 | |
| Liberal | Geoffrey Ward | 22,314 | 36.1 | +18.1 | |
| Services | Gordon Olive | 5,806 | 9.4 | +9.4 | |
| Total formal votes | 61,883 | 96.7 | |||
| Informal votes | 2,086 | 3.3 | |||
| Turnout | 63,969 | 92.2 | |||
| Two-party-preferred result | |||||
| Labor | George Lawson | 57.0 | +3.4 | ||
| Liberal | Geoffrey Ward | 43.0 | +43.0 | ||
| Labor hold | Swing | +3.4 | |||
Capricornia
- This section is an excerpt from Electoral results for the Division of Capricornia § 1946
| Party | Candidate | Votes | % | ±% | |
|---|---|---|---|---|---|
| National | Charles Davidson | 28,999 | 49.9 | +5.8 | |
| Labor | Frank Forde | 26,611 | 45.8 | −10.1 | |
| Services | Andrew Taylor | 2,454 | 4.2 | +4.2 | |
| Total formal votes | 58,064 | 98.2 | |||
| Informal votes | 1,094 | 1.8 | |||
| Turnout | 59,158 | 94.1 | |||
| Two-party-preferred result | |||||
| National | Charles Davidson | 30,731 | 52.9 | +8.8 | |
| Labor | Frank Forde | 27,333 | 47.1 | −8.8 | |
| National gain from Labor | Swing | +8.8 | |||
Darling Downs
- This section is an excerpt from Electoral results for the Division of Darling Downs § 1946
| Party | Candidate | Votes | % | ±% | |
|---|---|---|---|---|---|
| Country | Arthur Fadden | 31,550 | 59.9 | +11.3 | |
| Labor | William English | 17,902 | 34.0 | -9.3 | |
| Services | Maxwell Owen | 3,209 | 6.1 | +6.1 | |
| Total formal votes | 52,661 | 98.3 | |||
| Informal votes | 901 | 1.7 | |||
| Turnout | 53,562 | 96.2 | |||
| Two-party-preferred result | |||||
| Country | Arthur Fadden | 61.9 | +9.4 | ||
| Labor | William English | 38.1 | -9.4 | ||
| Country hold | Swing | +9.4 | |||
Griffith
- This section is an excerpt from Electoral results for the Division of Griffith § 1946
| Party | Candidate | Votes | % | ±% | |
|---|---|---|---|---|---|
| Labor | William Conelan | 33,725 | 50.1 | -7.3 | |
| Liberal | William Scott | 25,960 | 38.6 | +9.4 | |
| Services | Arthur Chresby | 7,565 | 11.2 | +11.2 | |
| Total formal votes | 67,260 | 96.4 | |||
| Informal votes | 2,518 | 3.6 | |||
| Turnout | 69,778 | 94.8 | |||
| Two-party-preferred result | |||||
| Labor | William Conelan | 53.9 | -11.2 | ||
| Liberal | William Scott | 46.1 | +11.2 | ||
| Labor hold | Swing | -11.2 | |||
Herbert
- This section is an excerpt from Electoral results for the Division of Herbert § 1946
| Party | Candidate | Votes | % | ±% | |
|---|---|---|---|---|---|
| Labor | Bill Edmonds | 28,246 | 46.0 | +8.4 | |
| Country | Lloyd Roberts | 20,804 | 33.9 | +11.2 | |
| Communist | Jack Henry | 9,404 | 15.3 | -18.9 | |
| Independent | Joseph Pollard | 1,668 | 2.7 | +2.7 | |
| Services | Alexander McNamee | 1,236 | 2.0 | +2.0 | |
| Total formal votes | 61,358 | 95.3 | |||
| Informal votes | 3,050 | 4.7 | |||
| Turnout | 64,408 | 90.5 | |||
| Two-party-preferred result | |||||
| Labor | Bill Edmonds | 37,026 | 60.3 | -1.4 | |
| Country | Lloyd Roberts | 24,332 | 39.7 | +39.7 | |
| Labor hold | Swing | -1.4 | |||
Kennedy
- This section is an excerpt from Electoral results for the Division of Kennedy § 1946
| Party | Candidate | Votes | % | ±% | |
|---|---|---|---|---|---|
| Labor | Bill Riordan | 25,404 | 57.5 | -7.7 | |
| Country | Clement Cummings | 18,769 | 42.5 | +18.7 | |
| Total formal votes | 44,173 | 97.5 | |||
| Informal votes | 1,120 | 2.5 | |||
| Turnout | 45,293 | 84.0 | |||
| Labor hold | Swing | -14.2 | |||
Lilley
- This section is an excerpt from Electoral results for the Division of Lilley § 1946
| Party | Candidate | Votes | % | ±% | |
|---|---|---|---|---|---|
| Labor | Jim Hadley | 32,780 | 45.8 | +0.1 | |
| Liberal | Charles Wilson | 31,072 | 43.4 | -2.4 | |
| Services | George Mocatta | 7,776 | 10.9 | +10.9 | |
| Total formal votes | 71,628 | 97.0 | |||
| Informal votes | 2,216 | 3.0 | |||
| Turnout | 73,844 | 95.9 | |||
| Two-party-preferred result | |||||
| Labor | Jim Hadley | 36,350 | 50.7 | +0.4 | |
| Liberal | Charles Wilson | 35,278 | 49.3 | -0.4 | |
| Labor hold | Swing | +0.4 | |||
Maranoa
- This section is an excerpt from Electoral results for the Division of Maranoa § 1946
| Party | Candidate | Votes | % | ±% | |
|---|---|---|---|---|---|
| Country | Charles Adermann | 29,547 | 58.0 | +7.0 | |
| Labor | John Dufficy | 18,934 | 37.2 | -11.8 | |
| Services | John Walker | 2,441 | 4.8 | +4.8 | |
| Total formal votes | 50,922 | 98.2 | |||
| Informal votes | 909 | 1.8 | |||
| Turnout | 51,831 | 89.6 | |||
| Two-party-preferred result | |||||
| Country | Charles Adermann | 61.6 | +10.6 | ||
| Labor | John Dufficy | 38.4 | -10.6 | ||
| Country hold | Swing | +10.6 | |||
Moreton
- This section is an excerpt from Electoral results for the Division of Moreton § 1946
| Party | Candidate | Votes | % | ±% | |
|---|---|---|---|---|---|
| Liberal | Josiah Francis | 42,521 | 60.4 | +10.4 | |
| Labor | Jack Perrett | 22,934 | 32.6 | -8.4 | |
| Services | Charles McCormack | 4,985 | 7.1 | +7.1 | |
| Total formal votes | 70,440 | 97.7 | |||
| Informal votes | 1,690 | 2.3 | |||
| Turnout | 72,130 | 94.2 | |||
| Two-party-preferred result | |||||
| Liberal | Josiah Francis | 65.7 | +9.0 | ||
| Labor | Jack Perrett | 34.3 | -9.0 | ||
| Liberal hold | Swing | +9.0 | |||
Wide Bay
- This section is an excerpt from Electoral results for the Division of Wide Bay § 1946
| Party | Candidate | Votes | % | ±% | |
|---|---|---|---|---|---|
| Country | Bernard Corser | 31,027 | 54.3 | +1.5 | |
| Labor | George Watson | 16,071 | 28.1 | -6.6 | |
| Services | Eric Paterson | 7,866 | 13.8 | +13.8 | |
| Communist | Max Julius | 2,142 | 3.8 | +3.8 | |
| Total formal votes | 57,106 | 98.1 | |||
| Informal votes | 1,091 | 1.9 | |||
| Turnout | 58,197 | 93.4 | |||
| Two-party-preferred result | |||||
| Country | Bernard Corser | 65.1 | +8.6 | ||
| Labor | George Watson | 34.9 | -8.6 | ||
| Country hold | Swing | +8.6 | |||
South Australia
| ||||||||||||||||||||||||||||
All 6 SA seats in the House of Representatives 3 seats needed for a majority | ||||||||||||||||||||||||||||
|---|---|---|---|---|---|---|---|---|---|---|---|---|---|---|---|---|---|---|---|---|---|---|---|---|---|---|---|---|
| ||||||||||||||||||||||||||||
Adelaide
- This section is an excerpt from Electoral results for the Division of Adelaide § 1946
| Party | Candidate | Votes | % | ±% | |
|---|---|---|---|---|---|
| Labor | Cyril Chambers | 40,638 | 59.9 | −0.1 | |
| Liberal | Ian Hayward | 24,238 | 35.7 | +1.9 | |
| Communist | Alf Watt | 2,986 | 4.4 | +0.1 | |
| Total formal votes | 67,862 | 96.0 | |||
| Informal votes | 2,805 | 4.0 | |||
| Turnout | 70,667 | 93.3 | |||
| Two-party-preferred result | |||||
| Labor | Cyril Chambers | 63.9 | −1.7 | ||
| Liberal | Ian Hayward | 36.1 | +1.7 | ||
| Labor hold | Swing | −1.7 | |||
Barker
- This section is an excerpt from Electoral results for the Division of Barker § 1946
| Party | Candidate | Votes | % | ±% | |
|---|---|---|---|---|---|
| Liberal | Archie Cameron | 34,619 | 54.0 | +13.4 | |
| Labor | Harry Krantz | 26,500 | 41.3 | +1.3 | |
| Independent | David Eddy | 2,992 | 4.7 | +4.7 | |
| Total formal votes | 64,111 | 97.3 | |||
| Informal votes | 1,781 | 2.7 | |||
| Turnout | 65,892 | 95.9 | |||
| Two-party-preferred result | |||||
| Liberal | Archie Cameron | 56.4 | −4.7 | ||
| Labor | Harry Krantz | 43.6 | +4.7 | ||
| Liberal hold | Swing | +4.7 | |||
Boothby
- This section is an excerpt from Electoral results for the Division of Boothby § 1946
| Party | Candidate | Votes | % | ±% | |
|---|---|---|---|---|---|
| Labor | Thomas Sheehy | 39,724 | 51.8 | +9.5 | |
| Liberal | Keith Wilson | 36,941 | 48.2 | +3.2 | |
| Total formal votes | 76,665 | 97.2 | |||
| Informal votes | 2,169 | 2.8 | |||
| Turnout | 78,834 | 95.7 | |||
| Labor hold | Swing | +0.9 | |||
Grey
- This section is an excerpt from Electoral results for the Division of Grey § 1946
| Party | Candidate | Votes | % | ±% | |
|---|---|---|---|---|---|
| Labor | Edgar Russell | 27,479 | 55.5 | +3.0 | |
| Liberal | Oliver Badman | 22,016 | 44.5 | -3.0 | |
| Total formal votes | 49,495 | 97.8 | |||
| Informal votes | 1,128 | 2.2 | |||
| Turnout | 50,623 | 95.2 | |||
| Labor hold | Swing | +3.0 | |||
Hindmarsh
- This section is an excerpt from Electoral results for the Division of Hindmarsh § 1946
| Party | Candidate | Votes | % | ±% | |
|---|---|---|---|---|---|
| Labor | Albert Thompson | 52,475 | 68.4 | -8.4 | |
| Liberal | William Palmer | 16,462 | 21.5 | -1.7 | |
| Communist | Alan Finger | 7,731 | 10.1 | +10.1 | |
| Total formal votes | 76,668 | 96.3 | |||
| Informal votes | 2,931 | 3.7 | |||
| Turnout | 79,599 | 95.2 | |||
| Two-party-preferred result | |||||
| Labor | Albert Thompson | 76.5 | -0.3 | ||
| Liberal | William Palmer | 23.5 | +0.3 | ||
| Labor hold | Swing | -0.3 | |||
Wakefield
- This section is an excerpt from Electoral results for the Division of Wakefield § 1946
| Party | Candidate | Votes | % | ±% | |
|---|---|---|---|---|---|
| Liberal | Philip McBride | 26,894 | 51.5 | +2.7 | |
| Labor | Albert Smith | 24,046 | 46.1 | -5.1 | |
| Independent | Frank Rieck | 1,260 | 2.4 | +2.4 | |
| Total formal votes | 52,200 | 97.2 | |||
| Informal votes | 1,486 | 2.8 | |||
| Turnout | 53,686 | 94.7 | |||
| Two-party-preferred result | |||||
| Liberal | Philip McBride | 52.7 | +3.9 | ||
| Labor | Albert Smith | 47.3 | -3.9 | ||
| Liberal gain from Labor | Swing | +3.9 | |||
Western Australia
| ||||||||||||||||||||||||||||
All 5 WA seats in the House of Representatives 3 seats needed for a majority | ||||||||||||||||||||||||||||
|---|---|---|---|---|---|---|---|---|---|---|---|---|---|---|---|---|---|---|---|---|---|---|---|---|---|---|---|---|
| ||||||||||||||||||||||||||||
Forrest
- This section is an excerpt from Electoral results for the Division of Forrest § 1946
| Party | Candidate | Votes | % | ±% | |
|---|---|---|---|---|---|
| Labor | Nelson Lemmon | 23,944 | 50.1 | -2.8 | |
| Liberal | James Cumming | 13,349 | 28.0 | +28.0 | |
| Country | Jasper Norton | 10,466 | 21.9 | -12.4 | |
| Total formal votes | 47,759 | 97.8 | |||
| Informal votes | 1,064 | 2.2 | |||
| Turnout | 48,823 | 94.5 | |||
| Two-party-preferred result | |||||
| Labor | Nelson Lemmon | 52.3 | -6.1 | ||
| Liberal | James Cumming | 47.7 | +47.7 | ||
| Labor hold | Swing | -6.1 | |||
Fremantle
- This section is an excerpt from Electoral results for the Division of Fremantle § 1946
| Party | Candidate | Votes | % | ±% | |
|---|---|---|---|---|---|
| Labor | Kim Beazley Sr. | 45,383 | 64.1 | -2.8 | |
| Liberal | Claude Henderson | 25,428 | 35.9 | +22.0 | |
| Total formal votes | 70,811 | 97.4 | |||
| Informal votes | 1,908 | 2.6 | |||
| Turnout | 72,719 | 94.1 | |||
| Labor hold | Swing | -5.0 | |||
Kalgoorlie
- This section is an excerpt from Electoral results for the Division of Kalgoorlie § 1946
| Party | Candidate | Votes | % | ±% | |
|---|---|---|---|---|---|
| Labor | Herbert Johnson | 22,655 | 68.0 | +0.4 | |
| Liberal | Seddon Vincent | 10,646 | 32.0 | -9.6 | |
| Total formal votes | 33,301 | 97.8 | |||
| Informal votes | 749 | 2.2 | |||
| Turnout | 34,050 | 90.0 | |||
| Labor hold | Swing | -7.4 | |||
Perth
- This section is an excerpt from Electoral results for the Division of Perth § 1946
| Party | Candidate | Votes | % | ±% | |
|---|---|---|---|---|---|
| Labor | Tom Burke | 31,231 | 49.0 | +6.7 | |
| Liberal | Jim Paton | 27,429 | 43.1 | +13.7 | |
| Services | John Graham | 2,167 | 3.4 | +3.4 | |
| Communist | Kevin Healy | 2,004 | 3.1 | -3.0 | |
| Independent | Robert Salter | 889 | 1.4 | +1.4 | |
| Total formal votes | 63,710 | 95.8 | |||
| Informal votes | 2,820 | 4.2 | |||
| Turnout | 66,530 | 92.6 | |||
| Two-party-preferred result | |||||
| Labor | Tom Burke | 52.4 | -3.6 | ||
| Liberal | Jim Paton | 47.6 | +3.6 | ||
| Labor hold | Swing | -3.6 | |||
Swan
- This section is an excerpt from Electoral results for the Division of Swan § 1946
| Party | Candidate | Votes | % | ±% | |
|---|---|---|---|---|---|
| Labor | Don Mountjoy | 25,260 | 45.6 | -4.5 | |
| Country | Len Hamilton | 17,223 | 31.1 | -15.2 | |
| Independent | Bill Grayden | 12,856 | 23.2 | +23.2 | |
| Total formal votes | 55,339 | 97.2 | |||
| Informal votes | 1,605 | 2.8 | |||
| Turnout | 56,944 | 92.2 | |||
| Two-party-preferred result | |||||
| Country | Len Hamilton | 27,790 | 50.2 | +50.2 | |
| Labor | Don Mountjoy | 27,549 | 49.8 | -3.2 | |
| Country gain from Labor | Swing | +3.2 | |||
Tasmania
| ||||||||||||||||||||||||||||
All 5 Tasmanian seats in the House of Representatives 3 seats needed for a majority | ||||||||||||||||||||||||||||
|---|---|---|---|---|---|---|---|---|---|---|---|---|---|---|---|---|---|---|---|---|---|---|---|---|---|---|---|---|
| ||||||||||||||||||||||||||||
Bass
- This section is an excerpt from Electoral results for the Division of Bass § 1946
| Party | Candidate | Votes | % | ±% | |
|---|---|---|---|---|---|
| Labor | Claude Barnard | 13,495 | 50.0 | −1.2 | |
| Liberal | Harry Spotswood | 8,219 | 30.4 | +12.8 | |
| Independent | John Orchard | 5,281 | 19.6 | +2.0 | |
| Total formal votes | 26,995 | 98.0 | |||
| Informal votes | 557 | 2.0 | |||
| Turnout | 27,552 | 93.9 | |||
| Two-party-preferred result | |||||
| Labor | Claude Barnard | 15,387 | 57.0 | −0.3 | |
| Liberal | Harry Spotswood | 11,608 | 43.0 | +0.3 | |
| Labor hold | Swing | −0.3 | |||
Darwin
- This section is an excerpt from Electoral results for the Division of Darwin § 1946
| Party | Candidate | Votes | % | ±% | |
|---|---|---|---|---|---|
| Liberal | Dame Enid Lyons | 15,835 | 54.2 | +5.3 | |
| Labor | Harold Kirkpatrick | 13,392 | 45.8 | +3.2 | |
| Total formal votes | 29,227 | 97.6 | |||
| Informal votes | 730 | 2.4 | |||
| Turnout | 29,957 | 92.4 | |||
| Liberal hold | Swing | +2.7 | |||
Denison
- This section is an excerpt from Electoral results for the Division of Denison § 1946
| Party | Candidate | Votes | % | ±% | |
|---|---|---|---|---|---|
| Labor | Frank Gaha | 16,231 | 57.0 | +9.7 | |
| Liberal | Bruce Hamilton | 12,227 | 43.0 | +4.3 | |
| Total formal votes | 28,458 | 97.0 | |||
| Informal votes | 874 | 3.0 | |||
| Turnout | 29,332 | 93.4 | |||
| Labor hold | Swing | -2.0 | |||
Franklin
- This section is an excerpt from Electoral results for the Division of Franklin § 1946
| Party | Candidate | Votes | % | ±% | |
|---|---|---|---|---|---|
| Liberal | Bill Falkinder | 15,678 | 50.1 | +9.0 | |
| Labor | Charles Frost | 15,605 | 49.9 | -9.0 | |
| Total formal votes | 31,283 | 97.3 | |||
| Informal votes | 876 | 2.7 | |||
| Turnout | 32,159 | 94.6 | |||
| Liberal gain from Labor | Swing | +10.0 | |||
Wilmot
- This section is an excerpt from Electoral results for the Division of Wilmot § 1946
| Party | Candidate | Votes | % | ±% | |
|---|---|---|---|---|---|
| Labor | Gil Duthie | 13,032 | 51.7 | +6.1 | |
| Liberal | Allan Guy | 12,177 | 48.3 | -0.9 | |
| Total formal votes | 25,209 | 97.4 | |||
| Informal votes | 671 | 2.6 | |||
| Turnout | 25,880 | 94.6 | |||
| Labor gain from Liberal | Swing | +3.4 | |||
Northern Territory
Northern Territory
- This section is an excerpt from Electoral results for the Division of Northern Territory § 1946
| Party | Candidate | Votes | % | ±% | |
|---|---|---|---|---|---|
| Independent | Adair Blain | 1,281 | 42.4 | +6.9 | |
| Independent Labor | Leigh Wallman | 924 | 30.6 | +30.6 | |
| Labor | Bob Murray | 677 | 22.4 | -5.8 | |
| Independent | Ralph Edwards | 141 | 4.7 | +4.7 | |
| Total formal votes | 3,023 | 99.0 | |||
| Informal votes | 30 | 1.0 | |||
| Turnout | 3,053 | 73.3 | |||
| Two-party-preferred result | |||||
| Independent | Adair Blain | 1,690 | 55.9 | +3.3 | |
| Independent Labor | Leigh Wallman | 1,333 | 44.1 | +44.1 | |
| Independent hold | Swing | +3.3 | |||
See also
- Candidates of the 1946 Australian federal election
- Members of the Australian House of Representatives, 1946–1949
Notes
- ^ Including Northern Territory
References
- ^ "1946 House of Representatives". Psephos Adam Carr's Election Archive. Retrieved 25 May 2022.
- ^ a b "1946 House of Representatives: NSW". Psephos Adam Carr's Election Archive. Retrieved 11 June 2022.
- ^ "1946 House of Representatives: Victoria". Psephos Adam Carr's Election Archive. Retrieved 29 May 2022.
- ^ "1946 House of Representatives: South Australia". Psephos Adam Carr's Election Archive. Retrieved 29 May 2022.
- ^ a b c d e "1946 House of Representatives: Tasmania". Psephos Adam Carr's Election Archive. Retrieved 29 May 2022.
- ^ "1946 House of Representatives: Northern Territory". Psephos Adam Carr's Election Archive. Retrieved 29 May 2022.
| House of Representatives | |||
|---|---|---|---|
| Senate | |||
| By-elections | |||