
This is a list of electoral division results for the Australian 1951 federal election.[1]
Overall
- This section is an excerpt from 1951 Australian federal election § House of Representatives
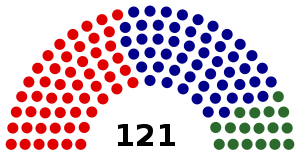
Labor: 52 seats
Liberal: 52 seats
Country: 17 seats
| Party | Votes | % | Swing | Seats | Change | ||
|---|---|---|---|---|---|---|---|
| Liberal–Country coalition | 2,298,512 | 50.34 | +0.08 | 69 | –5 | ||
| Liberal | 1,854,799 | 40.62 | +1.23 | 52 | –3 | ||
| Country | 443,713 | 9.72 | –1.15 | 17 | –2 | ||
| Labor | 2,174,840 | 47.63 | +1.65 | 54[a] | +6 | ||
| Communist | 44,782 | 0.98 | +0.09 | 0 | 0 | ||
| Independents | 47,765 | 1.05 | –1.11 | 0 | –1 | ||
| Total | 4,565,899 | 123 | |||||
| Two-party-preferred (estimated) | |||||||
| Liberal–Country coalition | Win | 50.70 | −0.30 | 69 | −5 | ||
| Labor | 49.30 | +0.30 | 52 | +5 | |||
- Notes
- Three members were elected unopposed – two Labor and one Liberal.
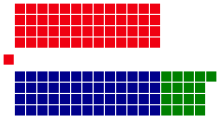
New South Wales
| ||||||||||||||||||||||||||||||||||
All 47 NSW seats in the House of Representatives 24 seats needed for a majority | ||||||||||||||||||||||||||||||||||
|---|---|---|---|---|---|---|---|---|---|---|---|---|---|---|---|---|---|---|---|---|---|---|---|---|---|---|---|---|---|---|---|---|---|---|
| ||||||||||||||||||||||||||||||||||


Banks
- This section is an excerpt from Electoral results for the Division of Banks § 1951
| Party | Candidate | Votes | % | ±% | |
|---|---|---|---|---|---|
| Labor | Eric Costa | 28,219 | 61.7 | +3.4 | |
| Liberal | George Roffey | 17,536 | 38.3 | +1.8 | |
| Total formal votes | 45,755 | 97.6 | |||
| Informal votes | 1,143 | 2.4 | |||
| Turnout | 46,898 | 95.8 | |||
| Labor hold | Swing | −0.5 | |||
Barton
- This section is an excerpt from Electoral results for the Division of Barton § 1951
| Party | Candidate | Votes | % | ±% | |
|---|---|---|---|---|---|
| Labor | Herbert Evatt | 20,949 | 50.3 | −2.9 | |
| Liberal | Nancy Wake | 20,706 | 49.7 | +2.9 | |
| Total formal votes | 41,655 | 98.6 | |||
| Informal votes | 580 | 1.4 | |||
| Turnout | 42,235 | 97.4 | |||
| Labor hold | Swing | −2.9 | |||
Bennelong
- This section is an excerpt from Electoral results for the Division of Bennelong § 1951
| Party | Candidate | Votes | % | ±% | |
|---|---|---|---|---|---|
| Liberal | John Cramer | 24,732 | 61.0 | +1.4 | |
| Labor | William Fitzgibbon | 15,840 | 39.0 | −1.4 | |
| Total formal votes | 40,572 | 98.1 | |||
| Informal votes | 797 | 1.9 | |||
| Turnout | 41,369 | 96.3 | |||
| Liberal hold | Swing | +1.4 | |||
Blaxland
- This section is an excerpt from Electoral results for the Division of Blaxland § 1951
| Party | Candidate | Votes | % | ±% | |
|---|---|---|---|---|---|
| Labor | Jim Harrison | 25,749 | 63.9 | +14.6 | |
| Liberal | Jim Dennison | 14,547 | 36.1 | +12.3 | |
| Total formal votes | 40,296 | 97.5 | |||
| Informal votes | 1,039 | 2.5 | |||
| Turnout | 41,335 | 94.9 | |||
| Labor hold | Swing | +10.5 | |||
Bradfield
- This section is an excerpt from Electoral results for the Division of Bradfield § 1951
| Party | Candidate | Votes | % | ±% | |
|---|---|---|---|---|---|
| Liberal | Billy Hughes | 32,469 | 78.7 | +7.3 | |
| Labor | Hugh Milne | 8,784 | 21.3 | −0.4 | |
| Total formal votes | 41,253 | 98.2 | |||
| Informal votes | 762 | 1.8 | |||
| Turnout | 42,015 | 95.8 | |||
| Liberal hold | Swing | +3.8 | |||
Calare
- This section is an excerpt from Electoral results for the Division of Calare § 1951
| Party | Candidate | Votes | % | ±% | |
|---|---|---|---|---|---|
| Liberal | John Howse | 20,517 | 54.4 | −2.9 | |
| Labor | John Howell | 15,141 | 40.1 | −2.9 | |
| Independent | Archibald Gardiner | 2,067 | 5.5 | +5.5 | |
| Total formal votes | 37,725 | 98.7 | |||
| Informal votes | 497 | 1.3 | |||
| Turnout | 38,204 | 96.5 | |||
| Two-party-preferred result | |||||
| Liberal | John Howse | 56.2 | −0.8 | ||
| Labor | John Howell | 43.8 | +0.8 | ||
| Liberal hold | Swing | −0.8 | |||
Cook
- This section is an excerpt from Electoral results for the Division of Cook (1906–1955) § 1951
| Party | Candidate | Votes | % | ±% | |
|---|---|---|---|---|---|
| Labor | Tom Sheehan | 27,637 | 78.1 | +3.1 | |
| Liberal | Roy Hatfield | 4,790 | 13.5 | −2.8 | |
| Communist | Harry Hatfield | 2,976 | 8.4 | +4.9 | |
| Total formal votes | 35,403 | 97.3 | |||
| Informal votes | 965 | 2.7 | |||
| Turnout | 36,368 | 94.4 | |||
| Two-party-preferred result | |||||
| Labor | Tom Sheehan | 85.7 | +3.6 | ||
| Liberal | Roy Hatfield | 34.3 | −3.6 | ||
| Labor hold | Swing | +3.6 | |||
Cowper
- This section is an excerpt from Electoral results for the Division of Cowper § 1951
| Party | Candidate | Votes | % | ±% | |
|---|---|---|---|---|---|
| Country | Sir Earle Page | 22,632 | 61.0 | −0.7 | |
| Labor | William Bailey | 13,743 | 37.0 | −1.3 | |
| Independent | William Tomlinson | 724 | 2.0 | +2.0 | |
| Total formal votes | 37,099 | 98.9 | |||
| Informal votes | 425 | 1.1 | |||
| Turnout | 37,524 | 96.7 | |||
| Two-party-preferred result | |||||
| Country | Sir Earle Page | 62.0 | +0.3 | ||
| Labor | William Bailey | 38.0 | −0.3 | ||
| Country hold | Swing | +0.3 | |||
Cunningham
- This section is an excerpt from Electoral results for the Division of Cunningham § 1951
| Party | Candidate | Votes | % | ±% | |
|---|---|---|---|---|---|
| Labor | Billy Davies | 24,433 | 61.7 | +1.0 | |
| Liberal | Alan Thomson | 12,674 | 32.0 | +0.3 | |
| Communist | Eric Aarons | 2,466 | 6.2 | −1.4 | |
| Total formal votes | 39,573 | 98.3 | |||
| Informal votes | 691 | 1.7 | |||
| Turnout | 40,264 | 96.1 | |||
| Two-party-preferred result | |||||
| Labor | Billy Davies | 67.7 | −0.5 | ||
| Liberal | Alan Thomson | 32.3 | +0.5 | ||
| Labor hold | Swing | −0.5 | |||
Dalley
- This section is an excerpt from Electoral results for the Division of Dalley § 1951
| Party | Candidate | Votes | % | ±% | |
|---|---|---|---|---|---|
| Labor | Sol Rosevear | 24,851 | 67.1 | −5.9 | |
| Liberal | John Laffin | 12,204 | 32.9 | +5.9 | |
| Total formal votes | 37,055 | 97.7 | |||
| Informal votes | 877 | 2.3 | |||
| Turnout | 37,932 | 96.0 | |||
| Labor hold | Swing | −5.9 | |||
Darling
- This section is an excerpt from Electoral results for the Division of Darling § 1951
| Party | Candidate | Votes | % | ±% | |
|---|---|---|---|---|---|
| Labor | Joe Clark | 22,610 | 68.8 | +5.0 | |
| Country | Elson Whyte | 10,253 | 31.2 | −0.5 | |
| Total formal votes | 32,863 | 97.4 | |||
| Informal votes | 864 | 2.6 | |||
| Turnout | 33,727 | 94.5 | |||
| Labor hold | Swing | +1.5 | |||
East Sydney
- This section is an excerpt from Electoral results for the Division of East Sydney § 1951
| Party | Candidate | Votes | % | ±% | |
|---|---|---|---|---|---|
| Labor | Eddie Ward | 20,379 | 54.9 | -2.1 | |
| Liberal | Allan Stewart | 16,767 | 45.1 | +6.1 | |
| Total formal votes | 37,146 | 97.5 | |||
| Informal votes | 961 | 2.5 | |||
| Turnout | 38,107 | 94.2 | |||
| Labor hold | Swing | -3.1 | |||
Eden-Monaro
- This section is an excerpt from Electoral results for the Division of Eden-Monaro § 1951
| Party | Candidate | Votes | % | ±% | |
|---|---|---|---|---|---|
| Labor | Allan Fraser | 19,574 | 51.0 | +0.1 | |
| Liberal | Bill Keys | 18,832 | 49.0 | -0.1 | |
| Total formal votes | 38,406 | 98.9 | |||
| Informal votes | 419 | 1.1 | |||
| Turnout | 38,825 | 96.7 | |||
| Labor hold | Swing | +0.1 | |||
Evans
- This section is an excerpt from Electoral results for the Division of Evans § 1951
| Party | Candidate | Votes | % | ±% | |
|---|---|---|---|---|---|
| Liberal | Frederick Osborne | 21,936 | 58.6 | +2.0 | |
| Labor | Robert Bailey | 15,467 | 41.4 | -2.0 | |
| Total formal votes | 37,403 | 98.3 | |||
| Informal votes | 666 | 1.7 | |||
| Turnout | 38,069 | 96.3 | |||
| Liberal hold | Swing | +2.0 | |||
Farrer
- This section is an excerpt from Electoral results for the Division of Farrer § 1951
| Party | Candidate | Votes | % | ±% | |
|---|---|---|---|---|---|
| Liberal | David Fairbairn | 21,678 | 56.4 | +18.2 | |
| Labor | Daniel Byrnes | 26,744 | 43.6 | +4.3 | |
| Total formal votes | 38,422 | 98.5 | |||
| Informal votes | 570 | 1.5 | |||
| Turnout | 38,992 | 96.5 | |||
| Liberal hold | Swing | -2.4 | |||
Grayndler
- This section is an excerpt from Electoral results for the Division of Grayndler § 1951
| Party | Candidate | Votes | % | ±% | |
|---|---|---|---|---|---|
| Labor | Fred Daly | 23,038 | 74.9 | +7.8 | |
| Liberal | Roy Squire | 8,398 | 22.4 | -7.2 | |
| Republican | William McCristal | 977 | 2.6 | +1.7 | |
| Total formal votes | 37,413 | 97.7 | |||
| Informal votes | 869 | 2.3 | |||
| Turnout | 38,282 | 96.1 | |||
| Two-party-preferred result | |||||
| Labor | Fred Daly | 76.2 | +6.5 | ||
| Liberal | Roy Squire | 23.8 | -6.5 | ||
| Labor hold | Swing | +6.5 | |||
Gwydir
- This section is an excerpt from Electoral results for the Division of Gwydir § 1951
| Party | Candidate | Votes | % | ±% | |
|---|---|---|---|---|---|
| Country | Thomas Treloar | 19,460 | 53.2 | -1.9 | |
| Labor | Norman Ferguson | 17,147 | 46.8 | +1.9 | |
| Total formal votes | 36,607 | 98.9 | |||
| Informal votes | 408 | 1.1 | |||
| Turnout | 37,015 | 95.5 | |||
| Country hold | Swing | -1.9 | |||
Hume
- This section is an excerpt from Electoral results for the Division of Hume § 1951
| Party | Candidate | Votes | % | ±% | |
|---|---|---|---|---|---|
| Labor | Arthur Fuller | 18,849 | 50.3 | +1.3 | |
| Country | Charles Anderson | 18,622 | 49.7 | −1.3 | |
| Total formal votes | 37,471 | 99.0 | |||
| Informal votes | 374 | 1.0 | |||
| Turnout | 37,845 | 96.2 | |||
| Labor gain from Country | Swing | +1.3 | |||
Hunter
- This section is an excerpt from Electoral results for the Division of Hunter § 1951
| Party | Candidate | Votes | % | ±% | |
|---|---|---|---|---|---|
| Labor | Rowley James | 28,595 | 70.8 | +2.2 | |
| Liberal | Ted Fletcher | 6,810 | 16.9 | -4.9 | |
| Communist | Evan Phillips | 2,927 | 7.2 | -2.4 | |
| Independent | Arthur English | 2,075 | 5.1 | +5.1 | |
| Total formal votes | 40,407 | 97.6 | |||
| Informal votes | 1,007 | 2.4 | |||
| Turnout | 41,414 | 97.1 | |||
| Two-party-preferred result | |||||
| Labor | Rowley James | 78.9 | +1.6 | ||
| Liberal | Ted Fletcher | 21.1 | -1.6 | ||
| Labor hold | Swing | +1.6 | |||
Kingsford Smith
- This section is an excerpt from Electoral results for the Division of Kingsford Smith § 1951
| Party | Candidate | Votes | % | ±% | |
|---|---|---|---|---|---|
| Labor | Gordon Anderson | 18,110 | 50.5 | +0.8 | |
| Liberal | Arthur Butterell | 17,784 | 49.5 | +3.0 | |
| Total formal votes | 35,894 | 98.0 | |||
| Informal votes | 740 | 2.0 | |||
| Turnout | 36,634 | 95.3 | |||
| Labor hold | Swing | -0.4 | |||
Lang
- This section is an excerpt from Electoral results for the Division of Lang § 1951
| Party | Candidate | Votes | % | ±% | |
|---|---|---|---|---|---|
| Labor | Dan Mulcahy | 20,944 | 50.0 | -0.2 | |
| Liberal | Robert Bruce | 18,951 | 45.3 | +0.2 | |
| Communist | Roy Boyd | 1,968 | 4.7 | +0.0 | |
| Total formal votes | 41,863 | 98.3 | |||
| Informal votes | 721 | 1.7 | |||
| Turnout | 42,584 | 97.4 | |||
| Two-party-preferred result | |||||
| Labor | Dan Mulcahy | 53.2 | -1.5 | ||
| Liberal | Robert Bruce | 46.8 | +1.5 | ||
| Labor hold | Swing | -1.5 | |||
Lawson
- This section is an excerpt from Electoral results for the Division of Lawson § 1951
| Party | Candidate | Votes | % | ±% | |
|---|---|---|---|---|---|
| Country | Laurie Failes | 19,819 | 53.0 | +22.0 | |
| Labor | Alan Manning | 17,570 | 47.0 | +4.0 | |
| Total formal votes | 37,389 | 98.4 | |||
| Informal votes | 607 | 1.6 | |||
| Turnout | 37,996 | 96.3 | |||
| Country hold | Swing | -2.8 | |||
Lowe
- This section is an excerpt from Electoral results for the Division of Lowe § 1951
| Party | Candidate | Votes | % | ±% | |
|---|---|---|---|---|---|
| Liberal | William McMahon | 22,276 | 57.8 | +5.1 | |
| Labor | John Burton | 16,250 | 42.2 | +1.3 | |
| Total formal votes | 38,526 | 98.7 | |||
| Informal votes | 521 | 1.3 | |||
| Turnout | 39,047 | 97.0 | |||
| Liberal hold | Swing | -0.7 | |||
Lyne
- This section is an excerpt from Electoral results for the Division of Lyne § 1951
| Party | Candidate | Votes | % | ±% | |
|---|---|---|---|---|---|
| Country | Jim Eggins | 24,971 | 65.5 | −4.0 | |
| Labor | Edward Hayes | 11,381 | 29.9 | +2.3 | |
| Independent | Joe Cordner | 1,745 | 4.6 | +1.7 | |
| Total formal votes | 38,097 | 98.4 | |||
| Informal votes | 615 | 1.6 | |||
| Turnout | 38,712 | 97.0 | |||
| Two-party-preferred result | |||||
| Country | Jim Eggins | 68.8 | +2.8 | ||
| Labor | Edward Hayes | 31.2 | −2.8 | ||
| Country hold | Swing | +2.8 | |||
Macarthur
- This section is an excerpt from Electoral results for the Division of Macarthur § 1951
| Party | Candidate | Votes | % | ±% | |
|---|---|---|---|---|---|
| Liberal | Jeff Bate | 25,835 | 63.8 | -0.8 | |
| Labor | William McDonnell | 14,633 | 36.2 | +0.8 | |
| Total formal votes | 40,468 | 98.5 | |||
| Informal votes | 622 | 1.5 | |||
| Turnout | 41,090 | 96.0 | |||
| Liberal hold | Swing | -0.8 | |||
Mackellar
- This section is an excerpt from Electoral results for the Division of Mackellar § 1951
| Party | Candidate | Votes | % | ±% | |
|---|---|---|---|---|---|
| Liberal | Bill Wentworth | 26,832 | 63.1 | +0.5 | |
| Labor | Thomas Sherley | 15,684 | 36.9 | -0.5 | |
| Total formal votes | 42,516 | 98.8 | |||
| Informal votes | 953 | 2.2 | |||
| Turnout | 43,469 | 95.2 | |||
| Liberal hold | Swing | +0.5 | |||
Macquarie
- This section is an excerpt from Electoral results for the Division of Macquarie § 1951
| Party | Candidate | Votes | % | ±% | |
|---|---|---|---|---|---|
| Labor | Ben Chifley | 23,136 | 61.8 | +4.1 | |
| Liberal | Bob Cotton | 14,325 | 38.2 | -0.6 | |
| Total formal votes | 37,461 | 98.5 | |||
| Informal votes | 555 | 1.5 | |||
| Turnout | 38,016 | 96.9 | |||
| Labor hold | Swing | +0.8 | |||
Martin
- This section is an excerpt from Electoral results for the Division of Martin § 1951
| Party | Candidate | Votes | % | ±% | |
|---|---|---|---|---|---|
| Labor | William O'Connor | 20,362 | 53.9 | +0.4 | |
| Liberal | George Read | 14,132 | 37.4 | -0.4 | |
| Communist | Terry Gordon | 2,379 | 6.3 | +1.5 | |
| Independent | Malinda Ivey | 908 | 2.4 | +2.4 | |
| Total formal votes | 37,781 | 97.5 | |||
| Informal votes | 974 | 2.5 | |||
| Turnout | 38,755 | 96.6 | |||
| Two-party-preferred result | |||||
| Labor | William O'Connor | 60.8 | +1.2 | ||
| Liberal | George Read | 39.2 | -1.2 | ||
| Labor hold | Swing | +1.2 | |||
Mitchell
- This section is an excerpt from Electoral results for the Division of Mitchell § 1951
| Party | Candidate | Votes | % | ±% | |
|---|---|---|---|---|---|
| Liberal | Roy Wheeler | 23,028 | 53.8 | -3.1 | |
| Labor | Joseph White | 17,580 | 41.1 | -2.0 | |
| Communist | Mel McCalman | 2,158 | 5.0 | +5.0 | |
| Total formal votes | 42,766 | 97.8 | |||
| Informal votes | 978 | 2.2 | |||
| Turnout | 43,744 | 95.7 | |||
| Two-party-preferred result | |||||
| Liberal | Roy Wheeler | 55.3 | -1.6 | ||
| Labor | Joseph White | 44.7 | +1.6 | ||
| Liberal hold | Swing | -1.6 | |||
New England
- This section is an excerpt from Electoral results for the Division of New England § 1951
| Party | Candidate | Votes | % | ±% | |
|---|---|---|---|---|---|
| Country | David Drummond | 21,259 | 57.9 | -5.1 | |
| Labor | William Wilson | 15,462 | 42.1 | +5.1 | |
| Total formal votes | 36,721 | 98.7 | |||
| Informal votes | 491 | 1.3 | |||
| Turnout | 37,212 | 96.7 | |||
| Country hold | Swing | -3.3 | |||
Newcastle
- This section is an excerpt from Electoral results for the Division of Newcastle1951
| Party | Candidate | Votes | % | ±% | |
|---|---|---|---|---|---|
| Labor | David Watkins | 23,152 | 60.5 | +4.8 | |
| Liberal | Roy Stewart | 13,485 | 35.2 | -4.7 | |
| Communist | Laurie Aarons | 1,645 | 4.3 | +1.1 | |
| Total formal votes | 38,282 | 98.4 | |||
| Informal votes | 606 | 1.6 | |||
| Turnout | 38,888 | 96.9 | |||
| Two-party-preferred result | |||||
| Labor | David Watkins | 63.4 | +5.1 | ||
| Liberal | Roy Stewart | 36.6 | -5.1 | ||
| Labor hold | Swing | +5.1 | |||
North Sydney
- This section is an excerpt from Electoral results for the Division of North Sydney § 1951
| Party | Candidate | Votes | % | ±% | |
|---|---|---|---|---|---|
| Liberal | William Jack | 22,110 | 58.0 | +7.1 | |
| Labor | Eileen Powell | 15,984 | 42.0 | +0.3 | |
| Total formal votes | 38,094 | 98.3 | |||
| Informal votes | 643 | 1.7 | |||
| Turnout | 38,737 | 96.4 | |||
| Liberal hold | Swing | +4.7 | |||
Parkes
- This section is an excerpt from Electoral results for the Division of Parkes (1901–1969) § 1951
| Party | Candidate | Votes | % | ±% | |
|---|---|---|---|---|---|
| Labor | Les Haylen | 18,964 | 50.9 | -0.9 | |
| Liberal | Dick Dein | 18,283 | 49.1 | +0.9 | |
| Total formal votes | 37,247 | 98.2 | |||
| Informal votes | 676 | 1.8 | |||
| Turnout | 37,923 | 96.1 | |||
| Labor hold | Swing | -0.9 | |||
Parramatta
- This section is an excerpt from Electoral results for the Division of Parramatta § 1951
| Party | Candidate | Votes | % | ±% | |
|---|---|---|---|---|---|
| Liberal | Howard Beale | 26,852 | 63.5 | +0.9 | |
| Labor | John Holmes | 15,422 | 36.5 | -0.9 | |
| Total formal votes | 42,274 | 98.0 | |||
| Informal votes | 855 | 2.0 | |||
| Turnout | 43,129 | 96.2 | |||
| Liberal hold | Swing | +0.9 | |||
Paterson
- This section is an excerpt from Electoral results for the Division of Paterson § 1951
| Party | Candidate | Votes | % | ±% | |
|---|---|---|---|---|---|
| Liberal | Allen Fairhall | 21,677 | 57.1 | +27.0 | |
| Labor | Cecil Robinson | 16,312 | 42.9 | +5.0 | |
| Total formal votes | 37,989 | 98.1 | |||
| Informal votes | 736 | 1.9 | |||
| Turnout | 38,725 | 97.1 | |||
| Liberal hold | Swing | -1.4 | |||
Phillip
- This section is an excerpt from Electoral results for the Division of Phillip § 1951
| Party | Candidate | Votes | % | ±% | |
|---|---|---|---|---|---|
| Labor | Joe Fitzgerald | 19,401 | 53.4 | +2.2 | |
| Liberal | Les Fingleton | 16,913 | 46.6 | +3.7 | |
| Total formal votes | 36,314 | 97.9 | |||
| Informal votes | 779 | 2.1 | |||
| Turnout | 37,093 | 95.4 | |||
| Labor hold | Swing | -2.3 | |||
Reid
- This section is an excerpt from Electoral results for the Division of Reid § 1951
| Party | Candidate | Votes | % | ±% | |
|---|---|---|---|---|---|
| Labor | Charles Morgan | 28,115 | 62.4 | +4.3 | |
| Liberal | Jim Clough | 15,051 | 33.4 | +4.4 | |
| Independent | Rupert Sheldon | 1,903 | 4.2 | +4.2 | |
| Total formal votes | 45,069 | 98.1 | |||
| Informal votes | 895 | 1.9 | |||
| Turnout | 45,964 | 96.2 | |||
| Two-party-preferred result | |||||
| Labor | Charles Morgan | 65.6 | -2.2 | ||
| Liberal | Jim Clough | 34.4 | +2.2 | ||
| Labor hold | Swing | -2.2 | |||
Richmond
- This section is an excerpt from Electoral results for the Division of Richmond § 1951
| Party | Candidate | Votes | % | ±% | |
|---|---|---|---|---|---|
| Country | Larry Anthony | 28,034 | 76.3 | +1.2 | |
| Labor | Alexander Bryen | 8,718 | 23.7 | -1.2 | |
| Total formal votes | 36,752 | 98.7 | |||
| Informal votes | 486 | 1.3 | |||
| Turnout | 37,238 | 96.4 | |||
| Country hold | Swing | +1.2 | |||
Riverina
- This section is an excerpt from Electoral results for the Division of Riverina § 1951
| Party | Candidate | Votes | % | ±% | |
|---|---|---|---|---|---|
| Country | Hugh Roberton | 19,781 | 53.3 | +0.0 | |
| Labor | Michael Sheehan | 15,975 | 43.0 | -2.2 | |
| Communist | Les Kelton | 1,358 | 3.7 | +2.2 | |
| Total formal votes | 37,114 | 98.6 | |||
| Informal votes | 510 | 1.4 | |||
| Turnout | 37,624 | 95.1 | |||
| Two-party-preferred result | |||||
| Country | Hugh Roberton | 54.7 | +1.2 | ||
| Labor | Michael Sheehan | 45.3 | -1.2 | ||
| Country hold | Swing | +1.2 | |||
Robertson
- This section is an excerpt from Electoral results for the Division of Robertson § 1951
| Party | Candidate | Votes | % | ±% | |
|---|---|---|---|---|---|
| Liberal | Roger Dean | 22,804 | 54.0 | -0.2 | |
| Labor | Walter Geraghty | 19,406 | 46.0 | +0.2 | |
| Total formal votes | 42,210 | 98.0 | |||
| Informal votes | 874 | 2.0 | |||
| Turnout | 43,084 | 96.2 | |||
| Liberal hold | Swing | -0.2 | |||
Shortland
- This section is an excerpt from Electoral results for the Division of Shortland § 1951
| Party | Candidate | Votes | % | ±% | |
|---|---|---|---|---|---|
| Labor | Charles Griffiths | 26,708 | 65.0 | +10.6 | |
| Liberal | Arthur Downey | 14,369 | 35.0 | +8.9 | |
| Total formal votes | 41,077 | 98.1 | |||
| Informal votes | 781 | 1.9 | |||
| Turnout | 41,858 | 97.0 | |||
| Labor hold | Swing | +0.9 | |||
St George
- This section is an excerpt from Electoral results for the Division of St George § 1951
| Party | Candidate | Votes | % | ±% | |
|---|---|---|---|---|---|
| Liberal | Bill Graham | 19,890 | 51.6 | -0.4 | |
| Labor | Nelson Lemmon | 18,670 | 48.4 | +0.4 | |
| Total formal votes | 38,560 | 98.3 | |||
| Informal votes | 654 | 1.7 | |||
| Turnout | 39,214 | 97.0 | |||
| Liberal hold | Swing | -0.4 | |||
Warringah
- This section is an excerpt from Electoral results for the Division of Warringah § 1951
| Party | Candidate | Votes | % | ±% | |
|---|---|---|---|---|---|
| Liberal | Francis Bland | 29,362 | 75.7 | +5.4 | |
| Labor | Frank McCullum | 9,417 | 24.3 | +24.3 | |
| Total formal votes | 38,779 | 98.2 | |||
| Informal votes | 691 | 1.8 | |||
| Turnout | 39,470 | 95.4 | |||
| Liberal hold | Swing | +5.4 | |||
Watson
- This section is an excerpt from Electoral results for the Division of Watson (1934–1969) § 1951
| Party | Candidate | Votes | % | ±% | |
|---|---|---|---|---|---|
| Labor | Dan Curtin | 22,510 | 56.7 | +7.3 | |
| Liberal | Donald Clark | 17,158 | 43.3 | +5.0 | |
| Total formal votes | 39,668 | 97.4 | |||
| Informal votes | 1,051 | 2.6 | |||
| Turnout | 40,719 | 95.6 | |||
| Labor hold | Swing | -2.3 | |||
Wentworth
- This section is an excerpt from Electoral results for the Division of Wentworth § 1951
| Party | Candidate | Votes | % | ±% | |
|---|---|---|---|---|---|
| Liberal | Eric Harrison | 28,127 | 75.7 | +0.6 | |
| Labor | Cecil Trevelyan | 9,041 | 24.3 | -0.6 | |
| Total formal votes | 37,168 | 98.4 | |||
| Informal votes | 614 | 1.6 | |||
| Turnout | 37,782 | 95.3 | |||
| Liberal hold | Swing | +0.6 | |||
Werriwa
- This section is an excerpt from Electoral results for the Division of Werriwa § 1951
| Party | Candidate | Votes | % | ±% | |
|---|---|---|---|---|---|
| Labor | Bert Lazzarini | 26,104 | 55.1 | −1.1 | |
| Liberal | Ian Griffith | 21,257 | 44.9 | +1.1 | |
| Total formal votes | 47,361 | 97.7 | |||
| Informal votes | 1,114 | 2.3 | |||
| Turnout | 48,475 | 95.6 | |||
| Labor hold | Swing | −1.1 | |||
West Sydney
- This section is an excerpt from Electoral results for the Division of West Sydney § 1951
| Party | Candidate | Votes | % | ±% | |
|---|---|---|---|---|---|
| Labor | Dan Minogue | 21,123 | 63.4 | +13.6 | |
| Liberal | Basil Mottershead | 8,203 | 24.6 | +4.3 | |
| Communist | Jack Miles | 3,483 | 10.4 | +5.4 | |
| Independent Labor | Clare Peters | 528 | 1.6 | +1.6 | |
| Total formal votes | 33,337 | 96.2 | |||
| Informal votes | 1,300 | 3.8 | |||
| Turnout | 34,637 | 91.9 | |||
| Two-party-preferred result | |||||
| Labor | Dan Minogue | 74.6 | +18.9 | ||
| Liberal | Basil Mottershead | 25.4 | +25.4 | ||
| Labor hold | Swing | +18.9 | |||
Victoria
| ||||||||||||||||||||||||||||||||||
All 33 Victorian seats in the House of Representatives 17 seats needed for a majority | ||||||||||||||||||||||||||||||||||
|---|---|---|---|---|---|---|---|---|---|---|---|---|---|---|---|---|---|---|---|---|---|---|---|---|---|---|---|---|---|---|---|---|---|---|
| ||||||||||||||||||||||||||||||||||
Balaclava
- This section is an excerpt from Electoral results for the Division of Balaclava § 1951
| Party | Candidate | Votes | % | ±% | |
|---|---|---|---|---|---|
| Liberal | Thomas White | 25,578 | 63.3 | −0.6 | |
| Labor | Arthur Lewis | 14,845 | 36.7 | +0.6 | |
| Total formal votes | 40,423 | 98.7 | |||
| Informal votes | 525 | 1.3 | |||
| Turnout | 40,948 | 96.1 | |||
| Liberal hold | Swing | −0.6 | |||
Ballaarat
- This section is an excerpt from Electoral results for the Division of Ballarat § 1951
| Party | Candidate | Votes | % | ±% | |
|---|---|---|---|---|---|
| Labor | Bob Joshua | 20,482 | 51.2 | +1.6 | |
| Liberal | Alan Pittard | 19,517 | 48.8 | −1.6 | |
| Total formal votes | 39,999 | 99.1 | |||
| Informal votes | 356 | 0.9 | |||
| Turnout | 40,355 | 97.2 | |||
| Labor gain from Liberal | Swing | +1.6 | |||
Batman
- This section is an excerpt from Electoral results for the Division of Batman § 1951
| Party | Candidate | Votes | % | ±% | |
|---|---|---|---|---|---|
| Labor | Alan Bird | 23,335 | 60.6 | +2.2 | |
| Liberal | Fred Capp | 15,184 | 39.4 | −2.2 | |
| Total formal votes | 38,519 | 98.3 | |||
| Informal votes | 673 | 1.7 | |||
| Turnout | 39,192 | 95.8 | |||
| Labor hold | Swing | +2.2 | |||
Bendigo
- This section is an excerpt from Electoral results for the Division of Bendigo § 1951
| Party | Candidate | Votes | % | ±% | |
|---|---|---|---|---|---|
| Labor | Percy Clarey | 21,975 | 53.6 | +6.6 | |
| Liberal | Charles Carty-Salmon | 18,997 | 46.4 | −1.3 | |
| Total formal votes | 40,972 | 98.8 | |||
| Informal votes | 509 | 1.2 | |||
| Turnout | 41,481 | 96.8 | |||
| Labor hold | Swing | +3.4 | |||
Burke
- This section is an excerpt from Electoral results for the Division of Burke (1949–1955) § 1951
| Party | Candidate | Votes | % | ±% | |
|---|---|---|---|---|---|
| Labor | Ted Peters | 27,422 | 72.4 | +10.3 | |
| Liberal | Alfred Wall | 10,446 | 27.6 | +2.4 | |
| Total formal votes | 37,868 | 97.8 | |||
| Informal votes | 861 | 2.2 | |||
| Turnout | 38,729 | 96.1 | |||
| Labor hold | Swing | +3.0 | |||
Chisholm
- This section is an excerpt from Electoral results for the Division of Chisholm § 1951
| Party | Candidate | Votes | % | ±% | |
|---|---|---|---|---|---|
| Liberal | Wilfrid Kent Hughes | 27,016 | 65.0 | +0.3 | |
| Labor | Ronald Whiting | 14,563 | 35.0 | +1.9 | |
| Total formal votes | 41,579 | 98.8 | |||
| Informal votes | 501 | 1.2 | |||
| Turnout | 42,080 | 95.7 | |||
| Liberal hold | Swing | +0.1 | |||
Corangamite
- This section is an excerpt from Electoral results for the Division of Corangamite § 1951
| Party | Candidate | Votes | % | ±% | |
|---|---|---|---|---|---|
| Liberal | Allan McDonald | 22,087 | 58.7 | +1.2 | |
| Labor | Angus McLean | 15,535 | 41.3 | +1.7 | |
| Total formal votes | 37,622 | 99.1 | |||
| Informal votes | 357 | 0.9 | |||
| Turnout | 37,979 | 97.0 | |||
| Liberal hold | Swing | −1.3 | |||
Corio
- This section is an excerpt from Electoral results for the Division of Corio § 1951
| Party | Candidate | Votes | % | ±% | |
|---|---|---|---|---|---|
| Liberal | Hubert Opperman | 20,731 | 50.2 | −0.1 | |
| Labor | John Dedman | 20,592 | 49.8 | +0.1 | |
| Total formal votes | 41,323 | 99.1 | |||
| Informal votes | 368 | 0.9 | |||
| Turnout | 41,691 | 96.2 | |||
| Liberal hold | Swing | −0.1 | |||
Darebin
- This section is an excerpt from Electoral results for the Division of Darebin § 1951
| Party | Candidate | Votes | % | ±% | |
|---|---|---|---|---|---|
| Labor | Tom Andrews | 26,412 | 64.4 | +1.7 | |
| Liberal | Gordon Savage | 14,572 | 35.6 | −1.7 | |
| Total formal votes | 40,984 | 98.6 | |||
| Informal votes | 581 | 1.4 | |||
| Turnout | 41,565 | 96.9 | |||
| Labor hold | Swing | +1.7 | |||
Deakin
- This section is an excerpt from Electoral results for the Division of Deakin § 1951
| Party | Candidate | Votes | % | ±% | |
|---|---|---|---|---|---|
| Liberal | Frank Davis | 22,946 | 48.6 | -7.0 | |
| Labor | Gordon Bryant | 21,908 | 46.4 | +2.0 | |
| Independent | Eric Butler | 2,364 | 5.0 | +5.0 | |
| Total formal votes | 47,218 | 98.7 | |||
| Informal votes | 617 | 1.3 | |||
| Turnout | 47,835 | 95.3 | |||
| Two-party-preferred result | |||||
| Liberal | Frank Davis | 24,347 | 51.6 | -4.0 | |
| Labor | Gordon Bryant | 22,871 | 48.4 | +4.0 | |
| Liberal hold | Swing | -4.0 | |||
Fawkner
- This section is an excerpt from Electoral results for the Division of Fawkner § 1951
| Party | Candidate | Votes | % | ±% | |
|---|---|---|---|---|---|
| Labor | Bill Bourke | 20,158 | 51.6 | +1.6 | |
| Liberal | Peter Howson | 18,586 | 47.6 | -2.4 | |
| Independent | Colin Kennedy | 332 | 0.8 | +0.8 | |
| Total formal votes | 39,076 | 98.3 | |||
| Informal votes | 681 | 1.7 | |||
| Turnout | 39,757 | 95.7 | |||
| Two-party-preferred result | |||||
| Labor | Bill Bourke | 52.0 | +2.0 | ||
| Liberal | Peter Howson | 48.0 | -2.0 | ||
| Labor hold | Swing | +2.0 | |||
Flinders
- This section is an excerpt from Electoral results for the Division of Flinders § 1951
| Party | Candidate | Votes | % | ±% | |
|---|---|---|---|---|---|
| Liberal | Rupert Ryan | 22,728 | 54.8 | +0.0 | |
| Labor | Keith Ewert | 17,833 | 43.0 | +13.4 | |
| Independent | Robert Hipwell | 891 | 2.1 | +2.1 | |
| Total formal votes | 41,452 | 98.4 | |||
| Informal votes | 663 | 1.6 | |||
| Turnout | 42,115 | 96.2 | |||
| Two-party-preferred result | |||||
| Liberal | Rupert Ryan | 55.9 | -7.7 | ||
| Labor | Keith Ewert | 44.1 | +7.7 | ||
| Liberal hold | Swing | -7.7 | |||
Gellibrand
- This section is an excerpt from Electoral results for the Division of Gellibrand § 1951
| Party | Candidate | Votes | % | ±% | |
|---|---|---|---|---|---|
| Labor | John Mullens | 25,863 | 64.9 | +13.6 | |
| Liberal | Gordon Trewin | 9,973 | 25.0 | −2.8 | |
| Communist | Alex Dobbin | 4,003 | 10.0 | +6.5 | |
| Total formal votes | 39,839 | 97.8 | |||
| Informal votes | 896 | 2.2 | |||
| Turnout | 40,735 | 96.5 | |||
| Two-party-preferred result | |||||
| Labor | John Mullens | 74.4 | +4.7 | ||
| Liberal | Gordon Trewin | 25.6 | −4.7 | ||
| Labor hold | Swing | +4.7 | |||
Gippsland
- This section is an excerpt from Electoral results for the Division of Gippsland § 1951
| Party | Candidate | Votes | % | ±% | |
|---|---|---|---|---|---|
| Country | George Bowden | 22,799 | 65.1 | -1.6 | |
| Labor | Victor Fitzgerald | 12,247 | 34.9 | +1.6 | |
| Total formal votes | 35,046 | 98.5 | |||
| Informal votes | 521 | 1.5 | |||
| Turnout | 35,567 | 95.9 | |||
| Country hold | Swing | -1.6 | |||
Henty
- This section is an excerpt from Electoral results for the Division of Henty § 1951
| Party | Candidate | Votes | % | ±% | |
|---|---|---|---|---|---|
| Liberal | Jo Gullett | 23,642 | 57.3 | +2.1 | |
| Labor | Percy Treyvaud | 16,814 | 40.8 | -1.9 | |
| Communist | Doris McRae | 781 | 1.9 | +1.9 | |
| Total formal votes | 41,237 | 98.6 | |||
| Informal votes | 584 | 1.4 | |||
| Turnout | 41,821 | 96.4 | |||
| Two-party-preferred result | |||||
| Liberal | Jo Gullett | 57.5 | +2.1 | ||
| Labor | Percy Treyvaud | 42.5 | -2.1 | ||
| Liberal hold | Swing | +2.1 | |||
Higgins
- This section is an excerpt from Electoral results for the Division of Higgins § 1951
| Party | Candidate | Votes | % | ±% | |
|---|---|---|---|---|---|
| Liberal | Harold Holt | 24,217 | 64.4 | −2.4 | |
| Labor | Benjamin Nicholas | 11,490 | 30.5 | −2.7 | |
| Independent | Mary Kent Hughes | 1,925 | 5.1 | +5.1 | |
| Total formal votes | 37,632 | 98.5 | |||
| Informal votes | 584 | 1.5 | |||
| Turnout | 38,216 | 94.2 | |||
| Two-party-preferred result | |||||
| Liberal | Harold Holt | 68.2 | +1.4 | ||
| Labor | Benjamin Nicholas | 31.8 | −1.4 | ||
| Liberal hold | Swing | +1.4 | |||
Higinbotham
- This section is an excerpt from Electoral results for the Division of Higinbotham § 1951
| Party | Candidate | Votes | % | ±% | |
|---|---|---|---|---|---|
| Liberal | Frank Timson | 25,493 | 54.4 | +0.8 | |
| Labor | Geoffrey Sowerbutts | 21,368 | 45.6 | -0.8 | |
| Total formal votes | 46,861 | 98.6 | |||
| Informal votes | 644 | 1.4 | |||
| Turnout | 47,505 | 96.4 | |||
| Liberal hold | Swing | +0.8 | |||
Hoddle
- This section is an excerpt from Electoral results for the Division of Hoddle § 1951
| Party | Candidate | Votes | % | ±% | |
|---|---|---|---|---|---|
| Labor | Jack Cremean | 27,685 | 78.7 | +1.6 | |
| Liberal | Jack Easton | 6,193 | 17.6 | -0.3 | |
| Communist | Leslie Loye | 1,310 | 3.7 | +0.6 | |
| Total formal votes | 35,188 | 96.5 | |||
| Informal votes | 1,276 | 3.5 | |||
| Turnout | 36,464 | 94.4 | |||
| Two-party-preferred result | |||||
| Labor | Jack Cremean | 82.1 | +1.3 | ||
| Liberal | Jack Easton | 17.9 | -1.3 | ||
| Labor hold | Swing | +1.3 | |||
Indi
- This section is an excerpt from Electoral results for the Division of Indi § 1951
| Party | Candidate | Votes | % | ±% | |
|---|---|---|---|---|---|
| Liberal | William Bostock | 22,137 | 58.6 | +25.3 | |
| Labor | Charles Edmondson | 15,623 | 41.4 | +4.7 | |
| Total formal votes | 37,760 | 98.8 | |||
| Informal votes | 445 | 1.2 | |||
| Turnout | 38,205 | 95.5 | |||
| Liberal hold | Swing | −1.1 | |||
Isaacs
- This section is an excerpt from Electoral results for the Division of Isaacs (1949–1969) § 1951
| Party | Candidate | Votes | % | ±% | |
|---|---|---|---|---|---|
| Liberal | William Haworth | 19,548 | 51.5 | -2.5 | |
| Labor | John Bourke | 16,165 | 42.6 | -3.4 | |
| Independent Labor | Sam Goldbloom | 2,224 | 5.9 | +5.9 | |
| Total formal votes | 37,937 | 97.9 | |||
| Informal votes | 818 | 2.1 | |||
| Turnout | 38,755 | 94.6 | |||
| Two-party-preferred result | |||||
| Liberal | William Haworth | 52.1 | -1.9 | ||
| Labor | John Bourke | 47.9 | +1.9 | ||
| Liberal hold | Swing | -1.9 | |||
Kooyong
- This section is an excerpt from Electoral results for the Division of Kooyong § 1951
| Party | Candidate | Votes | % | ±% | |
|---|---|---|---|---|---|
| Liberal | Robert Menzies | 28,174 | 67.4 | +0.3 | |
| Labor | Maurice Sheehy | 11,873 | 28.4 | −4.5 | |
| Communist | Ted Laurie | 1,734 | 4.2 | +4.2 | |
| Total formal votes | 41,781 | 98.8 | |||
| Informal votes | 516 | 1.2 | |||
| Turnout | 42,297 | 96.2 | |||
| Two-party-preferred result | |||||
| Liberal | Robert Menzies | 68.8 | +1.7 | ||
| Labor | Maurice Sheehy | 31.2 | −1.7 | ||
| Liberal hold | Swing | +1.7 | |||
La Trobe
- This section is an excerpt from Electoral results for the Division of La Trobe § 1951
| Party | Candidate | Votes | % | ±% | |
|---|---|---|---|---|---|
| Liberal | Richard Casey | 26,920 | 58.0 | −0.6 | |
| Labor | Bernard Rees | 19,464 | 42.0 | +0.6 | |
| Total formal votes | 46,384 | 98.1 | |||
| Informal votes | 877 | 1.9 | |||
| Turnout | 47,261 | 96.0 | |||
| Liberal hold | Swing | −0.6 | |||
Lalor
- This section is an excerpt from Electoral results for the Division of Lalor § 1951
| Party | Candidate | Votes | % | ±% | |
|---|---|---|---|---|---|
| Labor | Reg Pollard | 23,278 | 54.9 | +3.3 | |
| Liberal | Allen Bateman | 19,103 | 45.1 | −3.3 | |
| Total formal votes | 42,381 | 98.5 | |||
| Informal votes | 635 | 1.5 | |||
| Turnout | 43,016 | 95.2 | |||
| Labor hold | Swing | +3.3 | |||
Mallee
- This section is an excerpt from Electoral results for the Division of Mallee § 1951
| Party | Candidate | Votes | % | ±% | |
|---|---|---|---|---|---|
| Country | Winton Turnbull | 21,784 | 61.7 | −2.9 | |
| Labor | Alfred O'Connor | 13,542 | 38.3 | +2.9 | |
| Total formal votes | 35,326 | 98.5 | |||
| Informal votes | 527 | 1.5 | |||
| Turnout | 35,853 | 97.5 | |||
| Country hold | Swing | −2.9 | |||
Maribyrnong
- This section is an excerpt from Electoral results for the Division of Maribyrnong § 1951
| Party | Candidate | Votes | % | ±% | |
|---|---|---|---|---|---|
| Labor | Arthur Drakeford | 27,963 | 64.3 | +2.4 | |
| Liberal | Stuart Collie | 15,502 | 35.7 | +1.6 | |
| Total formal votes | 43,465 | 98.5 | |||
| Informal votes | 661 | 1.5 | |||
| Turnout | 44,126 | 96.9 | |||
| Labor hold | Swing | +0.3 | |||
McMillan
- This section is an excerpt from Electoral results for the Division of McMillan § 1951
| Party | Candidate | Votes | % | ±% | |
|---|---|---|---|---|---|
| Liberal | Geoffrey Brown | 21,465 | 55.7 | +23.3 | |
| Labor | Horace Hawkins | 15,717 | 40.8 | +2.1 | |
| Communist | Fred Charlesworth | 1,328 | 3.4 | +0.9 | |
| Total formal votes | 38,510 | 98.1 | |||
| Informal votes | 747 | 1.9 | |||
| Turnout | 39,257 | 95.7 | |||
| Two-party-preferred result | |||||
| Liberal | Geoffrey Brown | 56.0 | -0.9 | ||
| Labor | Horace Hawkins | 44.0 | +0.9 | ||
| Liberal hold | Swing | -0.9 | |||
Melbourne
- This section is an excerpt from Electoral results for the Division of Melbourne § 1951
| Party | Candidate | Votes | % | ±% | |
|---|---|---|---|---|---|
| Labor | Arthur Calwell | 23,131 | 63.0 | -1.5 | |
| Liberal | Desmond Byrne | 12,168 | 33.1 | +8.1 | |
| Communist | Gerry O'Day | 1,441 | 3.9 | +0.6 | |
| Total formal votes | 36,740 | 96.5 | |||
| Informal votes | 1,324 | 3.5 | |||
| Turnout | 38,064 | 93.8 | |||
| Two-party-preferred result | |||||
| Labor | Arthur Calwell | 66.6 | -4.3 | ||
| Liberal | Desmond Byrne | 33.4 | +4.3 | ||
| Labor hold | Swing | -4.3 | |||
Melbourne Ports
- This section is an excerpt from Electoral results for the Division of Melbourne Ports § 1951
| Party | Candidate | Votes | % | ±% | |
|---|---|---|---|---|---|
| Labor | Frank Crean | 26,502 | 71.2 | +3.3 | |
| Liberal | Michael Prowse | 10,740 | 28.8 | -3.3 | |
| Total formal votes | 37,242 | 97.8 | |||
| Informal votes | 839 | 2.2 | |||
| Turnout | 38,081 | 94.9 | |||
| Labor hold | Swing | +3.3 | |||
Murray
- This section is an excerpt from Electoral results for the Division of Murray § 1951
| Party | Candidate | Votes | % | ±% | |
|---|---|---|---|---|---|
| Country | John McEwen | 23,248 | 61.0 | -2.5 | |
| Labor | Gordon Anderson | 14,834 | 39.0 | +2.5 | |
| Total formal votes | 38,082 | 98.7 | |||
| Informal votes | 502 | 1.3 | |||
| Turnout | 38,584 | 96.1 | |||
| Country hold | Swing | -2.5 | |||
Wannon
- This section is an excerpt from Electoral results for the Division of Wannon § 1951
| Party | Candidate | Votes | % | ±% | |
|---|---|---|---|---|---|
| Labor | Don McLeod | 18,427 | 51.1 | +4.0 | |
| Liberal | Dan Mackinnon | 17,601 | 48.9 | +12.0 | |
| Total formal votes | 36,028 | 99.2 | |||
| Informal votes | 299 | 0.8 | |||
| Turnout | 36,327 | 97.6 | |||
| Labor gain from Liberal | Swing | +1.9 | |||
Wills
- This section is an excerpt from Electoral results for the Division of Wills § 1951
| Party | Candidate | Votes | % | ±% | |
|---|---|---|---|---|---|
| Labor | Bill Bryson | 21,136 | 48.9 | +4.7 | |
| Liberal | Baden Grafen | 14,461 | 33.5 | -1.8 | |
| Independent Labor | Doris Blackburn | 7,595 | 17.6 | -3.0 | |
| Total formal votes | 43,192 | 98.2 | |||
| Informal votes | 782 | 1.8 | |||
| Turnout | 43,974 | 96.3 | |||
| Two-party-preferred result | |||||
| Labor | Bill Bryson | 26,682 | 61.8 | +3.0 | |
| Liberal | Baden Grafen | 16,510 | 38.2 | -3.0 | |
| Labor hold | Swing | +3.0 | |||
Wimmera
- This section is an excerpt from Electoral results for the Division of Wimmera § 1951
| Party | Candidate | Votes | % | ±% | |
|---|---|---|---|---|---|
| Liberal | William Lawrence | 22,005 | 63.0 | +24.0 | |
| Labor | Cyril Sudholz | 12,932 | 37.0 | +5.3 | |
| Total formal votes | 34,937 | 99.0 | |||
| Informal votes | 358 | 1.0 | |||
| Turnout | 35,295 | 96.9 | |||
| Liberal hold | Swing | -1.9 | |||
Yarra
- This section is an excerpt from Electoral results for the Division of Yarra § 1951
| Party | Candidate | Votes | % | ±% | |
|---|---|---|---|---|---|
| Labor | Stan Keon | 23,039 | 60.1 | +1.3 | |
| Liberal | Kenneth Bisney | 13,668 | 35.7 | -0.2 | |
| Communist | Ken Miller | 1,619 | 4.2 | +1.4 | |
| Total formal votes | 38,326 | 97.7 | |||
| Informal votes | 883 | 2.3 | |||
| Turnout | 39,209 | 95.6 | |||
| Two-party-preferred result | |||||
| Labor | Stan Keon | 63.9 | +1.2 | ||
| Liberal | Kenneth Bisney | 36.1 | -1.2 | ||
| Labor hold | Swing | +1.2 | |||
Queensland
| ||||||||||||||||||||||||||||||||||
All 18 Queensland seats in the House of Representatives 9 seats needed for a majority | ||||||||||||||||||||||||||||||||||
|---|---|---|---|---|---|---|---|---|---|---|---|---|---|---|---|---|---|---|---|---|---|---|---|---|---|---|---|---|---|---|---|---|---|---|
| ||||||||||||||||||||||||||||||||||
Bowman
- This section is an excerpt from Electoral results for the Division of Bowman § 1951
| Party | Candidate | Votes | % | ±% | |
|---|---|---|---|---|---|
| Liberal | Malcolm McColm | 21,410 | 54.1 | +0.7 | |
| Labor | Michael Lyons | 16,637 | 42.0 | −2.9 | |
| Communist | Mabel Hanson | 1,552 | 3.9 | +2.2 | |
| Total formal votes | 39,599 | 97.8 | |||
| Informal votes | 907 | 2.2 | |||
| Turnout | 40,506 | 96.0 | |||
| Two-party-preferred result | |||||
| Liberal | Malcolm McColm | 55.6 | +1.8 | ||
| Labor | Michael Lyons | 44.4 | −1.8 | ||
| Liberal hold | Swing | +1.8 | |||
Brisbane
- This section is an excerpt from Electoral results for the Division of Brisbane § 1951
| Party | Candidate | Votes | % | ±% | |
|---|---|---|---|---|---|
| Labor | George Lawson | 18,588 | 53.6 | +1.3 | |
| Liberal | Donagh McDonagh | 13,883 | 40.0 | −2.3 | |
| Communist | Alby Graham | 2,225 | 6.4 | +1.0 | |
| Total formal votes | 34,696 | 97.5 | |||
| Informal votes | 886 | 2.5 | |||
| Turnout | 35,582 | 93.5 | |||
| Two-party-preferred result | |||||
| Labor | George Lawson | 59.5 | +2.2 | ||
| Liberal | Donagh McDonagh | 40.5 | −2.2 | ||
| Labor hold | Swing | +2.2 | |||
Capricornia
- This section is an excerpt from Electoral results for the Division of Capricornia § 1951
| Party | Candidate | Votes | % | ±% | |
|---|---|---|---|---|---|
| Liberal | Henry Pearce | 17,073 | 51.9 | −0.2 | |
| Labor | Mick Gardner | 15,848 | 48.1 | +1.5 | |
| Total formal votes | 32,921 | 99.0 | |||
| Informal votes | 346 | 1.0 | |||
| Turnout | 33,267 | 96.7 | |||
| Liberal hold | Swing | −0.4 | |||
Darling Downs
- This section is an excerpt from Electoral results for the Division of Darling Downs § 1951
| Party | Candidate | Votes | % | ±% | |
|---|---|---|---|---|---|
| Liberal | Reginald Swartz | unopposed | |||
| Liberal hold | Swing | ||||
Dawson
- This section is an excerpt from Electoral results for the Division of Dawson § 1951
| Party | Candidate | Votes | % | ±% | |
|---|---|---|---|---|---|
| Country | Charles Davidson | 19,058 | 56.3 | -2.1 | |
| Labor | George Hyde | 14,773 | 43.7 | +6.2 | |
| Total formal votes | 33,831 | 98.4 | |||
| Informal votes | 554 | 1.6 | |||
| Turnout | 34,385 | 95.3 | |||
| Country hold | Swing | -2.3 | |||
Fisher
- This section is an excerpt from Electoral results for the Division of Fisher § 1951
| Party | Candidate | Votes | % | ±% | |
|---|---|---|---|---|---|
| Country | Charles Adermann | 29,417 | 72.9 | +6.4 | |
| Labor | Geoffrey Arnell | 10,952 | 27.1 | +2.2 | |
| Total formal votes | 40,369 | 98.6 | |||
| Informal votes | 575 | 1.4 | |||
| Turnout | 40,944 | 96.9 | |||
| Country hold | Swing | +2.2 | |||
Griffith
- This section is an excerpt from Electoral results for the Division of Griffith § 1951
| Party | Candidate | Votes | % | ±% | |
|---|---|---|---|---|---|
| Liberal | Doug Berry | 19,019 | 53.7 | +2.0 | |
| Labor | William Thieme | 16,373 | 46.3 | +0.0 | |
| Total formal votes | 35,392 | 97.6 | |||
| Informal votes | 852 | 2.4 | |||
| Turnout | 36,244 | 95.5 | |||
| Liberal hold | Swing | +1.8 | |||
Herbert
- This section is an excerpt from Electoral results for the Division of Herbert § 1951
| Party | Candidate | Votes | % | ±% | |
|---|---|---|---|---|---|
| Labor | Bill Edmonds | 19,445 | 54.1 | +4.7 | |
| Country | Doug Jeffrey | 15,332 | 42.7 | -2.7 | |
| Communist | Gloria Phelan | 1,160 | 3.2 | -2.0 | |
| Total formal votes | 35,937 | 97.3 | |||
| Informal votes | 991 | 2.7 | |||
| Turnout | 36,928 | 93.7 | |||
| Two-party-preferred result | |||||
| Labor | Bill Edmonds | 57.0 | +3.3 | ||
| Country | Doug Jeffrey | 43.0 | -3.3 | ||
| Labor hold | Swing | +3.3 | |||
Kennedy
- This section is an excerpt from Electoral results for the Division of Kennedy § 1951
| Party | Candidate | Votes | % | ±% | |
|---|---|---|---|---|---|
| Labor | Bill Riordan | 16,700 | 60.2 | +5.1 | |
| Country | Ulick Browne | 11,038 | 39.8 | -1.7 | |
| Total formal votes | 27,738 | 98.3 | |||
| Informal votes | 494 | 1.7 | |||
| Turnout | 28,232 | 90.5 | |||
| Labor hold | Swing | +1.8 | |||
Leichhardt
- This section is an excerpt from Electoral results for the Division of Leichhardt § 1951
| Party | Candidate | Votes | % | ±% | |
|---|---|---|---|---|---|
| Labor | Harry Bruce | 16,827 | 49.0 | +6.7 | |
| Country | Tom Gilmore | 16,163 | 47.1 | -2.5 | |
| Communist | Richard Anear | 1,329 | 3.9 | +0.4 | |
| Total formal votes | 34,319 | 97.5 | |||
| Informal votes | 867 | 2.5 | |||
| Turnout | 35,186 | 92.8 | |||
| Two-party-preferred result | |||||
| Labor | Harry Bruce | 18,083 | 52.7 | +4.4 | |
| Country | Tom Gilmore | 16,236 | 47.3 | -4.4 | |
| Labor gain from Country | Swing | +4.4 | |||
Lilley
- This section is an excerpt from Electoral results for the Division of Lilley § 1951
| Party | Candidate | Votes | % | ±% | |
|---|---|---|---|---|---|
| Liberal | Bruce Wight | 22,945 | 57.8 | -1.6 | |
| Labor | Jim Hadley | 15,055 | 37.9 | -2.7 | |
| Independent | Walter Collings | 1,681 | 4.2 | +4.2 | |
| Total formal votes | 39,681 | 97.9 | |||
| Informal votes | 865 | 2.1 | |||
| Turnout | 40,546 | 95.2 | |||
| Two-party-preferred result | |||||
| Liberal | Bruce Wight | 58.9 | -0.5 | ||
| Labor | Jim Hadley | 41.1 | +0.5 | ||
| Liberal hold | Swing | -0.5 | |||
Maranoa
- This section is an excerpt from Electoral results for the Division of Maranoa § 1951
| Party | Candidate | Votes | % | ±% | |
|---|---|---|---|---|---|
| Labor | Alfred Dohring | 11,989 | 37.7 | -2.7 | |
| Country | Wilfred Brimblecombe | 10,316 | 32.4 | -27.2 | |
| Independent | Charles Russell | 9,502 | 29.9 | +29.9 | |
| Total formal votes | 31,807 | 98.5 | |||
| Informal votes | 475 | 1.5 | |||
| Turnout | 32,282 | 93.4 | |||
| Two-party-preferred result | |||||
| Country | Wilfred Brimblecombe | 18,071 | 56.8 | -2.8 | |
| Labor | Alfred Dohring | 13,736 | 43.2 | +2.8 | |
| Country hold | Swing | -2.8 | |||
McPherson
- This section is an excerpt from Electoral results for the Division of McPherson § 1951
| Party | Candidate | Votes | % | ±% | |
|---|---|---|---|---|---|
| Country | Arthur Fadden | 24,899 | 74.9 | +0.7 | |
| Independent | John Rosser | 8,338 | 25.1 | +25.1 | |
| Total formal votes | 33,237 | 97.8 | |||
| Informal votes | 747 | 2.2 | |||
| Turnout | 33,984 | 96.4 | |||
| Country hold | Swing | +0.7 | |||
Moreton
- This section is an excerpt from Electoral results for the Division of Moreton § 1951
| Party | Candidate | Votes | % | ±% | |
|---|---|---|---|---|---|
| Liberal | Josiah Francis | 27,146 | 59.5 | -1.9 | |
| Labor | Ted Mansfield | 17,661 | 38.7 | +2.3 | |
| Communist | Bill Yarrow | 813 | 1.8 | -0.4 | |
| Total formal votes | 45,620 | 98.0 | |||
| Informal votes | 914 | 2.0 | |||
| Turnout | 46,534 | 96.0 | |||
| Two-party-preferred result | |||||
| Liberal | Josiah Francis | 59.7 | -1.9 | ||
| Labor | Ted Mansfield | 40.3 | +1.9 | ||
| Liberal hold | Swing | -1.9 | |||
Oxley
- This section is an excerpt from Electoral results for the Division of Oxley § 1951
| Party | Candidate | Votes | % | ±% | |
|---|---|---|---|---|---|
| Liberal | Donald Cameron | 21,219 | 58.2 | +16.1 | |
| Labor | Andrew Crilly | 14,648 | 40.2 | -0.1 | |
| Communist | Frank O'Connor | 602 | 1.7 | +0.1 | |
| Total formal votes | 36,469 | 98.2 | |||
| Informal votes | 656 | 1.8 | |||
| Turnout | 37,125 | 97.5 | |||
| Two-party-preferred result | |||||
| Liberal | Donald Cameron | 58.4 | +1.6 | ||
| Labor | Andrew Crilly | 41.6 | -1.6 | ||
| Liberal hold | Swing | +1.6 | |||
Petrie
- This section is an excerpt from Electoral results for the Division of Petrie § 1951
| Party | Candidate | Votes | % | ±% | |
|---|---|---|---|---|---|
| Liberal | Alan Hulme | 24,843 | 58.6 | -1.1 | |
| Labor | Patrick Bredhauer | 17,533 | 41.4 | +4.8 | |
| Total formal votes | 42,376 | 98.0 | |||
| Informal votes | 849 | 2.0 | |||
| Turnout | 43,225 | 95.9 | |||
| Liberal hold | Swing | -3.0 | |||
Ryan
- This section is an excerpt from Electoral results for the Division of Ryan § 1951
| Party | Candidate | Votes | % | ±% | |
|---|---|---|---|---|---|
| Liberal | Nigel Drury | 26,021 | 60.9 | +0.6 | |
| Labor | Frank Luton | 16,733 | 39.1 | -0.6 | |
| Total formal votes | 42,754 | 98.2 | |||
| Informal votes | 783 | 1.2 | |||
| Turnout | 43,537 | 93.6 | |||
| Liberal hold | Swing | +0.6 | |||
Wide Bay
- This section is an excerpt from Electoral results for the Division of Wide Bay § 1951
| Party | Candidate | Votes | % | ±% | |
|---|---|---|---|---|---|
| Country | Bernard Corser | 22,895 | 56.9 | +0.4 | |
| Labor | Thomas Wallace | 17,337 | 43.1 | +15.1 | |
| Total formal votes | 40,232 | 98.5 | |||
| Informal votes | 594 | 1.5 | |||
| Turnout | 40,826 | 97.1 | |||
| Country hold | Swing | -7.4 | |||
South Australia
| |||||||||||||||||||||||||
All 10 SA seats in the House of Representatives 5 seats needed for a majority | |||||||||||||||||||||||||
|---|---|---|---|---|---|---|---|---|---|---|---|---|---|---|---|---|---|---|---|---|---|---|---|---|---|
| |||||||||||||||||||||||||
- The first-preference vote is not shown due to the fact that one Labor seat was uncontested, therefore the Labor vote is understated.[5]
Adelaide
- This section is an excerpt from Electoral results for the Division of Adelaide § 1951
| Party | Candidate | Votes | % | ±% | |
|---|---|---|---|---|---|
| Labor | Cyril Chambers | 22,938 | 59.8 | +0.0 | |
| Liberal | Thomas Phillips | 14,670 | 38.3 | +1.1 | |
| Communist | Edward Robertson | 732 | 1.9 | +0.0 | |
| Total formal votes | 38,340 | 97.3 | |||
| Informal votes | 1,076 | 2.7 | |||
| Turnout | 39,416 | 97.2 | |||
| Two-party-preferred result | |||||
| Labor | Cyril Chambers | 61.6 | −0.4 | ||
| Liberal | Thomas Phillips | 38.4 | +0.4 | ||
| Labor hold | Swing | −0.4 | |||
Angas
- This section is an excerpt from Electoral results for the Division of Angas (1949–1977) § 1949
| Party | Candidate | Votes | % | ±% | |
|---|---|---|---|---|---|
| Liberal | Alick Downer | 25,323 | 63.9 | +3.1 | |
| Labor | John Edwards | 14,324 | 36.1 | +1.6 | |
| Total formal votes | 39,647 | 97.9 | |||
| Informal votes | 863 | 2.1 | |||
| Turnout | 40,510 | 97.1 | |||
| Liberal hold | Swing | +0.8 | |||
Barker
- This section is an excerpt from Electoral results for the Division of Barker § 1951
| Party | Candidate | Votes | % | ±% | |
|---|---|---|---|---|---|
| Liberal | Archie Cameron | 25,256 | 61.4 | −3.1 | |
| Labor | Jim Corcoran | 14,880 | 36.2 | +3.1 | |
| Independent | Charles Lloyd | 528 | 1.3 | +1.3 | |
| Independent | Frank Rieck | 481 | 1.2 | +1.2 | |
| Total formal votes | 41,145 | 98.1 | |||
| Informal votes | 794 | 1.9 | |||
| Turnout | 41,939 | 97.5 | |||
| Two-party-preferred result | |||||
| Liberal | Archie Cameron | 62.7 | −3.1 | ||
| Labor | Jim Corcoran | 37.3 | +3.1 | ||
| Liberal hold | Swing | −3.1 | |||
Boothby
- This section is an excerpt from Electoral results for the Division of Boothby § 1951
| Party | Candidate | Votes | % | ±% | |
|---|---|---|---|---|---|
| Liberal | John McLeay | 24,644 | 61.1 | −0.2 | |
| Labor | Len Wright | 15,714 | 38.9 | +0.2 | |
| Total formal votes | 40,358 | 98.1 | |||
| Informal votes | 786 | 1.9 | |||
| Turnout | 41,144 | 96.9 | |||
| Liberal hold | Swing | −0.2 | |||
Grey
- This section is an excerpt from Electoral results for the Division of Grey § 1951
| Party | Candidate | Votes | % | ±% | |
|---|---|---|---|---|---|
| Labor | Edgar Russell | 21,384 | 56.1 | +1.7 | |
| Liberal | Edward Andrews | 16,749 | 43.9 | -1.7 | |
| Total formal votes | 38,133 | 98.4 | |||
| Informal votes | 616 | 1.6 | |||
| Turnout | 38,749 | 96.3 | |||
| Labor hold | Swing | +1.7 | |||
Hindmarsh
- This section is an excerpt from Electoral results for the Division of Hindmarsh § 1951
| Party | Candidate | Votes | % | ±% | |
|---|---|---|---|---|---|
| Labor | Clyde Cameron | unopposed | |||
| Labor hold | Swing | ||||
Kingston
- This section is an excerpt from Electoral results for the Division of Kingston § 1951
| Party | Candidate | Votes | % | ±% | |
|---|---|---|---|---|---|
| Labor | Pat Galvin | 24,834 | 50.6 | +2.2 | |
| Liberal | Jim Handby | 23,614 | 48.1 | -0.3 | |
| Communist | Eric Stead | 654 | 1.3 | +1.3 | |
| Total formal votes | 49,102 | 98.1 | |||
| Informal votes | 966 | 1.9 | |||
| Turnout | 50,068 | 97.2 | |||
| Two-party-preferred result | |||||
| Labor | Pat Galvin | 51.8 | +3.4 | ||
| Liberal | Jim Handby | 48.2 | -3.4 | ||
| Labor gain from Liberal | Swing | +3.4 | |||
Port Adelaide
- This section is an excerpt from Electoral results for the Division of Port Adelaide § 1951
| Party | Candidate | Votes | % | ±% | |
|---|---|---|---|---|---|
| Labor | Albert Thompson | 33,979 | 71.3 | -0.2 | |
| Liberal | John Caskey | 12,342 | 25.9 | -0.6 | |
| Communist | Alan Finger | 1,304 | 2.7 | +0.7 | |
| Total formal votes | 47,625 | 97.7 | |||
| Informal votes | 1,129 | 2.3 | |||
| Turnout | 48,754 | 96.6 | |||
| Two-party-preferred result | |||||
| Labor | Albert Thompson | 73.8 | +0.5 | ||
| Liberal | John Caskey | 26.2 | -0.5 | ||
| Labor hold | Swing | +0.5 | |||
Sturt
- This section is an excerpt from Electoral results for the Division of Sturt § 1951
| Party | Candidate | Votes | % | ±% | |
|---|---|---|---|---|---|
| Liberal | Keith Wilson | 22,599 | 52.4 | +1.6 | |
| Labor | Leslie McMullin | 20,554 | 47.6 | +2.4 | |
| Total formal votes | 43,153 | 97.7 | |||
| Informal votes | 1,038 | 2.3 | |||
| Turnout | 44,191 | 97.3 | |||
| Liberal hold | Swing | -0.4 | |||
Wakefield
- This section is an excerpt from Electoral results for the Division of Wakefield § 1951
| Party | Candidate | Votes | % | ±% | |
|---|---|---|---|---|---|
| Liberal | Philip McBride | 23,232 | 60.1 | -1.3 | |
| Labor | Cyril Hasse | 15,437 | 39.9 | +1.3 | |
| Total formal votes | 38,669 | 98.4 | |||
| Informal votes | 642 | 1.6 | |||
| Turnout | 39,311 | 97.7 | |||
| Liberal hold | Swing | -1.3 | |||
Western Australia
| ||||||||||||||||||||||||||||||||||
All 8 WA seats in the House of Representatives 4 seats needed for a majority | ||||||||||||||||||||||||||||||||||
|---|---|---|---|---|---|---|---|---|---|---|---|---|---|---|---|---|---|---|---|---|---|---|---|---|---|---|---|---|---|---|---|---|---|---|
| ||||||||||||||||||||||||||||||||||
Canning
- This section is an excerpt from Electoral results for the Division of Canning § 1951
| Party | Candidate | Votes | % | ±% | |
|---|---|---|---|---|---|
| Country | Len Hamilton | 22,012 | 64.6 | +27.8 | |
| Labor | Percy Munday | 12,057 | 35.4 | +5.1 | |
| Total formal votes | 34,069 | 97.1 | |||
| Informal votes | 1,018 | 2.9 | |||
| Turnout | 35,087 | 96.0 | |||
| Country hold | Swing | +11.1 | |||
Curtin
- This section is an excerpt from Electoral results for the Division of Curtin § 1951
| Party | Candidate | Votes | % | ±% | |
|---|---|---|---|---|---|
| Liberal | Paul Hasluck | 25,998 | 64.7 | +3.5 | |
| Labor | John Henshaw | 14,193 | 35.3 | −3.5 | |
| Total formal votes | 40,191 | 97.9 | |||
| Informal votes | 863 | 2.1 | |||
| Turnout | 41,054 | 96.0 | |||
| Liberal hold | Swing | +3.5 | |||
Forrest
- This section is an excerpt from Electoral results for the Division of Forrest § 1951
| Party | Candidate | Votes | % | ±% | |
|---|---|---|---|---|---|
| Liberal | Gordon Freeth | 22,287 | 59.5 | +32.5 | |
| Labor | Frederick O'Connor | 15,171 | 40.5 | -3.3 | |
| Total formal votes | 37,458 | 97.7 | |||
| Informal votes | 868 | 2.3 | |||
| Turnout | 38,326 | 97.0 | |||
| Liberal hold | Swing | +6.7 | |||
Fremantle
- This section is an excerpt from Electoral results for the Division of Fremantle § 1951
| Party | Candidate | Votes | % | ±% | |
|---|---|---|---|---|---|
| Labor | Kim Beazley Sr. | 23,901 | 56.7 | +2.0 | |
| Liberal | Len Seaton | 18,273 | 43.3 | -0.3 | |
| Total formal votes | 42,174 | 97.8 | |||
| Informal votes | 960 | 2.2 | |||
| Turnout | 43,134 | 97.1 | |||
| Labor hold | Swing | +0.5 | |||
Kalgoorlie
- This section is an excerpt from Electoral results for the Division of Kalgoorlie § 1951
| Party | Candidate | Votes | % | ±% | |
|---|---|---|---|---|---|
| Labor | Herbert Johnson | unopposed | |||
| Labor hold | Swing | ||||
Moore
- This section is an excerpt from Electoral results for the Division of Moore § 1951
| Party | Candidate | Votes | % | ±% | |
|---|---|---|---|---|---|
| Country | Hugh Leslie | 19,921 | 59.6 | +21.8 | |
| Labor | Arthur Hunter | 13,492 | 40.4 | +2.4 | |
| Total formal votes | 33,413 | 96.8 | |||
| Informal votes | 1,099 | 3.2 | |||
| Turnout | 34,512 | 95.2 | |||
| Country hold | Swing | +0.6 | |||
Perth
- This section is an excerpt from Electoral results for the Division of Perth § 1951
| Party | Candidate | Votes | % | ±% | |
|---|---|---|---|---|---|
| Liberal | Billy Snedden | 17,705 | 49.5 | +3.1 | |
| Labor | Tom Burke | 17,501 | 49.0 | +1.2 | |
| Communist | James Kelly | 532 | 1.5 | +0.2 | |
| Total formal votes | 35,738 | 97.4 | |||
| Informal votes | 965 | 2.6 | |||
| Turnout | 36,703 | 94.6 | |||
| Two-party-preferred result | |||||
| Labor | Tom Burke | 17,926 | 50.2 | +0.1 | |
| Liberal | Billy Snedden | 17,812 | 49.8 | -0.1 | |
| Labor hold | Swing | +0.1 | |||
Swan
- This section is an excerpt from Electoral results for the Division of Swan § 1951
| Party | Candidate | Votes | % | ±% | |
|---|---|---|---|---|---|
| Liberal | Bill Grayden | 24,336 | 53.0 | +0.6 | |
| Labor | Harry Webb | 20,258 | 44.2 | -3.4 | |
| Communist | Alex Jolly | 1,280 | 2.8 | +2.8 | |
| Total formal votes | 45,874 | 97.5 | |||
| Informal votes | 1,155 | 2.5 | |||
| Turnout | 47,029 | 95.8 | |||
| Two-party-preferred result | |||||
| Liberal | Bill Grayden | 53.3 | +0.9 | ||
| Labor | Harry Webb | 46.7 | -0.9 | ||
| Liberal hold | Swing | +0.9 | |||
Tasmania
| ||||||||||||||||||||||||||||||||||
All 5 Tasmanian seats in the House of Representatives 3 seats needed for a majority | ||||||||||||||||||||||||||||||||||
|---|---|---|---|---|---|---|---|---|---|---|---|---|---|---|---|---|---|---|---|---|---|---|---|---|---|---|---|---|---|---|---|---|---|---|
| ||||||||||||||||||||||||||||||||||
Bass
- This section is an excerpt from Electoral results for the Division of Bass § 1951
| Party | Candidate | Votes | % | ±% | |
|---|---|---|---|---|---|
| Liberal | Bruce Kekwick | 16,469 | 53.4 | +2.8 | |
| Labor | Colman O'Byrne | 14,346 | 46.6 | −2.8 | |
| Total formal votes | 30,815 | 96.4 | |||
| Informal votes | 1,137 | 3.6 | |||
| Turnout | 31,952 | 96.8 | |||
| Liberal hold | Swing | +2.8 | |||
Darwin
- This section is an excerpt from Electoral results for the Division of Darwin § 1951
| Party | Candidate | Votes | % | ±% | |
|---|---|---|---|---|---|
| Liberal | Aubrey Luck | 14,819 | 49.7 | -6.9 | |
| Labor | Max Poulter | 9,820 | 32.9 | +6.9 | |
| Labor | Clem Foster | 5,171 | 17.3 | +17.3 | |
| Total formal votes | 29,810 | 97.3 | |||
| Informal votes | 822 | 2.7 | |||
| Turnout | 30,632 | 97.3 | |||
| Two-party-preferred result | |||||
| Liberal | Aubrey Luck | 16,103 | 54.0 | -2.6 | |
| Labor | Max Poulter | 13,707 | 46.0 | +2.6 | |
| Liberal hold | Swing | -2.6 | |||
Denison
- This section is an excerpt from Electoral results for the Division of Denison § 1951
| Party | Candidate | Votes | % | ±% | |
|---|---|---|---|---|---|
| Liberal | Athol Townley | 15,449 | 53.3 | -1.8 | |
| Labor | Mervyn McNeair | 13,545 | 46.7 | +1.8 | |
| Total formal votes | 28,994 | 96.7 | |||
| Informal votes | 1,001 | 3.3 | |||
| Turnout | 29,995 | 96.1 | |||
| Liberal hold | Swing | -1.8 | |||
Franklin
- This section is an excerpt from Electoral results for the Division of Franklin § 1951
| Party | Candidate | Votes | % | ±% | |
|---|---|---|---|---|---|
| Liberal | Bill Falkinder | 17,983 | 55.4 | -2.6 | |
| Labor | Jack Frost | 14,460 | 44.6 | +2.6 | |
| Total formal votes | 32,443 | 97.8 | |||
| Informal votes | 934 | 2.8 | |||
| Turnout | 33,377 | 97.0 | |||
| Liberal hold | Swing | -2.6 | |||
Wilmot
- This section is an excerpt from Electoral results for the Division of Wilmot § 1951
| Party | Candidate | Votes | % | ±% | |
|---|---|---|---|---|---|
| Labor | Gil Duthie | 16,746 | 53.1 | +0.5 | |
| Liberal | Lionel Browning | 14,794 | 46.9 | -0.5 | |
| Total formal votes | 31,540 | 96.7 | |||
| Informal votes | 1,072 | 3.3 | |||
| Turnout | 32,612 | 96.1 | |||
| Labor hold | Swing | +0.5 | |||
Territories
Australian Capital Territory
| ||||||||||||||||||||||||||||||||||
Division of Australian Capital Territory | ||||||||||||||||||||||||||||||||||
|---|---|---|---|---|---|---|---|---|---|---|---|---|---|---|---|---|---|---|---|---|---|---|---|---|---|---|---|---|---|---|---|---|---|---|
| ||||||||||||||||||||||||||||||||||
- This section is an excerpt from Electoral results for the Division of Australian Capital Territory § 1951
| Party | Candidate | Votes | % | ±% | |
|---|---|---|---|---|---|
| Labor | Jim Fraser | 5,905 | 49.9 | +6.7 | |
| Independent | Lewis Nott | 3,265 | 27.6 | −3.5 | |
| Liberal | Clyde Greenwood | 2,287 | 19.3 | −3.2 | |
| Independent | Jessie Ashton | 373 | 3.2 | −0.1 | |
| Total formal votes | 11,830 | 99.4 | |||
| Informal votes | 69 | 0.6 | |||
| Turnout | 11,899 | 93.2 | |||
| Two-party-preferred result | |||||
| Labor | Jim Fraser | 52.9 | +6.7 | ||
| Independent | Lewis Nott | 47.1 | −6.7 | ||
| Labor gain from Independent | Swing | +6.7 | |||
Northern Territory
| ||||||||||||||||||||||||||||||||||
Division of Northern Territory | ||||||||||||||||||||||||||||||||||
|---|---|---|---|---|---|---|---|---|---|---|---|---|---|---|---|---|---|---|---|---|---|---|---|---|---|---|---|---|---|---|---|---|---|---|
| ||||||||||||||||||||||||||||||||||
- This section is an excerpt from Electoral results for the Division of Northern Territory § 1951
| Party | Candidate | Votes | % | ±% | |
|---|---|---|---|---|---|
| Labor | Jock Nelson | 3,213 | 64.1 | +19.8 | |
| Country | Ralph Edwards | 1,085 | 21.6 | +21.6 | |
| Independent | Jessie Litchfield | 717 | 14.3 | +14.3 | |
| Total formal votes | 5,015 | 98.1 | |||
| Informal votes | 95 | 1.9 | |||
| Turnout | 5,110 | 78.4 | |||
| Two-party-preferred result | |||||
| Labor | Jock Nelson | 71.3 | +18.6 | ||
| Country | Ralph Edwards | 28.7 | +28.7 | ||
| Labor hold | Swing | +18.6 | |||
See also
- Candidates of the 1951 Australian federal election
- Members of the Australian House of Representatives, 1951–1954
Notes
- ^ Including Northern Territory and Australian Capital Territory
References
- ^ "1951 House of Representatives". Psephos Adam Carr's Election Archive. Retrieved 29 May 2022.
- ^ a b c d e f g h i j k l m n o p q r s t u "1951 House of Representatives: NSW". Psephos Adam Carr's Election Archive. Retrieved 29 May 2022.
- ^ a b c d "1951 House of Representatives: Victoria". Psephos Adam Carr's Election Archive. Retrieved 29 May 2022.
- ^ "1951 House of Representatives: Queensland". Psephos Adam Carr's Election Archive. Retrieved 29 May 2022.
- ^ "AUSTRALIAN LEGISLATIVE ELECTION OF 28 APRIL 1951". psephos.adam-carr.net. Retrieved 9 October 2023.
- ^ a b "1951 House of Representatives: South Australia". Psephos Adam Carr's Election Archive. Retrieved 29 May 2022.
- ^ "1951 House of Representatives: Western Australia". Psephos Adam Carr's Election Archive. Retrieved 29 May 2022.
- ^ a b c d e "1951 House of Representatives: Tasmania". Psephos Adam Carr's Election Archive. Retrieved 29 May 2022.
- ^ "1951 House of Representatives: Australian Capital Territory". Psephos Adam Carr's Election Archive. Retrieved 29 May 2022.
- ^ "1951 House of Representatives: Northern Territory". Psephos Adam Carr's Election Archive. Retrieved 29 May 2022.
| House of Representatives | |||
|---|---|---|---|
| Senate | |||
| By-elections | |||