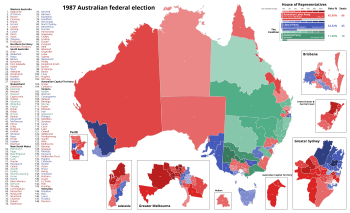
The following tables show results for the Australian House of Representatives at the 1987 federal election held on 11 July 1987.[1] [2]
YouTube Encyclopedic
1 / 5
Views: 6 765
350
437
3 064
54 370
"Election Night Analysis: Art or Science" - Antony Green (LCA 2022 Online)
Who voted for the Coalition in 1996 by Professor Ian McAllister
Britain has voted... Now what?
How To Remove a Prime Minister From Office | Auspol Explained
Washington DC Statehood demand - Senate Democrats introduce bill to make DC the 51st state of USA
Australia
House of Reps (IRV ) — 1987–90 – Turnout 93.84% (CV ) — Informal 4.94%
Party
Votes
%
Swing
Seats
Change
Liberal
3,169,061
34.32
+0.26
43
1
National
1,048,249
11.35
+0.72
19
2
Country Liberal
21,668
0.23
−0.09
0
1
Liberal/National Coalition
4,238,978
45.90
+0.89
62
Labor
4,238,663
45.90
−1.65
86
Democrats
557,262
6.00
+0.55
Unite Australia
14,593
0.16
+0.16
NT Nationals
10,273
0.11
+0.11
Nuclear Disarmament
9,735
0.11
–0.10
Family Movement
4,065
0.04
+0.04
Pensioner
3,346
0.04
+0.02
Democratic Labor
3,334
0.04
–0.53
Socialist Workers
1,097
0.01
–0.10
Communist
535
0.01
+0.00
Independents
153,205
1.66
+0.62
Total
9,235,086
148
Two-party-preferred vote
Labor
4,693,099
50.83
−0.94
86
Liberal/National coalition
4,540,009
49.17
+0.94
62
Invalid/blank votes
480,354
4.9
–1.9
Turnout
9,715,440
93.8
Registered voters
10,353,229
Source: Federal Election Results 1949-1993
States New South Wales
Turnout 93.9% (CV ) — Informal 4.6% [2]
Party
Votes
%
Swing
Seats
Change
Liberal
1,059,597
33.26
+0.5
13
National
375,443
11.78
+1.25
10
Liberal/National Coalition
1,435,040
45.04
+1.74
23
Labor
1,438,985
45.17
–3.09
28
Democrats
201,924
6.34
+0.43
Independent
107,029
3.36
+1.19
Unite Australia
1,837
0.06
+0.06
Nuclear Disarmament
1,105
0.03
+0.18
Communist
1,213
0.04
–0.01
Total
3,185,920
51
Two-party-preferred vote
Labor
1,602,013
50.29
–2.62
Liberal/National Coalition
1,583,465
49.71
+2.62
Invalid/blank votes
152,696
4.6
–1.6
Turnout
3,338,616
93.9
Registered voters
3,555,061
Source: Psephos Adam Carr's Election Archive 1987
Victoria
Turnout 94.9% (CV ) — Informal 5.2% [2]
Party
Votes
%
Swing
Seats
Change
Liberal
922,680
38.02
1.14
12
National
154,088
6.35
–0.02
3
Liberal/National Coalition
1,076,768
44.37
1.13
15
Labor
1,139,337
46.95
–1.99
24
Democrats
163,160
6.72
0.35
Independent
34,491
1.42
–0.73
Unite Australia
5,427
0.22
Pensioner
3,346
0.14
0.02
Democratic Labor
3,334
0.14
–4.90
Socialist Workers
1,097
0.04
–0.02
Total
2,426,960
39
Two-party-preferred vote
Labor
1,268,894
52.31
–0.78
24
Liberal/National Coalition
1,157,037
47.69
+0.78
15
Invalid/blank votes
134,415
5.25
–2.95
Turnout
2,561,375
95.1
Registered voters
2,698,034
Source: Psephos Adam Carr's Election Archive 1987
Queensland
Turnout 92.2% (CV ) — Informal 3.4% [2]
Party
Votes
%
Swing
Seats
Change
National
438,627
28.85
-2.85
6
Liberal
319,607
21.02
1.86
5
Liberal/National Coalition
758,234
49.87
-0.99
11
Labor
683,640
44.96
0.90
13
Democrats
74,215
4.88
0.06
Independent
2,684
0.18
-0.04
Nuclear Disarmament
1,718
0.11
0.00
Total
1,520,491
24
Two-party-preferred vote
Labor
749,834
49.32
49.32
13
Liberal/National Coalition
770,515
50.68
49.32
11
Invalid/blank votes
53,622
3.41
-1.19
Turnout
1,574,113
92.18
Registered voters
1,707,701
Source: Psephos Adam Carr's Election Archive 1987
Western Australia
Turnout 92.2% (CV ) — Informal 3.4% [2]
Party
Votes
%
Swing
Seats
Change
Liberal
332,266
41.79
-3.95
4
National
54,871
6.90
5.59
Liberal/National Coalition
387,137
48.69
1.64
4
Labor
377,493
47.48
-0.71
9
Democrats
27,302
3.43
-0.27
Independents
3,112
0.39
-0.12
Total
795,044
13
Two-party-preferred vote
Labor
404,751
50.91
-0.05
9
Liberal/National Coalition
390,232
49.09
0.05
4
Invalid/blank votes
55,776
6.56
-0.86
Turnout
850,820
93.84
Registered voters
906,677
Source: Psephos Adam Carr's Election Archive 1987
South Australia
Turnout 93.8% (CV ) — Informal 6.8% [2]
Party
Votes
%
Swing
Seats
Change
Liberal
350,218
42.51
0.41
5
National
30,928
3.75
3.75
Liberal/National Coalition
381,146
46.26
4.16
5
Labor
367,045
44.55
-3.83
8
Democrats
64,163
7.79
0.85
Unite Australia
7,329
0.89
0.00
Independents
3,664
0.44
0.02
Communist
535
0.06
0.00
Total
823,882
13
Two-party-preferred vote
Labor
413,827
50.24
-1.43
8
Liberal/National Coalition
409,828
49.76
1.43
5
Invalid/blank votes
60,536
6.84
-1.85
Turnout
884,418
93.80
Registered voters
942,885
Source: Psephos Adam Carr's Election Archive 1987
Tasmania
Territories Australian Capital Territory
First party
Second party
Leader
Bob Hawke
John Howard
Party
Labor
Coalition
Last election
2 seats
0 seats
Seats won
2
0
Seat change
Popular vote
79,791
44,806
Percentage
53.92%
30.28%
Swing
TPP
63.25%
38.04%
TPP swing
Turnout 94.1% (CV ) — Informal 2.9% [2]
Party
Votes
%
Swing
Seats
Change
Labor
79,791
53.92
0.58
2
Liberal
44,806
30.28
-1.91
0
Democrats
10,124
6.84
-0.77
Nuclear Disarmament
6,912
4.67
0.99
Family Movement
4,065
2.75
0.00
Independent
2,290
1.55
0.48
Total
147,988
2
Two-party-preferred vote
Labor
93,575
63.25
1.29
2
Liberal
54,379
36.75
-1.29
0
Invalid/blank votes
5,328
3.48
-1.61
Turnout
153,316
94.22
Registered voters
162,717
Source: Psephos Adam Carr's Election Archive 1987
Northern Territory
First party
Second party
Leader
Bob Hawke
John Howard
Party
Labor
Coalition
Last election
0 seats
1 seat
Seats won
1
0
Seat change
Popular vote
28,195
21,668
Percentage
46.9%
36.0%
Swing
TPP
52.2%
47.8%
TPP swing
See also
References
This page was last edited on 8 June 2024, at 01:14