
This is a list of electoral division results for the Australian 1949 federal election.[1]
Overall
- This section is an excerpt from 1949 Australian federal election § House of Representatives
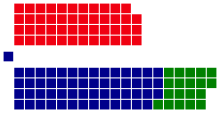
Labor: 47 seats
Liberal Party: 55 seats
Country: 19 seats
| Party | Votes | % | Swing | Seats | Change | ||
|---|---|---|---|---|---|---|---|
| Liberal–Country coalition | 2,314,143 | 50.26 | +6.61 | 74 | +45 | ||
| Liberal | 1,813,794 | 39.39 | +6.44 | 55 | +37 | ||
| Country | 500,349 | 10.87 | +0.17 | 19 | +8 | ||
| Labor | 2,117,088 | 45.98 | –3.73 | 48[a] | +4 | ||
| Communist | 40,941 | 0.89 | –0.60 | 0 | 0 | ||
| Lang Labor | 32,870 | 0.71 | –0.88 | 0 | –1 | ||
| Independents | 99,368 | 2.16 | +0.34 | 1[b] | –1 | ||
| Total | 4,604,410 | 123 | +48 | ||||
| Two-party-preferred (estimated) | |||||||
| Liberal–Country coalition | Win | 51.00 | +5.10 | 74 | +45 | ||
| Labor | 49.00 | −5.10 | 47 | +4 | |||

New South Wales
| |||||||||||||||||||||||||||||||||||||||||
All 47 NSW seats in the House of Representatives 24 seats needed for a majority | |||||||||||||||||||||||||||||||||||||||||
|---|---|---|---|---|---|---|---|---|---|---|---|---|---|---|---|---|---|---|---|---|---|---|---|---|---|---|---|---|---|---|---|---|---|---|---|---|---|---|---|---|---|
| |||||||||||||||||||||||||||||||||||||||||


Banks
- This section is an excerpt from Electoral results for the Division of Banks § 1949
| Party | Candidate | Votes | % | ±% | |
|---|---|---|---|---|---|
| Labor | Eric Costa | 24,537 | 58.3 | −3.8 | |
| Liberal | Howard Fletcher | 15,371 | 36.5 | +7.6 | |
| Lang Labor | Francis Foy | 2,202 | 5.2 | +5.2 | |
| Total formal votes | 42,110 | 98.8 | |||
| Informal votes | 941 | 2.2 | |||
| Turnout | 43,051 | 95.5 | |||
| Two-party-preferred result | |||||
| Labor | Eric Costa | 62.2 | −4.1 | ||
| Liberal | Howard Fletcher | 37.8 | +4.1 | ||
| Labor notional hold | Swing | −4.1 | |||
Barton
- This section is an excerpt from Electoral results for the Division of Barton § 1949
| Party | Candidate | Votes | % | ±% | |
|---|---|---|---|---|---|
| Labor | Herbert Evatt | 21,681 | 53.2 | −13.0 | |
| Liberal | Nancy Wake | 19,037 | 46.8 | +13.0 | |
| Total formal votes | 40,718 | 98.4 | |||
| Informal votes | 653 | 1.6 | |||
| Turnout | 41,371 | 98.0 | |||
| Labor hold | Swing | −13.0 | |||
Bennelong
- This section is an excerpt from Electoral results for the Division of Bennelong § 1949
| Party | Candidate | Votes | % | ±% | |
|---|---|---|---|---|---|
| Liberal | John Cramer | 23,568 | 59.6 | +8.2 | |
| Labor | Raymond Watt | 15,952 | 40.4 | −8.2 | |
| Total formal votes | 39,520 | 97.9 | |||
| Informal votes | 849 | 2.1 | |||
| Turnout | 40,369 | 96.5 | |||
| Liberal notional hold | Swing | +8.2 | |||
Blaxland
- This section is an excerpt from Electoral results for the Division of Blaxland § 1949
| Party | Candidate | Votes | % | ±% | |
|---|---|---|---|---|---|
| Labor | Jim Harrison | 19,403 | 49.3 | +21.7 | |
| Lang Labor | Jack Lang | 9,752 | 24.8 | −15.0 | |
| Liberal | Thomas Handran-Smith | 9,364 | 23.8 | −7.7 | |
| Communist | Roy Kirby | 865 | 2.2 | +2.2 | |
| Total formal votes | 39,384 | 98.0 | |||
| Informal votes | 802 | 2.0 | |||
| Turnout | 40,186 | 96.1 | |||
| Two-party-preferred result | |||||
| Labor | Jim Harrison | 53.4 | +53.4 | ||
| Lang Labor | Jack Lang | 46.6 | −13.9 | ||
| Labor notional gain from Lang Labor | Swing | +53.4 | |||
Bradfield
- This section is an excerpt from Electoral results for the Division of Bradfield § 1949
| Party | Candidate | Votes | % | ±% | |
|---|---|---|---|---|---|
| Liberal | Billy Hughes | 28,428 | 71.4 | −3.8 | |
| Labor | Ken Gee | 8,645 | 21.7 | −3.0 | |
| Independent | Edward Price | 2,764 | 6.9 | +6.9 | |
| Total formal votes | 39,837 | 98.2 | |||
| Informal votes | 722 | 1.8 | |||
| Turnout | 40,559 | 95.8 | |||
| Two-party-preferred result | |||||
| Liberal | Billy Hughes | 74.9 | −0.3 | ||
| Labor | Ken Gee | 25.1 | +0.3 | ||
| Liberal notional hold | Swing | −0.3 | |||
Calare
- This section is an excerpt from Electoral results for the Division of Calare § 1949
| Party | Candidate | Votes | % | ±% | |
|---|---|---|---|---|---|
| Liberal | John Howse | 21,399 | 57.0 | +25.1 | |
| Labor | George Gibbons | 16,139 | 43.0 | −5.3 | |
| Total formal votes | 37,538 | 98.8 | |||
| Informal votes | 472 | 1.2 | |||
| Turnout | 38,010 | 97.3 | |||
| Liberal hold | Swing | +6.4 | |||
Cook
- This section is an excerpt from Electoral results for the Division of Cook (1906–1955) § 1949
| Party | Candidate | Votes | % | ±% | |
|---|---|---|---|---|---|
| Labor | Tom Sheehan | 27,485 | 75.0 | +2.7 | |
| Liberal | Gerald Davis | 5,970 | 16.3 | +3.9 | |
| Lang Labor | John Eldridge | 1,920 | 5.2 | −9.5 | |
| Communist | Mervyn Pidcock | 1,276 | 3.5 | −2.9 | |
| Total formal votes | 36,651 | 96.9 | |||
| Informal votes | 1,174 | 3.1 | |||
| Turnout | 37,825 | 95.9 | |||
| Two-party-preferred result | |||||
| Labor | Tom Sheehan | 82.1 | +8.7 | ||
| Liberal | Gerald Davis | 17.9 | +17.9 | ||
| Labor hold | Swing | +8.7 | |||
Cowper
- This section is an excerpt from Electoral results for the Division of Cowper § 1949
| Party | Candidate | Votes | % | ±% | |
|---|---|---|---|---|---|
| Country | Sir Earle Page | 22,791 | 61.7 | +0.9 | |
| Labor | Louis Jabour | 14,134 | 38.3 | +3.0 | |
| Total formal votes | 36,925 | 98.9 | |||
| Informal votes | 404 | 1.1 | |||
| Turnout | 47,329 | 96.9 | |||
| Country hold | Swing | −1.0 | |||
Cunningham
- This section is an excerpt from Electoral results for the Division of Cunningham § 1949
| Party | Candidate | Votes | % | ±% | |
|---|---|---|---|---|---|
| Labor | Billy Davies | 22,795 | 60.7 | +3.0 | |
| Liberal | Alan Thomson | 11,892 | 31.7 | +0.8 | |
| Communist | Eric Aarons | 2,854 | 7.6 | −4.7 | |
| Total formal votes | 37,541 | 97.3 | |||
| Informal votes | 1,047 | 2.7 | |||
| Turnout | 38,588 | 95.7 | |||
| Two-party-preferred result | |||||
| Labor | Billy Davies | 68.2 | +0.4 | ||
| Liberal | Alan Thomson | 31.8 | −0.4 | ||
| Labor notional hold | Swing | +0.4 | |||
Dalley
- This section is an excerpt from Electoral results for the Division of Dalley § 1949
| Party | Candidate | Votes | % | ±% | |
|---|---|---|---|---|---|
| Labor | Sol Rosevear | 27,501 | 73.0 | +9.6 | |
| Liberal | Charles Shields | 10,190 | 27.0 | −2.9 | |
| Total formal votes | 37,691 | 97.1 | |||
| Informal votes | 1,111 | 2.9 | |||
| Turnout | 38,802 | 96.6 | |||
| Labor hold | Swing | +3.3 | |||
Darling
- This section is an excerpt from Electoral results for the Division of Darling § 1949
| Party | Candidate | Votes | % | ±% | |
|---|---|---|---|---|---|
| Labor | Joe Clark | 20,843 | 63.8 | −2.7 | |
| Country | Elson Whyte | 10,348 | 31.7 | +9.7 | |
| Communist | Cecil Connors | 1,017 | 3.1 | +3.1 | |
| Independent | Madge Roberts | 450 | 1.4 | +1.4 | |
| Total formal votes | 32,658 | 97.2 | |||
| Informal votes | 929 | 2.8 | |||
| Turnout | 33,587 | 94.7 | |||
| Two-party-preferred result | |||||
| Labor | Joe Clark | 67.3 | −3.0 | ||
| Country | Elson Whyte | 32.7 | +3.0 | ||
| Labor hold | Swing | −3.0 | |||
East Sydney
- This section is an excerpt from Electoral results for the Division of East Sydney § 1949
| Party | Candidate | Votes | % | ±% | |
|---|---|---|---|---|---|
| Labor | Eddie Ward | 22,496 | 57.0 | -4.8 | |
| Liberal | John Mant | 15,398 | 39.0 | +5.9 | |
| Independent | William Dalton | 1,552 | 3.9 | +3.9 | |
| Total formal votes | 39,446 | 97.5 | |||
| Informal votes | 1,015 | 2.5 | |||
| Turnout | 40,461 | 95.5 | |||
| Two-party-preferred result | |||||
| Labor | Eddie Ward | 58.0 | -6.3 | ||
| Liberal | John Mant | 42.0 | +6.3 | ||
| Labor hold | Swing | -6.3 | |||
Eden-Monaro
- This section is an excerpt from Electoral results for the Division of Eden-Monaro § 1949
| Party | Candidate | Votes | % | ±% | |
|---|---|---|---|---|---|
| Labor | Allan Fraser | 19,004 | 50.9 | -5.4 | |
| Liberal | Denzil Macarthur-Onslow | 18,317 | 49.1 | +15.0 | |
| Total formal votes | 37,321 | 98.6 | |||
| Informal votes | 517 | 1.4 | |||
| Turnout | 37,838 | 96.6 | |||
| Labor hold | Swing | -6.6 | |||
Evans
- This section is an excerpt from Electoral results for the Division of Evans § 1949
| Party | Candidate | Votes | % | ±% | |
|---|---|---|---|---|---|
| Liberal | Frederick Osborne | 21,616 | 56.6 | +5.6 | |
| Labor | Ronald Nicholls | 16,588 | 43.4 | -5.6 | |
| Total formal votes | 38,204 | 98.1 | |||
| Informal votes | 734 | 1.9 | |||
| Turnout | 38,938 | 96.8 | |||
| Liberal notional hold | Swing | +5.6 | |||
Farrer
- This section is an excerpt from Electoral results for the Division of Farrer § 1949
| Party | Candidate | Votes | % | ±% | |
|---|---|---|---|---|---|
| Labor | Thomas McGrath | 14,853 | 39.3 | -7.0 | |
| Liberal | David Fairbairn | 14,425 | 38.2 | +20.4 | |
| Country | John Mackay | 8,099 | 21.4 | -14.1 | |
| Communist | Bill Gollan | 419 | 1.1 | +1.1 | |
| Total formal votes | 37,796 | 98.3 | |||
| Informal votes | 665 | 1.7 | |||
| Turnout | 38,461 | 97.0 | |||
| Two-party-preferred result | |||||
| Liberal | David Fairbairn | 22,222 | 58.8 | N/A | |
| Labor | Thomas McGrath | 15,574 | 41.2 | N/A | |
| Liberal notional gain from Country | Swing | N/A | |||
Grayndler
- This section is an excerpt from Electoral results for the Division of Grayndler § 1949
| Party | Candidate | Votes | % | ±% | |
|---|---|---|---|---|---|
| Labor | Fred Daly | 25,622 | 67.1 | +5.2 | |
| Liberal | Donald Clark | 11,299 | 29.6 | +11.5 | |
| Communist | Henry McPhillips | 920 | 2.4 | -1.8 | |
| Republican | William McCristal | 349 | 0.9 | +0.9 | |
| Total formal votes | 38,190 | 97.3 | |||
| Informal votes | 1,057 | 2.7 | |||
| Turnout | 39,247 | 96.4 | |||
| Two-party-preferred result | |||||
| Labor | Fred Daly | 69.7 | -6.9 | ||
| Liberal | Donald Clark | 30.3 | +6.9 | ||
| Labor notional hold | Swing | -6.9 | |||
Gwydir
- This section is an excerpt from Electoral results for the Division of Gwydir § 1949
| Party | Candidate | Votes | % | ±% | |
|---|---|---|---|---|---|
| Country | Thomas Treloar | 20,018 | 55.1 | +17.4 | |
| Labor | William Scully | 16,282 | 44.9 | -3.5 | |
| Total formal votes | 36,300 | 99.1 | |||
| Informal votes | 346 | 0.9 | |||
| Turnout | 36,646 | 95.8 | |||
| Country gain from Labor | Swing | +9.2 | |||
Hume
- This section is an excerpt from Electoral results for the Division of Hume § 1949
| Party | Candidate | Votes | % | ±% | |
|---|---|---|---|---|---|
| Country | Charles Anderson | 18,871 | 51.0 | +18.8 | |
| Labor | Arthur Fuller | 18,104 | 49.0 | −4.2 | |
| Total formal votes | 36,975 | 98.9 | |||
| Informal votes | 428 | 1.1 | |||
| Turnout | 37,403 | 96.3 | |||
| Country gain from Labor | Swing | +5.9 | |||
Hunter
- This section is an excerpt from Electoral results for the Division of Hunter § 1949
| Party | Candidate | Votes | % | ±% | |
|---|---|---|---|---|---|
| Labor | Rowley James | 26,704 | 68.6 | -14.4 | |
| Liberal | Ted Fletcher | 8,502 | 21.8 | +10.4 | |
| Communist | Evan Phillips | 3,729 | 9.6 | +9.6 | |
| Total formal votes | 38,935 | 97.6 | |||
| Informal votes | 964 | 2.4 | |||
| Turnout | 39,899 | 97.2 | |||
| Two-party-preferred result | |||||
| Labor | Rowley James | 77.3 | -9.7 | ||
| Liberal | Ted Fletcher | 32.7 | +9.7 | ||
| Labor hold | Swing | -9.7 | |||
Kingsford Smith
- This section is an excerpt from Electoral results for the Division of Kingsford Smith § 1949
| Party | Candidate | Votes | % | ±% | |
|---|---|---|---|---|---|
| Labor | Gordon Anderson | 18,573 | 49.7 | -4.3 | |
| Liberal | Charles de Monchaux | 17,387 | 46.5 | +9.5 | |
| Independent | Henry Crittenden | 1,206 | 3.2 | +3.2 | |
| Independent | Clare Peters | 221 | 0.6 | +0.6 | |
| Total formal votes | 37,387 | 97.7 | |||
| Informal votes | 883 | 2.3 | |||
| Turnout | 38,270 | 96.5 | |||
| Two-party-preferred result | |||||
| Labor | Gordon Anderson | 19,042 | 50.9 | -7.6 | |
| Liberal | Charles de Monchaux | 18,345 | 49.1 | +7.6 | |
| Labor notional hold | Swing | -7.6 | |||
Lang
- This section is an excerpt from Electoral results for the Division of Lang § 1949
| Party | Candidate | Votes | % | ±% | |
|---|---|---|---|---|---|
| Labor | Dan Mulcahy | 20,421 | 50.2 | +0.3 | |
| Liberal | Eric Willis | 18,369 | 45.1 | +9.1 | |
| Communist | Roy Boyd | 1,905 | 4.7 | -2.8 | |
| Total formal votes | 40,695 | 98.0 | |||
| Informal votes | 827 | 2.0 | |||
| Turnout | 41,522 | 97.9 | |||
| Two-party-preferred result | |||||
| Labor | Dan Mulcahy | 54.7 | -6.4 | ||
| Liberal | Eric Willis | 45.3 | +6.4 | ||
| Labor hold | Swing | -6.4 | |||
Lawson
- This section is an excerpt from Electoral results for the Division of Lawson § 1949
| Party | Candidate | Votes | % | ±% | |
|---|---|---|---|---|---|
| Labor | Alan Manning | 15,969 | 43.0 | -3.9 | |
| Country | Laurie Failes | 11,531 | 31.0 | -4.3 | |
| Liberal | Elwyn Croft | 9,249 | 24.9 | +18.6 | |
| Independent | William Ferguson | 392 | 1.1 | +1.1 | |
| Total formal votes | 37,141 | 98.7 | |||
| Informal votes | 476 | 1.3 | |||
| Turnout | 37,617 | 96.6 | |||
| Two-party-preferred result | |||||
| Country | Laurie Failes | 20,773 | 55.8 | +7.6 | |
| Labor | Alan Manning | 16,408 | 44.2 | -7.6 | |
| Country notional gain from Labor | Swing | +7.6 | |||
Lowe
- This section is an excerpt from Electoral results for the Division of Lowe § 1949
| Party | Candidate | Votes | % | ±% | |
|---|---|---|---|---|---|
| Liberal | William McMahon | 20,489 | 52.7 | +3.8 | |
| Labor | Hector McDonald | 15,908 | 40.9 | -8.0 | |
| Independent Liberal | Edith Shortland | 2,470 | 6.4 | +6.4 | |
| Total formal votes | 38,867 | 98.0 | |||
| Informal votes | 786 | 2.0 | |||
| Turnout | 39,653 | 97.5 | |||
| Two-party-preferred result | |||||
| Liberal | William McMahon | 58.5 | +9.0 | ||
| Labor | Hector McDonald | 41.5 | -9.0 | ||
| Liberal notional gain from Labor | Swing | +9.0 | |||
Lyne
- This section is an excerpt from Electoral results for the Division of Lyne § 1949
| Party | Candidate | Votes | % | ±% | |
|---|---|---|---|---|---|
| Country | Jim Eggins | 10,212 | 27.7 | +9.3 | |
| Labor | Edward Hayes | 10,160 | 27.6 | −8.8 | |
| Country | Philip Lucock | 6,984 | 19.0 | +19.0 | |
| Country | Eric Mackay | 6,111 | 16.6 | +16.6 | |
| Country | Francis Hain | 2,296 | 6.2 | +6.2 | |
| Independent | Joe Cordner | 1,057 | 2.9 | +2.9 | |
| Total formal votes | 36,820 | 96.8 | |||
| Informal votes | 1,235 | 3.2 | |||
| Turnout | 38,055 | 97.0 | |||
| Two-party-preferred result | |||||
| Country | Jim Eggins | 24,308 | 66.0 | +4.1 | |
| Labor | Edward Hayes | 12,512 | 34.0 | −4.1 | |
| Country notional hold | Swing | +4.1 | |||
Macarthur
- This section is an excerpt from Electoral results for the Division of Macarthur § 1949
| Party | Candidate | Votes | % | ±% | |
|---|---|---|---|---|---|
| Liberal | Jeff Bate | 25,184 | 64.6 | +16.6 | |
| Labor | William McDonnell | 13,776 | 35.4 | -9.1 | |
| Total formal votes | 38,960 | 98.3 | |||
| Informal votes | 689 | 1.7 | |||
| Turnout | 39,649 | 95.9 | |||
| Liberal notional hold | Swing | +12.2 | |||
Mackellar
- This section is an excerpt from Electoral results for the Division of Mackellar § 1949
| Party | Candidate | Votes | % | ±% | |
|---|---|---|---|---|---|
| Liberal | Bill Wentworth | 25,678 | 62.6 | +7.2 | |
| Labor | James Mitchell | 15,314 | 37.4 | -7.2 | |
| Total formal votes | 40,992 | 97.5 | |||
| Informal votes | 1,068 | 2.5 | |||
| Turnout | 42,060 | 96.2 | |||
| Liberal notional hold | Swing | +7.2 | |||
Macquarie
- This section is an excerpt from Electoral results for the Division of Macquarie § 1949
| Party | Candidate | Votes | % | ±% | |
|---|---|---|---|---|---|
| Labor | Ben Chifley | 21,683 | 57.7 | -5.1 | |
| Liberal | Bob Cotton | 14,585 | 38.8 | +13.3 | |
| Communist | John King | 1,320 | 3.5 | +3.5 | |
| Total formal votes | 37,588 | 98.8 | |||
| Informal votes | 441 | 1.2 | |||
| Turnout | 38,029 | 97.6 | |||
| Two-party-preferred result | |||||
| Labor | Ben Chifley | 61.0 | -4.4 | ||
| Liberal | Bob Cotton | 39.0 | +4.4 | ||
| Labor hold | Swing | -4.4 | |||
Martin
- This section is an excerpt from Electoral results for the Division of Martin § 1949
| Party | Candidate | Votes | % | ±% | |
|---|---|---|---|---|---|
| Labor | William O'Connor | 20,603 | 53.5 | -1.9 | |
| Liberal | Frederick Mann | 14,550 | 37.8 | +8.2 | |
| Communist | Tom Dowling | 1,847 | 4.8 | +0.6 | |
| Lang Labor | Frank Moss | 808 | 2.1 | -3.8 | |
| Independent | Malinda Ivey | 681 | 1.8 | +1.8 | |
| Total formal votes | 38,489 | 97.3 | |||
| Informal votes | 1,057 | 2.7 | |||
| Turnout | 39,546 | 97.3 | |||
| Two-party-preferred result | |||||
| Labor | William O'Connor | 59.6 | -6.1 | ||
| Liberal | Frederick Mann | 40.4 | +6.1 | ||
| Labor hold | Swing | -6.1 | |||
Mitchell
- This section is an excerpt from Electoral results for the Division of Mitchell § 1949
| Party | Candidate | Votes | % | ±% | |
|---|---|---|---|---|---|
| Liberal | Roy Wheeler | 23,274 | 56.9 | +17.0 | |
| Labor | Joseph White | 17,643 | 43.1 | -8.7 | |
| Total formal votes | 40,917 | 97.7 | |||
| Informal votes | 963 | 2.3 | |||
| Turnout | 41,880 | 96.4 | |||
| Liberal notional gain from Labor | Swing | +12.8 | |||
New England
- This section is an excerpt from Electoral results for the Division of New England § 1949
| Party | Candidate | Votes | % | ±% | |
|---|---|---|---|---|---|
| Country | David Drummond | 16,159 | 44.3 | -16.0 | |
| Labor | William Wilson | 13,515 | 37.0 | -4.7 | |
| Country | Donald Shand | 6,830 | 18.7 | +18.7 | |
| Total formal votes | 36,504 | 98.8 | |||
| Informal votes | 427 | 1.2 | |||
| Turnout | 36,931 | 96.2 | |||
| Two-party-preferred result | |||||
| Country | David Drummond | 22,417 | 61.4 | +2.9 | |
| Labor | William Wilson | 14,087 | 38.6 | -2.9 | |
| Country hold | Swing | +2.9 | |||
Newcastle
- This section is an excerpt from Electoral results for the Division of Newcastle § 1949
| Party | Candidate | Votes | % | ±% | |
|---|---|---|---|---|---|
| Labor | David Watkins | 21,705 | 55.7 | -1.4 | |
| Liberal | Harry Quinlan | 15,529 | 39.9 | +14.6 | |
| Communist | Laurie Aarons | 1,257 | 3.2 | -3.7 | |
| Independent | Grahame Bland | 445 | 1.1 | -1.2 | |
| Total formal votes | 38,936 | 98.2 | |||
| Informal votes | 711 | 1.8 | |||
| Turnout | 39,647 | 97.8 | |||
| Two-party-preferred result | |||||
| Labor | David Watkins | 58.3 | -10.8 | ||
| Liberal | Harry Quinlan | 41.7 | +10.8 | ||
| Labor hold | Swing | -10.8 | |||
North Sydney
- This section is an excerpt from Electoral results for the Division of North Sydney § 1949
| Party | Candidate | Votes | % | ±% | |
|---|---|---|---|---|---|
| Liberal | William Jack | 19,650 | 50.9 | +3.3 | |
| Labor | Leo Haylen | 16,094 | 41.7 | -10.7 | |
| Independent | Patrick Williams | 1,642 | 4.3 | +4.3 | |
| Lang Labor | Norman Ferguson | 1,642 | 3.1 | +3.1 | |
| Total formal votes | 38,591 | 97.9 | |||
| Informal votes | 831 | 2.1 | |||
| Turnout | 39,422 | 97.6 | |||
| Two-party-preferred result | |||||
| Liberal | William Jack | 53.3 | +5.7 | ||
| Labor | Leo Haylen | 46.7 | -5.7 | ||
| Liberal gain from Labor | Swing | +5.7 | |||
Parkes
- This section is an excerpt from Electoral results for the Division of Parkes (1901–1969) § 1949
| Party | Candidate | Votes | % | ±% | |
|---|---|---|---|---|---|
| Labor | Les Haylen | 19,966 | 51.8 | -8.2 | |
| Liberal | Dick Dein | 18,579 | 48.2 | +8.5 | |
| Total formal votes | 38,545 | 97.9 | |||
| Informal votes | 826 | 2.1 | |||
| Turnout | 39,371 | 97.0 | |||
| Labor hold | Swing | -7.8 | |||
Parramatta
- This section is an excerpt from Electoral results for the Division of Parramatta § 1949
| Party | Candidate | Votes | % | ±% | |
|---|---|---|---|---|---|
| Liberal | Howard Beale | 25,411 | 62.6 | +7.2 | |
| Labor | Clement Jackson | 15,211 | 37.4 | -7.2 | |
| Total formal votes | 40,622 | 98.2 | |||
| Informal votes | 756 | 1.8 | |||
| Turnout | 41,378 | 96.7 | |||
| Liberal hold | Swing | +7.2 | |||
Paterson
- This section is an excerpt from Electoral results for the Division of Paterson § 1949
| Party | Candidate | Votes | % | ±% | |
|---|---|---|---|---|---|
| Labor | Cecil Robinson | 14,089 | 37.9 | -7.8 | |
| Liberal | Allen Fairhall | 11,189 | 30.1 | +12.2 | |
| Country | Arsie Dorsman | 5,293 | 14.2 | +0.6 | |
| Country | John McGirr | 3,842 | 10.3 | +10.3 | |
| Country | Robert Clendinning | 2,101 | 5.7 | +5.7 | |
| Country | Ernest Slater | 656 | 1.8 | +1.8 | |
| Total formal votes | 37,170 | 96.7 | |||
| Informal votes | 1,267 | 3.3 | |||
| Turnout | 38,437 | 97.4 | |||
| Two-party-preferred result | |||||
| Liberal | Allen Fairhall | 21,741 | 58.5 | +58.5 | |
| Labor | Cecil Robinson | 15,429 | 41.5 | -8.6 | |
| Liberal notional gain from Labor | Swing | +8.6 | |||
Phillip
- This section is an excerpt from Electoral results for the Division of Phillip § 1949
| Party | Candidate | Votes | % | ±% | |
|---|---|---|---|---|---|
| Labor | Joe Fitzgerald | 19,455 | 51.2 | -7.8 | |
| Liberal | William Latimer | 16,302 | 42.9 | +3.4 | |
| Independent | Jessie Street | 2,272 | 6.0 | +6.0 | |
| Total formal votes | 38,029 | 98.0 | |||
| Informal votes | 762 | 2.0 | |||
| Turnout | 38,791 | 96.3 | |||
| Two-party-preferred result | |||||
| Labor | Joe Fitzgerald | 55.7 | -4.0 | ||
| Liberal | William Latimer | 44.3 | +4.0 | ||
| Labor notional hold | Swing | -4.0 | |||
Reid
- This section is an excerpt from Electoral results for the Division of Reid § 1949
| Party | Candidate | Votes | % | ±% | |
|---|---|---|---|---|---|
| Labor | Charles Morgan | 24,607 | 58.1 | +9.8 | |
| Liberal | Jim Clough | 12,304 | 29.0 | +6.6 | |
| Lang Labor | Rupert Sheldon | 5,467 | 12.9 | -13.4 | |
| Total formal votes | 42,378 | 97.8 | |||
| Informal votes | 942 | 2.2 | |||
| Turnout | 43.320 | 96.4 | |||
| Two-party-preferred result | |||||
| Labor | Charles Morgan | 67.8 | |||
| Liberal | Jim Clough | 32.2 | |||
| Labor hold | Swing | ||||
Richmond
- This section is an excerpt from Electoral results for the Division of Richmond § 1949
| Party | Candidate | Votes | % | ±% | |
|---|---|---|---|---|---|
| Country | Larry Anthony | 27,504 | 75.1 | +6.0 | |
| Labor | Alexander Bryen | 9,139 | 24.9 | -6.0 | |
| Total formal votes | 36,643 | 98.8 | |||
| Informal votes | 441 | 1.2 | |||
| Turnout | 37,084 | 96.2 | |||
| Country hold | Swing | +6.0 | |||
Riverina
- This section is an excerpt from Electoral results for the Division of Riverina § 1949
| Party | Candidate | Votes | % | ±% | |
|---|---|---|---|---|---|
| Country | Hugh Roberton | 19,904 | 53.3 | +18.0 | |
| Labor | Joe Langtry | 16,880 | 45.2 | -0.5 | |
| Communist | William Mitchell | 560 | 1.5 | +1.5 | |
| Total formal votes | 37,344 | 98.8 | |||
| Informal votes | 458 | 1.2 | |||
| Turnout | 37,802 | 96.0 | |||
| Two-party-preferred result | |||||
| Country | Hugh Roberton | 53.5 | +3.8 | ||
| Labor | Joe Langtry | 46.5 | -3.8 | ||
| Country gain from Labor | Swing | +3.8 | |||
Robertson
- This section is an excerpt from Electoral results for the Division of Robertson § 1949
| Party | Candidate | Votes | % | ±% | |
|---|---|---|---|---|---|
| Liberal | Roger Dean | 21,617 | 54.2 | +16.2 | |
| Labor | Thomas Williams | 18,236 | 45.8 | -6.9 | |
| Total formal votes | 39,853 | 97.9 | |||
| Informal votes | 858 | 2.1 | |||
| Turnout | 40,711 | 96.4 | |||
| Liberal gain from Labor | Swing | +11.5 | |||
Shortland
- This section is an excerpt from Electoral results for the Division of Shortland § 1949
| Party | Candidate | Votes | % | ±% | |
|---|---|---|---|---|---|
| Labor | Charles Griffiths | 21,921 | 54.4 | -12.8 | |
| Liberal | Harold Daisley | 10,513 | 26.1 | +7.1 | |
| Independent | Alfred Boa | 6,423 | 15.9 | +15.9 | |
| Communist | Eugene Marshall | 882 | 2.2 | +2.2 | |
| Independent | Isabel Longworth | 570 | 1.4 | +1.4 | |
| Total formal votes | 40,309 | 97.6 | |||
| Informal votes | 996 | 2.4 | |||
| Turnout | 41,305 | 97.3 | |||
| Two-party-preferred result | |||||
| Labor | Charles Griffiths | 64.1 | -12.0 | ||
| Liberal | Harold Daisley | 35.9 | +12.0 | ||
| Labor notional hold | Swing | -12.0 | |||
St George
- This section is an excerpt from Electoral results for the Division of St George § 1949
| Party | Candidate | Votes | % | ±% | |
|---|---|---|---|---|---|
| Liberal | Bill Graham | 19,987 | 52.0 | +17.2 | |
| Labor | Joseph Nicholson | 18,475 | 48.0 | -12.1 | |
| Total formal votes | 38,462 | 97.8 | |||
| Informal votes | 847 | 2.2 | |||
| Turnout | 39,309 | 97.3 | |||
| Liberal notional gain from Labor | Swing | +16.2 | |||
Warringah
- This section is an excerpt from Electoral results for the Division of Warringah § 1949
| Party | Candidate | Votes | % | ±% | |
|---|---|---|---|---|---|
| Liberal | Percy Spender | 27,563 | 70.1 | +1.6 | |
| Independent Labor | Bill Fisher | 8,356 | 21.3 | +21.3 | |
| Independent Labor | Norman Chadwick | 3,315 | 8.4 | +8.4 | |
| Total formal votes | 39,234 | 98.4 | |||
| Informal votes | 632 | 1.6 | |||
| Turnout | 39,866 | 95.8 | |||
| Two-party-preferred result | |||||
| Liberal | Percy Spender | 71.1 | +2.4 | ||
| Independent Labor | Bill Fisher | 28.9 | +28.9 | ||
| Liberal hold | Swing | +2.4 | |||
Watson
- This section is an excerpt from Electoral results for the Division of Watson (1934–1969) § 1949
| Party | Candidate | Votes | % | ±% | |
|---|---|---|---|---|---|
| Labor | Dan Curtin | 19,515 | 49.4 | -5.9 | |
| Liberal | Stanley Card | 15,147 | 38.3 | +12.5 | |
| Independent Labor | Max Falstein | 3,656 | 9.2 | +9.2 | |
| Lang Labor | Harold O'Reilly | 1,210 | 3.1 | -3.1 | |
| Total formal votes | 39,528 | 97.3 | |||
| Informal votes | 1,079 | 2.7 | |||
| Turnout | 40,607 | 96.5 | |||
| Two-party-preferred result | |||||
| Labor | Dan Curtin | 59.0 | -3.5 | ||
| Liberal | Stanley Card | 41.0 | +3.5 | ||
| Labor hold | Swing | -3.5 | |||
Wentworth
- This section is an excerpt from Electoral results for the Division of Wentworth § 1949
| Party | Candidate | Votes | % | ±% | |
|---|---|---|---|---|---|
| Liberal | Eric Harrison | 28,821 | 75.1 | +7.9 | |
| Labor | William McKell | 9,533 | 24.9 | -5.5 | |
| Total formal votes | 38,354 | 98.2 | |||
| Informal votes | 703 | 1.8 | |||
| Turnout | 39,057 | 96.1 | |||
| Liberal hold | Swing | +6.8 | |||
Werriwa
- This section is an excerpt from Electoral results for the Division of Werriwa § 1949
| Party | Candidate | Votes | % | ±% | |
|---|---|---|---|---|---|
| Labor | Bert Lazzarini | 24,142 | 56.2 | +1.6 | |
| Liberal | Ray Watson | 18,787 | 43.8 | +6.5 | |
| Total formal votes | 42,929 | 97.8 | |||
| Informal votes | 961 | 2.2 | |||
| Turnout | 43,890 | 95.2 | |||
| Labor hold | Swing | −6.0 | |||
West Sydney
- This section is an excerpt from Electoral results for the Division of West Sydney § 1949
| Party | Candidate | Votes | % | ±% | |
|---|---|---|---|---|---|
| Labor | Dan Minogue | 17,732 | 49.8 | -18.2 | |
| Lang Labor | Horace Foley | 8,872 | 24.9 | +16.6 | |
| Liberal | Basil Mottershead | 7,235 | 20.3 | +1.2 | |
| Communist | Stan Moran | 1,786 | 5.0 | +0.4 | |
| Total formal votes | 35,625 | 96.8 | |||
| Informal votes | 1,168 | 3.2 | |||
| Turnout | 36,793 | 91.3 | |||
| Two-party-preferred result | |||||
| Labor | Dan Minogue | 55.7 | -21.7 | ||
| Lang Labor | Horace Foley | 44.3 | +21.7 | ||
| Labor hold | Swing | -21.7 | |||
Victoria
| |||||||||||||||||||||||||||||||
All 33 Victorian seats in the House of Representatives 17 seats needed for a majority | |||||||||||||||||||||||||||||||
|---|---|---|---|---|---|---|---|---|---|---|---|---|---|---|---|---|---|---|---|---|---|---|---|---|---|---|---|---|---|---|---|
| |||||||||||||||||||||||||||||||
Balaclava
- This section is an excerpt from Electoral results for the Division of Balaclava § 1949
| Party | Candidate | Votes | % | ±% | |
|---|---|---|---|---|---|
| Liberal | Thomas White | 26,157 | 63.9 | +4.8 | |
| Labor | Martin Dunne | 14,796 | 36.1 | −4.8 | |
| Total formal votes | 40,953 | 98.8 | |||
| Informal votes | 512 | 1.2 | |||
| Turnout | 41,465 | 96.3 | |||
| Liberal hold | Swing | +4.8 | |||
Ballaarat
- This section is an excerpt from Electoral results for the Division of Ballarat § 1949
| Party | Candidate | Votes | % | ±% | |
|---|---|---|---|---|---|
| Liberal | Alan Pittard | 19,851 | 50.4 | +3.1 | |
| Labor | Raymond Hyatt | 19,522 | 49.6 | −3.1 | |
| Total formal votes | 39,373 | 99.0 | |||
| Informal votes | 380 | 1.0 | |||
| Turnout | 39,753 | 97.3 | |||
| Liberal gain from Labor | Swing | +3.1 | |||
Batman
- This section is an excerpt from Electoral results for the Division of Batman § 1949
| Party | Candidate | Votes | % | ±% | |
|---|---|---|---|---|---|
| Labor | Alan Bird | 22,662 | 58.4 | +4.3 | |
| Liberal | Neil McKay | 16,139 | 41.6 | +3.3 | |
| Total formal votes | 38,801 | 98.6 | |||
| Informal votes | 544 | 1.4 | |||
| Turnout | 39,345 | 95.9 | |||
| Labor hold | Swing | −1.1 | |||
Bendigo
- This section is an excerpt from Electoral results for the Division of Bendigo § 1949
| Party | Candidate | Votes | % | ±% | |
|---|---|---|---|---|---|
| Liberal | Thomas Grigg | 19,268 | 47.7 | +24.2 | |
| Labor | Percy Clarey | 18,962 | 47.0 | −5.0 | |
| Independent | Allan Goodman | 2,134 | 5.3 | +5.3 | |
| Total formal votes | 40,364 | 98.6 | |||
| Informal votes | 554 | 1.4 | |||
| Turnout | 40,918 | 96.5 | |||
| Two-party-preferred result | |||||
| Labor | Percy Clarey | 20,258 | 50.2 | −4.1 | |
| Liberal | Thomas Grigg | 20,106 | 49.8 | +4.1 | |
| Labor gain from Country | Swing | 14.1 | |||
Burke
- This section is an excerpt from Electoral results for the Division of Burke (1949–1955) § 1949
| Party | Candidate | Votes | % | ±% | |
|---|---|---|---|---|---|
| Labor | Ted Peters | 24,362 | 62.1 | +11.1 | |
| Liberal | Alfred Wall | 9,865 | 25.2 | +2.4 | |
| Independent | Henry Hodges | 4,720 | 12.0 | +12.0 | |
| Independent | James Whitworth | 271 | 0.7 | +0.7 | |
| Total formal votes | 39,218 | 97.5 | |||
| Informal votes | 999 | 2.5 | |||
| Turnout | 40,217 | 95.8 | |||
| Two-party-preferred result | |||||
| Labor | Ted Peters | 69.4 | −0.7 | ||
| Liberal | Alfred Wall | 30.6 | +0.7 | ||
| Labor notional hold | Swing | −0.7 | |||
Chisholm
- This section is an excerpt from Electoral results for the Division of Chisholm § 1949
| Party | Candidate | Votes | % | ±% | |
|---|---|---|---|---|---|
| Liberal | Wilfrid Kent Hughes | 26,628 | 64.7 | +4.1 | |
| Labor | Leo Fennessy | 13,615 | 33.1 | +0.1 | |
| Communist | Bill Tregear | 937 | 2.3 | +2.3 | |
| Total formal votes | 41,180 | 98.5 | |||
| Informal votes | 648 | 1.5 | |||
| Turnout | 41,828 | 96.7 | |||
| Two-party-preferred result | |||||
| Liberal | Wilfrid Kent Hughes | 64.9 | +3.8 | ||
| Labor | Leo Fennessy | 35.1 | −3.8 | ||
| Liberal notional hold | Swing | +3.8 | |||
Corangamite
- This section is an excerpt from Electoral results for the Division of Corangamite § 1949
| Party | Candidate | Votes | % | ±% | |
|---|---|---|---|---|---|
| Liberal | Allan McDonald | 21,670 | 57.5 | +1.1 | |
| Labor | Henry Stacpoole | 14,936 | 39.6 | −3.9 | |
| Independent | Elsie Brushfield | 1,080 | 2.9 | +2.9 | |
| Total formal votes | 37,686 | 99.2 | |||
| Informal votes | 286 | 0.8 | |||
| Turnout | 37,972 | 97.0 | |||
| Two-party-preferred result | |||||
| Liberal | Allan McDonald | 60.0 | +3.6 | ||
| Labor | Henry Stacpoole | 40.0 | −3.6 | ||
| Liberal hold | Swing | +3.6 | |||
Corio
- This section is an excerpt from Electoral results for the Division of Corio § 1949
| Party | Candidate | Votes | % | ±% | |
|---|---|---|---|---|---|
| Liberal | Hubert Opperman | 20,018 | 50.3 | +7.4 | |
| Labor | John Dedman | 19,783 | 49.7 | −6.2 | |
| Total formal votes | 39,801 | 99.2 | |||
| Informal votes | 316 | 0.8 | |||
| Turnout | 40,117 | 96.2 | |||
| Liberal gain from Labor | Swing | +6.7 | |||
Darebin
- This section is an excerpt from Electoral results for the Division of Darebin § 1949
| Party | Candidate | Votes | % | ±% | |
|---|---|---|---|---|---|
| Labor | Tom Andrews | 24,719 | 62.7 | +4.1 | |
| Liberal | Jack McColl | 14,688 | 37.3 | +5.9 | |
| Total formal votes | 39,407 | 98.4 | |||
| Informal votes | 655 | 1.6 | |||
| Turnout | 40,062 | 97.1 | |||
| Labor notional hold | Swing | −2.7 | |||
Deakin
- This section is an excerpt from Electoral results for the Division of Deakin § 1949
| Party | Candidate | Votes | % | ±% | |
|---|---|---|---|---|---|
| Liberal | Frank Davis | 23,517 | 55.6 | +0.5 | |
| Labor | Rod Leeson | 18,784 | 44.4 | -0.5 | |
| Total formal votes | 42,301 | 98.7 | |||
| Informal votes | 575 | 1.3 | |||
| Turnout | 42,876 | 94.7 | |||
| Liberal hold | Swing | +0.5 | |||
Fawkner
- This section is an excerpt from Electoral results for the Division of Fawkner § 1949
| Party | Candidate | Votes | % | ±% | |
|---|---|---|---|---|---|
| Labor | Bill Bourke | 20,228 | 50.0 | +2.3 | |
| Liberal | Magnus Cormack | 20,201 | 50.0 | +1.8 | |
| Total formal votes | 40,429 | 98.1 | |||
| Informal votes | 782 | 1.9 | |||
| Turnout | 41,211 | 95.2 | |||
| Labor hold | Swing | -0.8 | |||
Flinders
- This section is an excerpt from Electoral results for the Division of Flinders § 1949
| Party | Candidate | Votes | % | ±% | |
|---|---|---|---|---|---|
| Liberal | Rupert Ryan | 21,096 | 54.8 | +3.3 | |
| Labor | Robert Wilson | 11,410 | 29.6 | -18.9 | |
| Independent Labor | Andrew Hughes | 6,018 | 15.6 | +15.6 | |
| Total formal votes | 38,524 | 98.7 | |||
| Informal votes | 490 | 1.3 | |||
| Turnout | 39,014 | 94.3 | |||
| Two-party-preferred result | |||||
| Liberal | Rupert Ryan | 63.6 | +12.1 | ||
| Labor | Robert Wilson | 36.4 | -12.1 | ||
| Liberal hold | Swing | +12.1 | |||
Gellibrand
- This section is an excerpt from Electoral results for the Division of Gellibrand § 1949
| Party | Candidate | Votes | % | ±% | |
|---|---|---|---|---|---|
| Labor | John Mullens | 20,519 | 51.3 | −22.5 | |
| Liberal | William Massey | 8,904 | 22.2 | −4.0 | |
| Independent Labor | Angus Macdonald | 6,323 | 15.8 | +15.8 | |
| Independent | William Anderson | 2,865 | 7.2 | +7.2 | |
| Communist | John Arrowsmith | 1,418 | 3.5 | +3.5 | |
| Total formal votes | 40,029 | 97.5 | |||
| Informal votes | 1,011 | 2.5 | |||
| Turnout | 41,040 | 97.1 | |||
| Two-party-preferred result | |||||
| Labor | John Mullens | 69.7 | −4.1 | ||
| Liberal | William Massey | 30.3 | +4.1 | ||
| Labor notional hold | Swing | −4.1 | |||
Gippsland
- This section is an excerpt from Electoral results for the Division of Gippsland § 1949
| Party | Candidate | Votes | % | ±% | |
|---|---|---|---|---|---|
| Country | George Bowden | 22,824 | 66.7 | +6.6 | |
| Labor | Horace Hawkins | 11,373 | 33.3 | -2.4 | |
| Total formal votes | 34,197 | 98.6 | |||
| Informal votes | 472 | 1.4 | |||
| Turnout | 34,669 | 96.2 | |||
| Country hold | Swing | +4.6 | |||
Henty
- This section is an excerpt from Electoral results for the Division of Henty § 1949
| Party | Candidate | Votes | % | ±% | |
|---|---|---|---|---|---|
| Liberal | Jo Gullett | 22,650 | 55.2 | +4.1 | |
| Labor | Val Doube | 17,548 | 42.7 | -6.2 | |
| Lang Labor | Charles Dicker | 858 | 2.1 | +2.1 | |
| Total formal votes | 41,056 | 98.8 | |||
| Informal votes | 510 | 1.2 | |||
| Turnout | 41,566 | 96.7 | |||
| Two-party-preferred result | |||||
| Liberal | Jo Gullett | 55.4 | +4.3 | ||
| Labor | Val Doube | 44.6 | -4.3 | ||
| Liberal hold | Swing | +4.3 | |||
Higgins
- This section is an excerpt from Electoral results for the Division of Higgins § 1949
| Party | Candidate | Votes | % | ±% | |
|---|---|---|---|---|---|
| Liberal | Harold Holt | 26,018 | 66.8 | +6.8 | |
| Labor | Jules Meltzer | 12,909 | 33.2 | −3.7 | |
| Total formal votes | 38,927 | 98.4 | |||
| Informal votes | 621 | 1.6 | |||
| Turnout | 39,548 | 94.7 | |||
| Liberal notional hold | Swing | +5.4 | |||
Higinbotham
- This section is an excerpt from Electoral results for the Division of Higinbotham § 1949
| Party | Candidate | Votes | % | ±% | |
|---|---|---|---|---|---|
| Liberal | Frank Timson | 22,832 | 53.6 | +1.2 | |
| Labor | Frank Field | 19,760 | 46.4 | -1.2 | |
| Total formal votes | 42,592 | 98.8 | |||
| Informal votes | 512 | 1.2 | |||
| Turnout | 43,104 | 96.4 | |||
| Liberal notional hold | Swing | +1.2 | |||
Hoddle
- This section is an excerpt from Electoral results for the Division of Hoddle § 1949
| Party | Candidate | Votes | % | ±% | |
|---|---|---|---|---|---|
| Labor | Jack Cremean | 28,351 | 77.1 | +1.3 | |
| Liberal | Terence Kirby | 6,593 | 17.9 | -3.3 | |
| Communist | Leslie Loye | 1,137 | 3.1 | +0.0 | |
| Independent | Albert Wallace | 689 | 1.9 | +1.9 | |
| Total formal votes | 36,770 | 96.4 | |||
| Informal votes | 1,382 | 3.6 | |||
| Turnout | 38,152 | 94.4 | |||
| Two-party-preferred result | |||||
| Labor | Jack Cremean | 80.8 | -2.3 | ||
| Liberal | Terence Kirby | 19.2 | +2.3 | ||
| Labor notional hold | Swing | -2.3 | |||
Indi
- This section is an excerpt from Electoral results for the Division of Indi § 1949
| Party | Candidate | Votes | % | ±% | |
|---|---|---|---|---|---|
| Labor | Charles Edmondson | 13,626 | 36.7 | +1.9 | |
| Liberal | William Bostock | 12,377 | 33.3 | +33.3 | |
| Country | Clive Nason | 11,157 | 30.0 | −35.2 | |
| Total formal votes | 37,160 | 98.9 | |||
| Informal votes | 412 | 1.1 | |||
| Turnout | 37,572 | 96.7 | |||
| Two-party-preferred result | |||||
| Liberal | William Bostock | 22,182 | 59.7 | +59.7 | |
| Labor | Charles Edmondson | 14,978 | 40.3 | +40.3 | |
| Liberal gain from Country | Swing | +59.7 | |||
Isaacs
- This section is an excerpt from Electoral results for the Division of Isaacs (1949–1969) § 1949
| Party | Candidate | Votes | % | ±% | |
|---|---|---|---|---|---|
| Liberal | William Haworth | 21,260 | 54.0 | +1.7 | |
| Labor | John Bourke | 18,100 | 46.0 | -1.4 | |
| Total formal votes | 39,360 | 98.1 | |||
| Informal votes | 747 | 1.9 | |||
| Turnout | 40,107 | 94.4 | |||
| Liberal notional hold | Swing | +1.6 | |||
Kooyong
- This section is an excerpt from Electoral results for the Division of Kooyong § 1949
| Party | Candidate | Votes | % | ±% | |
|---|---|---|---|---|---|
| Liberal | Robert Menzies | 27,912 | 67.1 | +4.8 | |
| Labor | Keith Ewert | 13,691 | 32.9 | +1.3 | |
| Total formal votes | 41,603 | 98.9 | |||
| Informal votes | 463 | 1.1 | |||
| Turnout | 42,066 | 97.2 | |||
| Liberal hold | Swing | +4.2 | |||
La Trobe
- This section is an excerpt from Electoral results for the Division of La Trobe § 1949
| Party | Candidate | Votes | % | ±% | |
|---|---|---|---|---|---|
| Liberal | Richard Casey | 23,645 | 58.6 | +4.1 | |
| Labor | Robert Balcombe | 16,714 | 41.4 | −4.1 | |
| Total formal votes | 40,359 | 98.3 | |||
| Informal votes | 698 | 1.7 | |||
| Turnout | 41,057 | 94.6 | |||
| Liberal notional hold | Swing | +4.1 | |||
Lalor
- This section is an excerpt from Electoral results for the Division of Lalor § 1949
| Party | Candidate | Votes | % | ±% | |
|---|---|---|---|---|---|
| Labor | Reg Pollard | 20,264 | 51.6 | −5.4 | |
| Liberal | John Bellair | 18,970 | 48.4 | +5.4 | |
| Total formal votes | 39,234 | 98.4 | |||
| Informal votes | 619 | 1.6 | |||
| Turnout | 39,853 | 94.5 | |||
| Labor notional hold | Swing | −5.4 | |||
Mallee
- This section is an excerpt from Electoral results for the Division of Mallee § 1949
| Party | Candidate | Votes | % | ±% | |
|---|---|---|---|---|---|
| Country | Winton Turnbull | 22,658 | 64.6 | +4.9 | |
| Labor | Alfred O'Connor | 12,410 | 35.4 | −4.9 | |
| Total formal votes | 35,068 | 98.5 | |||
| Informal votes | 533 | 1.5 | |||
| Turnout | 35,601 | 96.2 | |||
| Country notional hold | Swing | +4.9 | |||
Maribyrnong
- This section is an excerpt from Electoral results for the Division of Maribyrnong § 1949
| Party | Candidate | Votes | % | ±% | |
|---|---|---|---|---|---|
| Labor | Arthur Drakeford | 26,639 | 61.9 | -1.1 | |
| Liberal | George Hannan | 14,675 | 34.1 | -2.9 | |
| Prot. Christian Dem. | Colin Neyland | 1,751 | 4.1 | +4.1 | |
| Total formal votes | 43,065 | 98.6 | |||
| Informal votes | 603 | 1.4 | |||
| Turnout | 43,668 | 97.1 | |||
| Two-party-preferred result | |||||
| Labor | Arthur Drakeford | 64.0 | +1.0 | ||
| Liberal | George Hannan | 36.0 | -1.0 | ||
| Labor hold | Swing | +1.0 | |||
McMillan
- This section is an excerpt from Electoral results for the Division of McMillan § 1949
| Party | Candidate | Votes | % | ±% | |
|---|---|---|---|---|---|
| Labor | Adam Keltie | 14,263 | 38.7 | -3.6 | |
| Liberal | Geoffrey Brown | 11,938 | 32.4 | +6.5 | |
| Country | Bob May | 9,714 | 26.4 | -0.6 | |
| Communist | Bob Hamilton | 912 | 2.5 | -2.2 | |
| Total formal votes | 36,827 | 98.0 | |||
| Informal votes | 758 | 2.0 | |||
| Turnout | 37,585 | 95.6 | |||
| Two-party-preferred result | |||||
| Liberal | Geoffrey Brown | 20,960 | 56.9 | +6.1 | |
| Labor | Adam Keltie | 15,867 | 43.1 | -6.1 | |
| Liberal notional gain from Country | Swing | +6.1 | |||
Melbourne
- This section is an excerpt from Electoral results for the Division of Melbourne § 1949
| Party | Candidate | Votes | % | ±% | |
|---|---|---|---|---|---|
| Labor | Arthur Calwell | 24,187 | 64.5 | -6.2 | |
| Liberal | Desmond McGinnes | 9,366 | 25.0 | -4.3 | |
| Independent | Charles McLaren | 1,350 | 3.6 | +3.6 | |
| Communist | Gerry O'Day | 1,244 | 3.3 | +3.3 | |
| Protestant Christian | Niven Neyland | 794 | 2.1 | +2.1 | |
| Lang Labor | Philip Wilson | 576 | 1.5 | +1.5 | |
| Total formal votes | 37,517 | 96.0 | |||
| Informal votes | 1,544 | 4.0 | |||
| Turnout | 39,061 | 93.6 | |||
| Two-party-preferred result | |||||
| Labor | Arthur Calwell | 70.9 | +0.2 | ||
| Liberal | Desmond McGinnes | 29.1 | -0.2 | ||
| Labor hold | Swing | +0.2 | |||
Melbourne Ports
- This section is an excerpt from Electoral results for the Division of Melbourne Ports § 1949
| Party | Candidate | Votes | % | ±% | |
|---|---|---|---|---|---|
| Labor | Jack Holloway | 26,792 | 67.9 | -2.5 | |
| Liberal | Frank Block | 12,690 | 32.1 | +2.5 | |
| Total formal votes | 39,482 | 97.2 | |||
| Informal votes | 1,137 | 2.8 | |||
| Turnout | 40,619 | 94.6 | |||
| Labor hold | Swing | -2.5 | |||
Murray
- This section is an excerpt from Electoral results for the Division of Murray § 1949
| Party | Candidate | Votes | % | ±% | |
|---|---|---|---|---|---|
| Country | John McEwen | 23,778 | 63.5 | +5.7 | |
| Labor | Desmond Devlin | 13,650 | 36.5 | +1.4 | |
| Total formal votes | 37,428 | 98.4 | |||
| Informal votes | 616 | 1.6 | |||
| Turnout | 38,044 | 95.9 | |||
| Country notional hold | Swing | -1.4 | |||
Wannon
- This section is an excerpt from Electoral results for the Division of Wannon § 1949
| Party | Candidate | Votes | % | ±% | |
|---|---|---|---|---|---|
| Labor | Don McLeod | 16,905 | 47.1 | -4.6 | |
| Liberal | Dan Mackinnon | 13,235 | 36.9 | +9.1 | |
| Country | Helena Marfell | 5,716 | 15.9 | -1.5 | |
| Total formal votes | 35,856 | 99.1 | |||
| Informal votes | 312 | 0.9 | |||
| Turnout | 36,168 | 97.8 | |||
| Two-party-preferred result | |||||
| Liberal | Dan Mackinnon | 18,203 | 50.8 | +3.8 | |
| Labor | Don McLeod | 17,653 | 49.2 | -3.8 | |
| Liberal gain from Labor | Swing | +3.8 | |||
Wills
- This section is an excerpt from Electoral results for the Division of Wills § 1949
| Party | Candidate | Votes | % | ±% | |
|---|---|---|---|---|---|
| Labor | Bill Bryson | 18,918 | 44.2 | +0.7 | |
| Liberal | Allan Tyrer | 15,101 | 35.3 | +3.3 | |
| Independent | Doris Blackburn | 8,801 | 20.6 | -2.7 | |
| Total formal votes | 42,820 | 98.6 | |||
| Informal votes | 613 | 1.4 | |||
| Turnout | 43,433 | 96.4 | |||
| Two-party-preferred result | |||||
| Labor | Bill Bryson | 25,162 | 58.8 | -2.7 | |
| Liberal | Allan Tyrer | 17,658 | 41.2 | +2.7 | |
| Labor notional hold | Swing | -2.7 | |||
Wimmera
- This section is an excerpt from Electoral results for the Division of Wimmera § 1949
| Party | Candidate | Votes | % | ±% | |
|---|---|---|---|---|---|
| Liberal | William Lawrence | 13,761 | 39.0 | +17.5 | |
| Labor | Cyril Sudholz | 11,184 | 31.7 | -6.8 | |
| Country | Harrie Wade | 10,343 | 29.3 | -10.7 | |
| Total formal votes | 35,288 | 99.1 | |||
| Informal votes | 308 | 0.9 | |||
| Turnout | 35,596 | 97.0 | |||
| Two-party-preferred result | |||||
| Liberal | William Lawrence | 22,894 | 64.9 | +64.9 | |
| Labor | Cyril Sudholz | 12,394 | 35.1 | -5.6 | |
| Liberal gain from Country | Swing | +5.6 | |||
Yarra
- This section is an excerpt from Electoral results for the Division of Yarra § 1949
| Party | Candidate | Votes | % | ±% | |
|---|---|---|---|---|---|
| Labor | Stan Keon | 23,211 | 58.8 | -1.8 | |
| Liberal | Charles Barrington | 14,189 | 35.9 | +2.9 | |
| Communist | John Prescott | 1,098 | 2.8 | -3.1 | |
| Independent | Wenham Vines | 991 | 2.5 | +2.5 | |
| Total formal votes | 39,489 | 97.5 | |||
| Informal votes | 1,018 | 2.5 | |||
| Turnout | 40,507 | 95.4 | |||
| Two-party-preferred result | |||||
| Labor | Stan Keon | 62.7 | -3.7 | ||
| Liberal | Charles Barrington | 37.3 | +3.7 | ||
| Labor hold | Swing | -3.7 | |||
Queensland
| |||||||||||||||||||||||||||||||
All 18 Queensland seats in the House of Representatives 9 seats needed for a majority | |||||||||||||||||||||||||||||||
|---|---|---|---|---|---|---|---|---|---|---|---|---|---|---|---|---|---|---|---|---|---|---|---|---|---|---|---|---|---|---|---|
| |||||||||||||||||||||||||||||||
Bowman
- This section is an excerpt from Electoral results for the Division of Bowman § 1949
| Party | Candidate | Votes | % | ±% | |
|---|---|---|---|---|---|
| Liberal | Malcolm McColm | 20,090 | 53.4 | +6.1 | |
| Labor | Wilfred Coutts | 16,886 | 44.9 | −7.8 | |
| Communist | Mabel Hanson | 656 | 1.7 | +1.7 | |
| Total formal votes | 37,632 | 97.7 | |||
| Informal votes | 877 | 2.3 | |||
| Turnout | 38,509 | 95.4 | |||
| Two-party-preferred result | |||||
| Liberal | Malcolm McColm | 53.8 | +6.5 | ||
| Labor | Wilfred Coutts | 46.2 | −6.5 | ||
| Liberal notional gain from Labor | Swing | −1.4 | |||
Brisbane
- This section is an excerpt from Electoral results for the Division of Brisbane § 1949
| Party | Candidate | Votes | % | ±% | |
|---|---|---|---|---|---|
| Labor | George Lawson | 18,890 | 52.3 | −7.4 | |
| Liberal | James Long | 15,269 | 42.3 | +6.0 | |
| Communist | Alby Graham | 1,954 | 5.4 | +5.4 | |
| Total formal votes | 36,113 | 97.3 | |||
| Informal votes | 1,021 | 2.7 | |||
| Turnout | 37,134 | 93.6 | |||
| Two-party-preferred result | |||||
| Labor | George Lawson | 57.3 | −6.4 | ||
| Liberal | James Long | 42.7 | +6.4 | ||
| Labor hold | Swing | −6.4 | |||
Capricornia
- This section is an excerpt from Electoral results for the Division of Capricornia § 1949
| Party | Candidate | Votes | % | ±% | |
|---|---|---|---|---|---|
| Liberal | Henry Pearce | 16,949 | 52.2 | −0.1 | |
| Labor | Mick Gardner | 15,121 | 46.6 | +2.1 | |
| Communist | Ted Robertson | 413 | 1.3 | +1.3 | |
| Total formal votes | 32,483 | 98.5 | |||
| Informal votes | 508 | 1.5 | |||
| Turnout | 32,991 | 96.6 | |||
| Two-party-preferred result | |||||
| Liberal | Henry Pearce | 52.3 | −2.3 | ||
| Labor | Mick Gardner | 47.7 | +2.3 | ||
| Liberal hold | Swing | −2.3 | |||
Darling Downs
- This section is an excerpt from Electoral results for the Division of Darling Downs § 1949
| Party | Candidate | Votes | % | ±% | |
|---|---|---|---|---|---|
| Liberal | Reginald Swartz | 21,261 | 58.9 | +58.9 | |
| Labor | James Kane | 11,281 | 31.2 | -5.0 | |
| Independent | Charles Farquharson | 3,041 | 8.4 | +8.4 | |
| Communist | Raymond Mullaly | 281 | 0.8 | +0.8 | |
| Independent | Charles Lacaze | 260 | 0.7 | +0.7 | |
| Total formal votes | 36,124 | 98.4 | |||
| Informal votes | 587 | 1.6 | |||
| Turnout | 36,711 | 97.2 | |||
| Two-party-preferred result | |||||
| Liberal | Reginald Swartz | 62.5 | +62.5 | ||
| Labor | James Kane | 37.5 | -1.9 | ||
| Liberal gain from Country | Swing | +1.9 | |||
Dawson
- This section is an excerpt from Electoral results for the Division of Dawson § 1949
| Party | Candidate | Votes | % | ±% | |
|---|---|---|---|---|---|
| Country | Charles Davidson | 19,302 | 58.4 | +12.3 | |
| Labor | George Burns | 12,389 | 37.5 | -5.3 | |
| Communist | Richard Andrew | 1,379 | 4.2 | -3.5 | |
| Total formal votes | 33,070 | 98.0 | |||
| Informal votes | 659 | 2.0 | |||
| Turnout | 33,729 | 93.5 | |||
| Two-party-preferred result | |||||
| Country | Charles Davidson | 58.6 | +9.8 | ||
| Labor | George Burns | 41.4 | -9.8 | ||
| Country notional gain from Labor | Swing | +9.8 | |||
Fisher
- This section is an excerpt from Electoral results for the Division of Fisher § 1949
| Party | Candidate | Votes | % | ±% | |
|---|---|---|---|---|---|
| Country | Charles Adermann | 26,630 | 66.5 | +5.3 | |
| Labor | Edmund Roberts | 9,980 | 24.9 | -2.2 | |
| Independent | Norman Logan | 3,419 | 8.5 | +8.5 | |
| Total formal votes | 40,029 | 98.9 | |||
| Informal votes | 453 | 1.1 | |||
| Turnout | 40,482 | 94.9 | |||
| Two-party-preferred result | |||||
| Country | Charles Adermann | 70.7 | +4.1 | ||
| Labor | Edmund Roberts | 29.3 | -4.1 | ||
| Country notional hold | Swing | +4.1 | |||
Griffith
- This section is an excerpt from Electoral results for the Division of Griffith § 1949
| Party | Candidate | Votes | % | ±% | |
|---|---|---|---|---|---|
| Liberal | Doug Berry | 18,381 | 51.7 | +1.3 | |
| Labor | William Conelan | 16,464 | 46.3 | -3.3 | |
| Communist | Anna Slater | 727 | 2.0 | +2.0 | |
| Total formal votes | 35,572 | 96.8 | |||
| Informal votes | 1,179 | 3.2 | |||
| Turnout | 36,751 | 95.2 | |||
| Two-party-preferred result | |||||
| Liberal | Doug Berry | 51.9 | +1.5 | ||
| Labor | William Conelan | 48.1 | -1.5 | ||
| Liberal hold | Swing | +1.5 | |||
Herbert
- This section is an excerpt from Electoral results for the Division of Herbert § 1949
| Party | Candidate | Votes | % | ±% | |
|---|---|---|---|---|---|
| Labor | Bill Edmonds | 17,395 | 49.4 | +1.0 | |
| Country | Doug Jeffrey | 15,973 | 45.4 | +13.0 | |
| Communist | Jim Henderson | 1,847 | 5.2 | -10.6 | |
| Total formal votes | 35,215 | 96.8 | |||
| Informal votes | 1,160 | 3.2 | |||
| Turnout | 36,375 | 93.1 | |||
| Two-party-preferred result | |||||
| Labor | Bill Edmonds | 18,898 | 53.7 | -10.4 | |
| Country | Doug Jeffrey | 16,317 | 46.3 | +10.4 | |
| Labor hold | Swing | -10.4 | |||
Kennedy
- This section is an excerpt from Electoral results for the Division of Kennedy § 1949
| Party | Candidate | Votes | % | ±% | |
|---|---|---|---|---|---|
| Labor | Bill Riordan | 15,127 | 55.1 | -3.2 | |
| Country | Ulick Browne | 11,397 | 41.5 | +4.6 | |
| Communist | Eric Wyper | 947 | 3.4 | -0.4 | |
| Total formal votes | 27,471 | 98.1 | |||
| Informal votes | 533 | 1.9 | |||
| Turnout | 28,004 | 89.3 | |||
| Two-party-preferred result | |||||
| Labor | Bill Riordan | 58.4 | -3.7 | ||
| Country | Ulick Browne | 41.6 | +3.7 | ||
| Labor hold | Swing | -3.7 | |||
Leichhardt
- This section is an excerpt from Electoral results for the Division of Leichhardt § 1949
| Party | Candidate | Votes | % | ±% | |
|---|---|---|---|---|---|
| Country | Tom Gilmore | 16,291 | 49.6 | +8.0 | |
| Labor | Cecil Holdcroft | 13,894 | 42.3 | -11.2 | |
| Communist | Ralph Leinster | 1,141 | 3.5 | -0.7 | |
| Independent | Thomas Mackey | 1,106 | 3.4 | +3.4 | |
| Independent | Leslie Keough | 424 | 1.3 | +1.3 | |
| Total formal votes | 32,856 | 95.8 | |||
| Informal votes | 1,427 | 4.2 | |||
| Turnout | 34,283 | 91.5 | |||
| Two-party-preferred result | |||||
| Country | Tom Gilmore | 51.7 | +9.2 | ||
| Labor | Cecil Holdcroft | 48.3 | -9.2 | ||
| Country notional gain from Labor | Swing | +9.2 | |||
Lilley
- This section is an excerpt from Electoral results for the Division of Lilley § 1949
| Party | Candidate | Votes | % | ±% | |
|---|---|---|---|---|---|
| Liberal | Bruce Wight | 22,488 | 59.4 | +15.2 | |
| Labor | Jim Hadley | 15,368 | 40.6 | -4.2 | |
| Total formal votes | 37,856 | 98.1 | |||
| Informal votes | 727 | 1.9 | |||
| Turnout | 38,583 | 94.1 | |||
| Liberal hold | Swing | +9.2 | |||
Maranoa
- This section is an excerpt from Electoral results for the Division of Maranoa § 1949
| Party | Candidate | Votes | % | ±% | |
|---|---|---|---|---|---|
| Country | Charles Russell | 18,652 | 59.6 | +6.3 | |
| Labor | Martin Laracy | 12,657 | 40.4 | -1.6 | |
| Total formal votes | 31,309 | 98.9 | |||
| Informal votes | 335 | 1.1 | |||
| Turnout | 31,644 | 93.8 | |||
| Country hold | Swing | +3.8 | |||
McPherson
- This section is an excerpt from Electoral results for the Division of McPherson § 1949
| Party | Candidate | Votes | % | ±% | |
|---|---|---|---|---|---|
| Country | Arthur Fadden | 24,263 | 74.2 | +46.6 | |
| Labor | John Hilton | 8,436 | 25.8 | -5.1 | |
| Total formal votes | 32,699 | 98.4 | |||
| Informal votes | 521 | 1.6 | |||
| Turnout | 33,220 | 94.0 | |||
| Country notional gain from Liberal | Swing | +5.1 | |||
Moreton
- This section is an excerpt from Electoral results for the Division of Moreton § 1949
| Party | Candidate | Votes | % | ±% | |
|---|---|---|---|---|---|
| Liberal | Josiah Francis | 25,125 | 61.4 | +8.1 | |
| Labor | William Thieme | 14,915 | 36.4 | -5.6 | |
| Communist | Bill Yarrow | 904 | 2.2 | +2.2 | |
| Total formal votes | 40,944 | 97.9 | |||
| Informal votes | 867 | 2.1 | |||
| Turnout | 41,811 | 95.2 | |||
| Two-party-preferred result | |||||
| Liberal | Josiah Francis | 61.6 | +0.8 | ||
| Labor | William Thieme | 38.4 | -0.8 | ||
| Liberal hold | Swing | +0.8 | |||
Oxley
- This section is an excerpt from Electoral results for the Division of Oxley § 1949
| Party | Candidate | Votes | % | ±% | |
|---|---|---|---|---|---|
| Liberal | Donald Cameron | 14,895 | 42.1 | +8.9 | |
| Labor | Evan Marginson | 14,268 | 40.3 | +0.2 | |
| Country | John Martin | 5,658 | 16.0 | -11.0 | |
| Communist | Wallace Dawson | 576 | 1.6 | +1.6 | |
| Total formal votes | 35,397 | 98.0 | |||
| Informal votes | 726 | 2.0 | |||
| Turnout | 36,123 | 96.7 | |||
| Two-party-preferred result | |||||
| Liberal | Donald Cameron | 20,097 | 56.8 | -3.0 | |
| Labor | Evan Marginson | 15,300 | 43.2 | +3.0 | |
| Liberal notional hold | Swing | -3.0 | |||
Petrie
- This section is an excerpt from Electoral results for the Division of Petrie § 1949
| Party | Candidate | Votes | % | ±% | |
|---|---|---|---|---|---|
| Liberal | Alan Hulme | 23,803 | 59.7 | +14.6 | |
| Labor | Samuel Martin | 14,593 | 36.6 | -7.4 | |
| Independent | James Ryan | 1,488 | 3.7 | +3.7 | |
| Total formal votes | 39,884 | 98.3 | |||
| Informal votes | 683 | 1.7 | |||
| Turnout | 40,567 | 94.5 | |||
| Two-party-preferred result | |||||
| Liberal | Alan Hulme | 61.6 | +10.8 | ||
| Labor | Samuel Martin | 38.4 | -10.8 | ||
| Liberal notional hold | Swing | +10.8 | |||
Ryan
- This section is an excerpt from Electoral results for the Division of Ryan § 1949
| Party | Candidate | Votes | % | ±% | |
|---|---|---|---|---|---|
| Liberal | Nigel Drury | 24,917 | 60.3 | +17.3 | |
| Labor | Leonard Eastment | 16,431 | 39.7 | -6.6 | |
| Total formal votes | 41,348 | 98.2 | |||
| Informal votes | 755 | 1.8 | |||
| Turnout | 42,103 | 94.3 | |||
| Liberal notional hold | Swing | +9.2 | |||
Wide Bay
- This section is an excerpt from Electoral results for the Division of Wide Bay § 1949
| Party | Candidate | Votes | % | ±% | |
|---|---|---|---|---|---|
| Country | Bernard Corser | 22,037 | 56.5 | +9.0 | |
| Labor | Samuel Round | 10,941 | 28.0 | -7.9 | |
| Independent | Robert McDowell | 6,037 | 15.5 | +15.5 | |
| Total formal votes | 39,015 | 98.6 | |||
| Informal votes | 572 | 1.4 | |||
| Turnout | 39,587 | 96.7 | |||
| Two-party-preferred result | |||||
| Country | Bernard Corser | 64.3 | +8.9 | ||
| Labor | Samuel Round | 35.7 | -8.9 | ||
| Country hold | Swing | +8.9 | |||
South Australia
| |||||||||||||||||||||||||||||||
All 10 SA seats in the House of Representatives 5 seats needed for a majority | |||||||||||||||||||||||||||||||
|---|---|---|---|---|---|---|---|---|---|---|---|---|---|---|---|---|---|---|---|---|---|---|---|---|---|---|---|---|---|---|---|
| |||||||||||||||||||||||||||||||
Adelaide
- This section is an excerpt from Electoral results for the Division of Adelaide § 1949
| Party | Candidate | Votes | % | ±% | |
|---|---|---|---|---|---|
| Labor | Cyril Chambers | 23,823 | 59.8 | −2.1 | |
| Liberal | Basil Harford | 14,820 | 37.2 | +3.8 | |
| Communist | Elsie Watt | 683 | 1.7 | −3.0 | |
| Independent | Christopher Doherty | 504 | 1.3 | +1.3 | |
| Total formal votes | 39,830 | 96.9 | |||
| Informal votes | 1,260 | 3.1 | |||
| Turnout | 41,090 | 96.8 | |||
| Two-party-preferred result | |||||
| Labor | Cyril Chambers | 62.1 | −4.0 | ||
| Liberal | Basil Harford | 37.9 | +4.0 | ||
| Labor hold | Swing | −4.0 | |||
Angas
- This section is an excerpt from Electoral results for the Division of Angas (1949–1977) § 1949
| Party | Candidate | Votes | % | ±% | |
|---|---|---|---|---|---|
| Liberal | Alick Downer | 23,987 | 60.8 | +8.9 | |
| Labor | Albert Strachan | 13,615 | 34.5 | −10.3 | |
| Independent | Ralph Whittle | 1,857 | 4.7 | +4.7 | |
| Total formal votes | 39,459 | 97.6 | |||
| Informal votes | 965 | 2.4 | |||
| Turnout | 40,424 | 97.2 | |||
| Two-party-preferred result | |||||
| Liberal | Alick Downer | 63.1 | +8.1 | ||
| Labor | Albert Strachan | 36.9 | −8.1 | ||
| Liberal notional hold | Swing | +8.1 | |||
Barker
- This section is an excerpt from Electoral results for the Division of Barker § 1949
| Party | Candidate | Votes | % | ±% | |
|---|---|---|---|---|---|
| Liberal | Archie Cameron | 26,034 | 64.5 | +11.6 | |
| Labor | John Klar | 13,354 | 33.1 | −9.6 | |
| Independent | John Gartner | 1,004 | 2.5 | +2.5 | |
| Total formal votes | 40,392 | 98.3 | |||
| Informal votes | 706 | 1.7 | |||
| Turnout | 41,098 | 97.6 | |||
| Two-party-preferred result | |||||
| Liberal | Archie Cameron | 65.8 | +10.8 | ||
| Labor | John Klar | 34.2 | −10.8 | ||
| Liberal hold | Swing | +10.8 | |||
Boothby
- This section is an excerpt from Electoral results for the Division of Boothby § 1949
| Party | Candidate | Votes | % | ±% | |
|---|---|---|---|---|---|
| Liberal | John McLeay | 24,897 | 61.3 | +9.3 | |
| Labor | Ralph Wells | 15,714 | 38.7 | −9.3 | |
| Total formal votes | 40,611 | 97.9 | |||
| Informal votes | 886 | 2.1 | |||
| Turnout | 41,497 | 96.6 | |||
| Liberal hold | Swing | +9.3 | |||
Grey
- This section is an excerpt from Electoral results for the Division of Grey § 1949
| Party | Candidate | Votes | % | ±% | |
|---|---|---|---|---|---|
| Labor | Edgar Russell | 20,465 | 54.4 | -6.1 | |
| Liberal | Edward Andrews | 17,145 | 45.6 | +6.1 | |
| Total formal votes | 37,610 | 98.3 | |||
| Informal votes | 656 | 1.7 | |||
| Turnout | 38,266 | 95.5 | |||
| Labor hold | Swing | -6.1 | |||
Hindmarsh
- This section is an excerpt from Electoral results for the Division of Hindmarsh § 1949
| Party | Candidate | Votes | % | ±% | |
|---|---|---|---|---|---|
| Labor | Clyde Cameron | 29,260 | 69.7 | +2.8 | |
| Liberal | Albert Turnbull | 12,736 | 30.3 | +6.4 | |
| Total formal votes | 41,996 | 97.5 | |||
| Informal votes | 1,096 | 2.5 | |||
| Turnout | 43,092 | 97.1 | |||
| Labor hold | Swing | -5.4 | |||
Kingston
- This section is an excerpt from Electoral results for the Division of Kingston § 1949
| Party | Candidate | Votes | % | ±% | |
|---|---|---|---|---|---|
| Liberal | Jim Handby | 23,713 | 51.6 | +9.3 | |
| Labor | Thomas Sheehy | 22,233 | 48.4 | -7.6 | |
| Total formal votes | 45,946 | 97.8 | |||
| Informal votes | 1,057 | 2.2 | |||
| Turnout | 47,003 | 97.1 | |||
| Liberal notional gain from Labor | Swing | +8.4 | |||
Port Adelaide
- This section is an excerpt from Electoral results for the Division of Port Adelaide § 1949
| Party | Candidate | Votes | % | ±% | |
|---|---|---|---|---|---|
| Labor | Albert Thompson | 31,977 | 71.5 | +0.0 | |
| Liberal | Frederick Boscombe | 11,879 | 26.5 | +8.1 | |
| Communist | Peter Symon | 889 | 2.0 | -8.1 | |
| Total formal votes | 44,745 | 97.9 | |||
| Informal votes | 950 | 2.1 | |||
| Turnout | 45,695 | 96.2 | |||
| Two-party-preferred result | |||||
| Labor | Albert Thompson | 73.3 | -7.3 | ||
| Liberal | Frederick Boscombe | 26.7 | +7.3 | ||
| Labor notional hold | Swing | -7.3 | |||
Sturt
- This section is an excerpt from Electoral results for the Division of Sturt § 1949
| Party | Candidate | Votes | % | ±% | |
|---|---|---|---|---|---|
| Liberal | Keith Wilson | 21,157 | 50.8 | +7.2 | |
| Labor | Leslie McMullin | 18,828 | 45.2 | -8.8 | |
| Independent | Leonard Smith | 1,628 | 3.9 | +3.9 | |
| Total formal votes | 41,613 | 97.4 | |||
| Informal votes | 1,123 | 2.6 | |||
| Turnout | 42,736 | 96.6 | |||
| Two-party-preferred result | |||||
| Liberal | Keith Wilson | 52.8 | +8.9 | ||
| Labor | Leslie McMullin | 47.2 | -8.9 | ||
| Liberal notional gain from Labor | Swing | +8.9 | |||
Wakefield
- This section is an excerpt from Electoral results for the Division of Wakefield § 1949
| Party | Candidate | Votes | % | ±% | |
|---|---|---|---|---|---|
| Liberal | Philip McBride | 23,847 | 61.4 | +8.3 | |
| Labor | Cyril Hasse | 15,008 | 38.6 | -7.2 | |
| Total formal votes | 38,855 | 98.3 | |||
| Informal votes | 681 | 1.7 | |||
| Turnout | 39,536 | 97.4 | |||
| Liberal hold | Swing | +7.8 | |||
Western Australia
| |||||||||||||||||||||||||||||||
All 8 WA seats in the House of Representatives 4 seats needed for a majority | |||||||||||||||||||||||||||||||
|---|---|---|---|---|---|---|---|---|---|---|---|---|---|---|---|---|---|---|---|---|---|---|---|---|---|---|---|---|---|---|---|
| |||||||||||||||||||||||||||||||
Canning
- This section is an excerpt from Electoral results for the Division of Canning § 1949
| Party | Candidate | Votes | % | ±% | |
|---|---|---|---|---|---|
| Country | Len Hamilton | 12,159 | 36.8 | -20.1 | |
| Liberal | William Gillespie | 10,244 | 31.0 | +31.0 | |
| Labor | Thomas Scaddan | 10,002 | 30.3 | -12.8 | |
| Independent Country | Arthur Neville | 594 | 1.8 | +1.8 | |
| Total formal votes | 32,999 | 97.5 | |||
| Informal votes | 842 | 2.5 | |||
| Turnout | 33,841 | 95.6 | |||
| Two-party-preferred result | |||||
| Country | Len Hamilton | 17,640 | 53.5 | -3.4 | |
| Liberal | William Gillespie | 15,359 | 46.5 | +46.5 | |
| Country notional hold | Swing | -3.4 | |||
Curtin
- This section is an excerpt from Electoral results for the Division of Curtin § 1949
| Party | Candidate | Votes | % | ±% | |
|---|---|---|---|---|---|
| Liberal | Paul Hasluck | 24,857 | 61.2 | +15.7 | |
| Labor | William Lonnie | 15,781 | 38.8 | −12.6 | |
| Total formal votes | 40,638 | 98.1 | |||
| Informal votes | 803 | 1.9 | |||
| Turnout | 41,441 | 95.1 | |||
| Liberal notional gain from Labor | Swing | +13.8 | |||
Forrest
- This section is an excerpt from Electoral results for the Division of Forrest § 1949
| Party | Candidate | Votes | % | ±% | |
|---|---|---|---|---|---|
| Labor | Nelson Lemmon | 15,935 | 43.8 | -7.8 | |
| Country | Arnold Potts | 10,003 | 27.5 | +6.3 | |
| Liberal | Gordon Freeth | 9,828 | 27.0 | -0.2 | |
| Independent | James Bolitho | 642 | 1.8 | +1.8 | |
| Total formal votes | 36,408 | 98.0 | |||
| Informal votes | 749 | 2.0 | |||
| Turnout | 37,157 | 97.5 | |||
| Two-party-preferred result | |||||
| Liberal | Gordon Freeth | 19,217 | 52.8 | +4.4 | |
| Labor | Nelson Lemmon | 17,191 | 47.2 | -4.4 | |
| Liberal gain from Labor | Swing | +4.4 | |||
Fremantle
- This section is an excerpt from Electoral results for the Division of Fremantle § 1949
| Party | Candidate | Votes | % | ±% | |
|---|---|---|---|---|---|
| Labor | Kim Beazley Sr. | 22,463 | 54.7 | -9.8 | |
| Liberal | Billy Snedden | 17,918 | 43.6 | +8.1 | |
| Communist | Paddy Troy | 675 | 1.6 | +1.6 | |
| Total formal votes | 41,056 | 97.9 | |||
| Informal votes | 862 | 2.1 | |||
| Turnout | 41,918 | 96.4 | |||
| Two-party-preferred result | |||||
| Labor | Kim Beazley Sr. | 56.2 | -8.3 | ||
| Liberal | Billy Snedden | 43.8 | +8.3 | ||
| Labor hold | Swing | -8.3 | |||
Kalgoorlie
- This section is an excerpt from Electoral results for the Division of Kalgoorlie § 1949
| Party | Candidate | Votes | % | ±% | |
|---|---|---|---|---|---|
| Labor | Herbert Johnson | 18,127 | 62.4 | -9.3 | |
| Liberal | John Porteus | 10,902 | 37.6 | +9.3 | |
| Total formal votes | 29,029 | 97.8 | |||
| Informal votes | 653 | 2.2 | |||
| Turnout | 29,682 | 93.9 | |||
| Labor hold | Swing | -9.3 | |||
Moore
- This section is an excerpt from Electoral results for the Division of Moore § 1949
| Party | Candidate | Votes | % | ±% | |
|---|---|---|---|---|---|
| Labor | Kevin Byrne | 12,282 | 38.0 | -7.0 | |
| Country | Hugh Leslie | 12,244 | 37.8 | -17.2 | |
| Liberal | Ken Jones | 7,836 | 24.2 | +24.2 | |
| Total formal votes | 32,362 | 97.3 | |||
| Informal votes | 894 | 2.7 | |||
| Turnout | 33,256 | 94.5 | |||
| Two-party-preferred result | |||||
| Country | Hugh Leslie | 19,098 | 59.0 | +4.0 | |
| Labor | Kevin Byrne | 13,264 | 41.0 | -4.0 | |
| Country notional hold | Swing | +4.0 | |||
Perth
- This section is an excerpt from Electoral results for the Division of Perth § 1949
| Party | Candidate | Votes | % | ±% | |
|---|---|---|---|---|---|
| Labor | Tom Burke | 18,412 | 47.8 | -7.7 | |
| Liberal | Gordon Hack | 17,858 | 46.4 | +10.9 | |
| Independent | James Collins | 1,756 | 4.6 | +4.6 | |
| Communist | James Kelly | 486 | 1.3 | -2.3 | |
| Total formal votes | 38,512 | 97.5 | |||
| Informal votes | 992 | 2.5 | |||
| Turnout | 39,504 | 94.9 | |||
| Two-party-preferred result | |||||
| Labor | Tom Burke | 19,294 | 50.1 | -11.3 | |
| Liberal | Gordon Hack | 19,218 | 49.9 | +11.3 | |
| Labor hold | Swing | -11.3 | |||
Swan
- This section is an excerpt from Electoral results for the Division of Swan § 1949
| Party | Candidate | Votes | % | ±% | |
|---|---|---|---|---|---|
| Liberal | Bill Grayden | 22,821 | 52.4 | +11.1 | |
| Labor | Harry Webb | 20,699 | 47.6 | -9.1 | |
| Total formal votes | 43,520 | 97.7 | |||
| Informal votes | 1,010 | 2.3 | |||
| Turnout | 44,530 | 95.2 | |||
| Liberal gain from Labor | Swing | +10.2 | |||
Tasmania
| |||||||||||||||||||||||||||||||
All 5 Tasmanian seats in the House of Representatives 3 seats needed for a majority | |||||||||||||||||||||||||||||||
|---|---|---|---|---|---|---|---|---|---|---|---|---|---|---|---|---|---|---|---|---|---|---|---|---|---|---|---|---|---|---|---|
| |||||||||||||||||||||||||||||||
Bass
- This section is an excerpt from Electoral results for the Division of Bass § 1949
| Party | Candidate | Votes | % | ±% | |
|---|---|---|---|---|---|
| Liberal | Bruce Kekwick | 15,686 | 50.6 | +6.8 | |
| Labor | Claude Barnard | 15,312 | 49.4 | −6.8 | |
| Total formal votes | 30,998 | 97.3 | |||
| Informal votes | 865 | 2.7 | |||
| Turnout | 31,863 | 96.9 | |||
| Liberal gain from Labor | Swing | +6.8 | |||
Darwin
- This section is an excerpt from Electoral results for the Division of Darwin § 1949
| Party | Candidate | Votes | % | ±% | |
|---|---|---|---|---|---|
| Liberal | Dame Enid Lyons | 16,455 | 56.6 | +3.3 | |
| Labor | Harold Kirkpatrick | 12,602 | 43.4 | -3.3 | |
| Total formal votes | 29,057 | 97.6 | |||
| Informal votes | 728 | 2.4 | |||
| Turnout | 29,785 | 96.8 | |||
| Liberal hold | Swing | +3.3 | |||
Denison
- This section is an excerpt from Electoral results for the Division of Denison § 1949
| Party | Candidate | Votes | % | ±% | |
|---|---|---|---|---|---|
| Liberal | Athol Townley | 16,431 | 55.1 | +10.9 | |
| Labor | Henry Cosgrove | 13,394 | 44.9 | -10.9 | |
| Total formal votes | 29,825 | 98.0 | |||
| Informal votes | 614 | 2.0 | |||
| Turnout | 30,439 | 94.3 | |||
| Liberal gain from Labor | Swing | +10.9 | |||
Franklin
- This section is an excerpt from Electoral results for the Division of Franklin § 1949
| Party | Candidate | Votes | % | ±% | |
|---|---|---|---|---|---|
| Liberal | Bill Falkinder | 17,644 | 58.0 | +6.9 | |
| Labor | Jack Frost | 12,790 | 42.0 | -6.9 | |
| Total formal votes | 30,434 | 97.4 | |||
| Informal votes | 822 | 2.6 | |||
| Turnout | 31,256 | 96.7 | |||
| Liberal hold | Swing | +6.9 | |||
Wilmot
- This section is an excerpt from Electoral results for the Division of Wilmot § 1949
| Party | Candidate | Votes | % | ±% | |
|---|---|---|---|---|---|
| Labor | Gil Duthie | 16,150 | 52.6 | +0.9 | |
| Liberal | Rickman Furmage | 14,532 | 47.4 | -0.9 | |
| Total formal votes | 30,682 | 96.7 | |||
| Informal votes | 1,036 | 3.3 | |||
| Turnout | 31,718 | 95.3 | |||
| Labor hold | Swing | +0.9 | |||
Territories
Australian Capital Territory
| ||||||||||||||||||||||
Division of Australian Capital Territory | ||||||||||||||||||||||
|---|---|---|---|---|---|---|---|---|---|---|---|---|---|---|---|---|---|---|---|---|---|---|
| ||||||||||||||||||||||
- This section is an excerpt from Electoral results for the Division of Australian Capital Territory § 1949
| Party | Candidate | Votes | % | ±% | |
|---|---|---|---|---|---|
| Labor | Sidney Rhodes | 4,823 | 43.2 | +43.2 | |
| Independent | Lewis Nott | 3,475 | 31.1 | +31.1 | |
| Liberal | Malcolm Moir | 2,510 | 22.5 | +22.5 | |
| Independent | Jessie Ashton | 366 | 3.3 | +3.3 | |
| Total formal votes | 11,174 | 99.4 | |||
| Informal votes | 68 | 0.6 | |||
| Turnout | 11,242 | 94.9 | |||
| Two-party-preferred result | |||||
| Independent | Lewis Nott | 6,013 | 53.8 | +53.8 | |
| Labor | Sidney Rhodes | 5,161 | 46.2 | +46.2 | |
| Independent win | (new seat) | ||||
Northern Territory
- This section is an excerpt from Electoral results for the Division of Northern Territory § 1949
| Party | Candidate | Votes | % | ±% | |
|---|---|---|---|---|---|
| Labor | Jock Nelson | 2,303 | 44.3 | +21.9 | |
| Independent | Adair Blain | 1,932 | 37.2 | -5.2 | |
| Independent (Non-Socialist) Labor | Victor Webster | 961 | 18.5 | +18.5 | |
| Total formal votes | 5,196 | 97.7 | |||
| Informal votes | 122 | 2.3 | |||
| Turnout | 5,318 | 80.7 | |||
| Two-party-preferred result | |||||
| Labor | Jock Nelson | 2,737 | 52.7 | +52.7 | |
| Independent | Adair Blain | 2,459 | 47.3 | -8.6 | |
| Labor gain from Independent | Swing | +8.6 | |||
See also
- Candidates of the 1949 Australian federal election
- Members of the Australian House of Representatives, 1949–1951
Notes
- ^ Including Northern Territory
- ^ Including Australian Capital Territory
References
- ^ "1949 House of Representatives". Psephos Adam Carr's Election Archive. Retrieved 29 May 2022.
- ^ a b c d e f g h i j k l m n o p q r s t u "1949 House of Representatives: NSW". Psephos Adam Carr's Election Archive. Retrieved 29 May 2022.
- ^ a b c d "1949 House of Representatives: Victoria". Psephos Adam Carr's Election Archive. Retrieved 29 May 2022.
- ^ "1949 House of Representatives: Queensland". Psephos Adam Carr's Election Archive. Retrieved 29 May 2022.
- ^ a b "1949 House of Representatives: South Australia". Psephos Adam Carr's Election Archive. Retrieved 29 May 2022.
- ^ "1949 House of Representatives: Western Australia". Psephos Adam Carr's Election Archive. Retrieved 29 May 2022.
- ^ a b c d e "1949 House of Representatives: Tasmania". Psephos Adam Carr's Election Archive. Retrieved 29 May 2022.
- ^ "1949 House of Representatives: Australian Capital Territory". Psephos Adam Carr's Election Archive. Retrieved 29 May 2022.
- ^ "1949 House of Representatives: Northern Territory". Psephos Adam Carr's Election Archive. Retrieved 29 May 2022.
| House of Representatives | |||
|---|---|---|---|
| Senate | |||
| By-elections | |||