To install click the Add extension button. That's it.

The source code for the WIKI 2 extension is being checked by specialists of the Mozilla Foundation, Google, and Apple. You could also do it yourself at any point in time.

4,5
Kelly Slayton
Congratulations on this excellent venture… what a great idea!
Alexander Grigorievskiy
I use WIKI 2 every day and almost forgot how the original Wikipedia looks like.
Live Statistics
English Articles
Improved in 24 Hours
Added in 24 Hours
Languages
Recent
Show all languages
What we do. Every page goes through several hundred of perfecting techniques; in live mode. Quite the same Wikipedia. Just better.
.
Leo
Newton
Brights
Milds

Membership statistics of the Church of Jesus Christ of Latter-day Saints (United States)

From Wikipedia, the free encyclopedia


The Church of Jesus Christ of Latter-day Saints in the United States
Members6,868,793 (2023)[1]
Stakes1,693
Districts6
Wards12,792
Branches1,801
Total Congregations[2]14,593
Missions110
Temples83 Operating
25 Under Construction
22 Announced
130 Total
Family History Centers1,864[3]
Recent Membership History
YearMembers
20126,321,416 (2.02% of US total)
2013 6,398,889 (2.03% of US total)
2014 6,466,267 (2.03% of US total)
2015 6,531,656 (2.04% of US total)
2016 6,592,195 (2.04% of US total)
2017 6,641,886 (2.01% of US total)
2018 6,681,829 (2.01% of US total)
2019 6,721,032 (2.02% of US total)
*2020 6,742,000 (2.00% of US total)
2021 6,763,019 (2.01% of US total)
2022 6,804,028 (2.01% of US total)
Source: https://newsroom.churchofjesuschrist.org/facts-and-statistics/country/united-states (*2020 is an estimate since official numbers weren't released.)

This page shows the membership statistics of the Church of Jesus Christ of Latter-day Saints (LDS Church) within the United States.

  • Official LDS Membership - Membership count on record provided by the LDS Church. These records include adults and children, and also include both active and less active members.
  • From religious surveys - General religious surveys conducted within the United States. These surveyed U.S. adults about their religious beliefs.

YouTube Encyclopedic

  • 1/4
    Views:
    29 630
    158 024
    40 816
    42 595
  • The Mormon Corporation | The TRUTH & David A Bednar
  • An Inside Look at LDS Church Operations - Scott Dyer of Rameumptom Ruminations | Ep.1702
  • Stunning Stats on Saints - Evidences
  • Come Follow Me | 2 Nephi 11-19 | Lesson 9 - Isaiah's Warning to Latter-day Saints

Transcription

Membership defined

Membership reported by the Church of Jesus Christ of Latter-day Saints on December 31, 2022, was used to determine the number of members in each state.[1] The church defines membership as:[4]

  • "Those who have been baptized and confirmed."
  • "Those under age nine who have been blessed but not baptized."
  • "Those who are not accountable because of intellectual disabilities, regardless of age."
  • "Unblessed children under 8 when both of the following apply:
    • "At least one parent or one grandparent is a member of the Church."
    • "Both parents give permission for a record to be created. (If only one parent has legal custody of the child, the permission of that parent is sufficient.)"

The United States Census Bureau 2022 population estimates was used as the basis for the general population.[5] Each state link gives a brief history and additional membership information for that state.

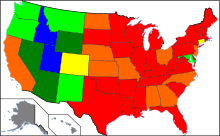
LDS membership as percentage of population by US states (2021)
LDS membership in absolute numbers, by US states (2021)

Table

Congregational

State Area Temples Mis­sions Stakes Dis­tricts Con­gre­ga­tions FHC
O U A T Wards Bran­ches Total
Alabama
NA Southeast 1 0 0 1 1 8 0 47 28 75 44
Alaska
NA West 1 0 1 2 1 9 0 60 22 82 15
Arizona
NA Southwest 6 0 1 7 6 117 0 835 89 924 74
Arkansas
NA Southeast 0 1 0 1 2 7 0 51 23 74 25
California
NA West 7 2 3 12 15 147 0 977 135 1,112 228
Colorado
NA Central 2 1 1 4 4 35 0 277 33 310 64
Connecticut
NA Northeast 1 0 0 1 0 3 0 28 6 34 10
Delaware
NA Northeast 0 0 0 0 0 2 0 10 2 12 3
District of Columbia
NA Northeast 0 0 0 0 0 0 0 4 0 4 1
Florida
NA Southeast 2 1 2 5 4 34 0 224 50 274 84
Georgia
NA Southeast 1 0 0 1 2 19 0 134 28 162 44
Hawaii
NA West 2 0 0 2 2 16 0 127 16 143 26
Idaho
NA Central 6 1 2 9 3 137 0 1,179 49 1,228 70
Illinois
NA Central 2 0 0 2 1 12 0 91 26 117 42
Indiana
NA Northeast 1 0 0 1 1 12 0 78 23 101 40
Iowa
NA Central 0 0 1 1 1 8 0 44 24 68 30
Kansas
NA Central 0 0 1 1 1 7 0 59 15 74 29
Kentucky
NA Southeast 1 0 0 1 1 8 0 51 32 83 28
Louisiana
NA Southeast 1 0 0 1 1 7 0 33 18 51 15
Maine
NA Northeast 0 0 0 0 0 2 0 18 8 26 10
Maryland
NA Northeast 1 0 0 1 2 10 0 65 17 82 14
Massachusetts
NA Northeast 1 0 0 1 1 7 0 42 15 57 18
Michigan
NA Northeast 1 0 1 2 2 9 1 62 37 99 43
Minnesota
NA Central 1 0 0 1 1 8 0 54 21 75 29
Mississippi
NA Southeast 0 0 0 0 0 4 0 30 19 49 20
Missouri
NA Central 2 0 1 3 2 18 0 138 26 164 51
Montana
NA Central 2 1 1 4 1 13 0 90 43 133 50
Nebraska
NA Central 1 0 0 1 1 5 0 42 15 57 18
Nevada
NA Southwest 2 1 1 4 3 43 0 306 37 343 34
New Hampshire
NA Northeast 0 0 0 0 1 3 0 14 4 18 6
New Jersey
NA Northeast 0 0 0 0 1 6 0 41 21 62 20
New Mexico
NA Southwest 1 1 0 2 2 14 0 104 33 137 31
New York
NA Northeast 2 0 0 2 2 17 1 96 49 145 65
North Carolina
NA Southeast 1 0 1 2 2 19 0 139 44 183 51
North Dakota
NA Central 1 0 0 1 1 3 0 20 6 26 7
Ohio
NA Northeast 1 0 2 3 2 15 0 101 26 127 46
Oklahoma
NA Southwest 1 0 0 1 1 9 0 75 20 95 30
Oregon
NA West 2 1 0 3 3 35 0 243 48 291 76
Pennsylvania
NA Northeast 1 1 1 3 2 13 0 80 27 107 46
Rhode Island
NA Northeast 0 0 0 0 0 1 0 8 1 9 1
South Carolina
NA Southeast 1 0 0 1 1 9 0 66 17 83 23
South Dakota
NA Central 0 0 0 0 0 2 0 14 17 31 13
Tennessee
NA Southeast 2 0 1 3 2 12 0 86 31 117 35
Texas
NA Southwest 4 1 3 8 10 79 2 622 129 751 138
Utah
Utah 18 11 0 29 10 629 2 5,102 315 5,417 170
Vermont
NA Northeast 0 0 0 0 0 1 0 8 4 12 8
Virginia
NA Northeast 1 0 1 2 2 22 0 173 37 210 46
Washington
NA West 4 0 2 6 7 60 0 428 54 482 97
West Virginia
NA Northeast 0 0 0 0 1 4 0 25 12 37 14
Wisconsin
NA Central 0 0 0 0 1 6 0 48 21 69 29
Wyoming
NA Central 1 1 1 3 0 19 0 143 29 172 46

Members and growth

State Area Members Population %LDS 2012 2022 Change Growth (%) % of Total Growth Pew ARDA
Alabama
NA Southeast 39,832 5,074,296 0.78% 35,708 39,832 4,124 11.55% 0.59% 1% 10th
Alaska
NA West 33,574 733,583 4.58% 33,033 33,574 541 1.64% 0.08% 5% 2nd
Arizona
NA Southwest 439,411 7,359,197 5.97% 414,261 439,411 25,150 6.07% 3.58% 5% 2nd
Arkansas
NA Southeast 35,405 3,045,637 1.16% 28,667 35,405 6,738 23.5% 0.96% 1% 9th
California
NA West 728,995 39,029,342 1.87% 777,061 728,995 −48,066 -6.19% -6.83% 1% 2nd
Colorado
NA Central 148,708 5,839,926 2.55% 147,707 148,708 1,001 0.68% 0.14% 2% 2nd
Connecticut
NA Northeast 15,838 3,626,205 0.44% 15,273 15,838 565 3.7% 0.08% 1% 10th
Delaware
NA Northeast 5,613 1,018,396 0.55% 5,080 5,613 533 10.49% 0.08% <1% 11th
District of Columbia
NA Northeast 3,168 671,803 0.47% 2,485 3,168 683 27.48% 0.1% 1% 39th
Florida
NA Southeast 168,527 22,244,823 0.76% 143,057 168,527 25,470 17.8% 3.62% 1% 8th
Georgia
NA Southeast 89,285 10,912,876 0.82% 80,548 89,285 8,737 10.85% 1.24% 1% 8th
Hawaii
NA West 74,952 1,440,196 5.2% 72,459 74,952 2,493 3.44% 0.35% 3% 2nd
Idaho
NA Central 473,894 1,939,033 24.44% 422,345 473,894 51,549 12.21% 7.33% 19% 1st
Illinois
NA Central 57,015 12,582,032 0.45% 56,531 57,015 484 0.86% 0.07% <1% 13th
Indiana
NA Northeast 46,823 6,833,037 0.69% 42,147 46,823 4,676 11.09% 0.66% 1% 13th
Iowa
NA Central 28,697 3,200,517 0.9% 26,001 28,697 2,696 10.37% 0.38% <1% 13th
Kansas
NA Central 39,356 2,937,150 1.34% 35,627 39,356 3,729 10.47% 0.53% 1% 10th
Kentucky
NA Southeast 37,830 4,512,310 0.84% 33,455 37,830 4,375 13.08% 0.62% <1% 8th
Louisiana
NA Southeast 29,727 4,590,241 0.65% 29,366 29,727 361 1.23% 0.05% <1% 6th
Maine
NA Northeast 11,054 1,385,340 0.8% 10,778 11,054 276 2.56% 0.04% 2% 6th
Maryland
NA Northeast 43,296 6,164,660 0.7% 43,227 43,296 69 0.16% 0.01% 1% 8th
Massachusetts
NA Northeast 28,197 6,981,974 0.4% 25,996 28,197 2,201 8.47% 0.31% 1% 11th
Michigan
NA Northeast 45,547 10,034,113 0.45% 43,178 45,547 2,369 5.49% 0.34% <1% 13th
Minnesota
NA Central 33,365 5,717,184 0.58% 31,298 33,365 2,067 6.6% 0.29% 1% 12th
Mississippi
NA Southeast 22,189 2,940,057 0.75% 21,704 22,189 485 2.23% 0.07% 1% 10th
Missouri
NA Central 77,959 6,177,957 1.26% 67,943 77,959 10,016 14.74% 1.42% 1% 8th
Montana
NA Central 51,715 1,122,867 4.61% 47,854 51,715 3,861 8.07% 0.55% 4% 2nd
Nebraska
NA Central 25,229 1,967,923 1.28% 23,688 25,229 1,541 6.51% 0.22% 1% 6th
Nevada
NA Southwest 181,975 3,177,772 5.73% 178,737 181,975 3,238 1.81% 0.46% 4% 2nd
New Hampshire
NA Northeast 8,996 1,395,231 0.64% 8,335 8,996 661 7.93% 0.09% 1% 6th
New Jersey
NA Northeast 34,536 9,261,699 0.37% 32,744 34,536 1,792 5.47% 0.25% <1% 15th
New Mexico
NA Southwest 69,055 2,113,344 3.27% 69,365 69,055 −310 -0.45% -0.04% 1% 3rd
New York
NA Northeast 84,857 19,677,151 0.43% 79,933 84,857 4,924 6.16% 0.7% <1% 13th
North Carolina
NA Southeast 94,018 10,698,973 0.88% 79,835 94,018 14,183 17.77% 2.02% 1% 8th
North Dakota
NA Central 11,487 779,261 1.47% 9,122 11,487 2,365 25.93% 0.34% <1% 7th
Ohio
NA Northeast 63,814 11,756,058 0.54% 59,662 63,814 4,152 6.96% 0.59% 1% 14th
Oklahoma
NA Southwest 51,847 4,019,800 1.29% 45,008 51,847 6,839 15.2% 0.97% 1% 8th
Oregon
NA West 150,207 4,240,137 3.54% 150,630 150,207 −423 -0.28% -0.06% 3% 2nd
Pennsylvania
NA Northeast 52,193 12,972,008 0.4% 51,171 52,193 1,022 2% 0.15% <1% 13th
Rhode Island
NA Northeast 4,351 1,093,734 0.4% 4,054 4,351 297 7.33% 0.04% <1% 8th
South Carolina
NA Southeast 44,230 5,282,634 0.84% 38,676 44,230 5,554 14.36% 0.79% <1% 11th
South Dakota
NA Central 11,494 909,824 1.26% 10,385 11,494 1,109 10.68% 0.16% <1% 8th
Tennessee
NA Southeast 57,422 7,051,339 0.81% 47,343 57,422 10,079 21.29% 1.43% 1% 10th
Texas
NA Southwest 378,281 30,029,572 1.26% 315,895 378,281 62,386 19.75% 8.87% 1% 6th
Utah
Utah 2,173,560 3,380,800 64.29% 1,951,937 2,173,560 221,623 11.35% 31.51% 55% 1st
Vermont
NA Northeast 4,631 647,064 0.72% 4,596 4,631 35 0.76% 0% <1% 7th
Virginia
NA Northeast 97,449 8,683,619 1.12% 92,407 97,449 5,042 5.46% 0.72% 2% 7th
Washington
NA West 281,389 7,785,786 3.61% 276,837 281,389 4,552 1.64% 0.65% 3% 2nd
West Virginia
NA Northeast 17,294 1,775,156 0.97% 17,060 17,294 234 1.37% 0.03% 2% 9th
Wisconsin
NA Central 27,943 5,892,539 0.47% 25,686 27,943 2,257 8.79% 0.32% <1% 10th
Wyoming
NA Central 67,797 581,381 11.66% 65,485 67,797 2,312 3.53% 0.33% 9% 1st

Territories

Country Area Temples Mis­sions Dis­tricts Stakes Con­gre­ga­tions FHC
O U A T Wards Bran­ches Total
 American Samoa
Pacific 0 1 0 1 0 0 5 38 5 43 5
 Guam
Asia North 1 0 0 1 1 0 1 4 1 5 2
 Northern Mariana Islands
Pacific 0 0 0 0 0 0 0 1 0 1 1
 Puerto Rico
Caribbean 0 1 0 1 1 1 5 27 11 38 8
 United States Virgin Islands
Caribbean 0 0 0 0 0 0 0 0 2 2 0
Totals 1 2 0 3 2 1 11 70 19 89 15
Country Area Members Population %LDS 2012 2022 Change Growth (%) % of Total Growth
 American Samoa
Pacific 16,436 49,710 33.06% 15,411 16,436 1,025 6.65% 0.05%
 Guam
Asia North 2,547 153,836 1.66% 2,252 2,547 295 13.1% 0.01%
 Northern Mariana Islands
Pacific 906 47,329 1.91% 753 906 153 20.32% 0.01%
 Puerto Rico
Caribbean 23,243 3,221,789 0.72% 20,940 23,243 2,303 11% 0.1%
 United States Virgin Islands
Caribbean 616 87,146 0.71% 570 616 46 8.07% 0%
Totals 43,748 3,559,810 1.23% 39,926 43,748 3,822 9.57% 0.17%

From religious surveys

2001 American Religious Identification Survey

Percentage of US adult population by state claiming membership in the LDS church in the 2001 ARIS survey. Click image for map legend.

The 2001 American Religious Identification Survey (ARIS) was based on a random digit-dialed telephone survey of 50,281 American adults in the continental U.S.

2007 Pew Forum on Religion & Public Life

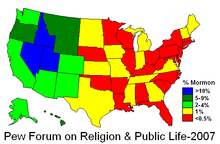
Percentage of US adult population, by state, claiming Mormon as religious preference in the 2007 survey by the Pew Forum on Religion & Public Life.

The Pew Forum on Religion & Public Life published a survey of 35,556 adults living in the United States that was conducted in 2007.[6] The 2007 survey, conducted by Princeton Survey Research Associates International (PSRAI), found 1.7% of the U.S. adult population self identified themselves as Mormon.[7] The table below lists a few significant findings, from the survey, about Mormons. Note: some less populated states were combined in this survey. These include: Montana-Wyoming, D.C.-Maryland, North & South Dakota, New Hampshire-Vermont, and Connecticut-Rhode Island. The racial and ethnic composition of the U.S. membership is predominantly white[8] with a lower percentage of blacks when compared to the U.S. average.[9]

Demographic Mormons (U.S.) U.S. Avg.
Married 71 % 54 %
Divorced or separated 9 % 12 %
3 or more children at home 21 % 9 %
Weekly (or more) Attendance at Religious Services 76 % 39 %
Race, Ethnicity Mormons (U.S.) U.S. Avg.
White, non-Hisp. 86 % 71 %
Black, non-Hisp. 3 % 11 %
Other non-Hisp. 5 % 6 %
Hispanic 7 % 12 %

See also

References

  1. ^ a b "Facts and Statistics: Statistics by Country: United States", Newsroom, LDS Church, retrieved 15 May 2022
  2. ^ Excludes groups meeting separate from wards and branches.
  3. ^ Category:United States Family History Centers, familysearch.org, retrieved March 28, 2022
  4. ^ "General Handbook [2022], 33.6.2 Members of Record". ChurchofJesusChrist.org. Retrieved 11 Aug 2022.
  5. ^ "State Population Totals and Components of Change: 2020-2022". www.census.gov. Archived from the original on 2023-05-31. Retrieved 2023-06-14.
  6. ^ "Religion in American Culture -- Pew Forum on Religion & Public Life". Archived from the original on 14 February 2015. Retrieved 14 February 2015.
  7. ^ Portrait of Mormons in the U.S. Archived 2009-07-30 at the Wayback Machine, Pew Forum on Religion & Public Life, July 24, 2009
  8. ^ "The most and least racially diverse U.S. religious groups". pewresearch.org. Jul 27, 2015.
  9. ^ "Racial and ethnic composition among Mormons". pewforum.org. Retrieved 2021-11-24.
This page was last edited on 9 April 2024, at 23:51
Basis of this page is in Wikipedia. Text is available under the CC BY-SA 3.0 Unported License. Non-text media are available under their specified licenses. Wikipedia® is a registered trademark of the Wikimedia Foundation, Inc. WIKI 2 is an independent company and has no affiliation with Wikimedia Foundation.