
| Electoral district no. 8 | |
|---|---|
| Valimisringkond nr 8 | |
| Electoral District for the Riigikogu | |
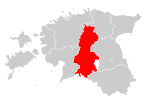 Location of Electoral district no. 8 within Estonia | |
| County | |
| Population | 76,335 (2020)[1] |
| Electorate | 61,657 (2019) |
| Current Electoral District | |
| Created | 1995 |
| Seats | List
|
| Member of the Riigikogu[2] | List |
| Created from | |
Electoral district no. 8 (Estonian: Valimisringkond nr 8) is one of the 12 multi-member electoral districts of the Riigikogu, the national legislature of Estonia. The district was established as electoral district no. 7 in 1995 following the re-organisation of electoral districts. It was renamed electoral district no. 8 in 2003 following another re-organisation of electoral districts. It is conterminous with the counties of Järva and Viljandi. The district currently elects seven of the 101 members of the Riigikogu using the open party-list proportional representation electoral system. At the 2019 parliamentary election it had 61,657 registered electors.
Electoral system
Electoral district no. 8 currently elects seven of the 101 members of the Riigikogu using the open party-list proportional representation electoral system.[3][4] The allocation of seats is carried out in three stages. In the first stage, any individual candidate, regardless of whether they are a party or independent candidate, who receives more votes than the district's simple quota (Hare quota: valid votes in district/number of seats allocated to district) is elected via a personal mandate.[5] In the second stage, district mandates are allocated to parties by dividing their district votes by the district's simple quota.[5] Only parties that reach the 5% national threshold compete for district mandates and any personal mandates won by the party are subtracted from the party's district mandates.[5] Prior to 2003 if a party's surplus/remainder votes was equal to or greater than 75% of the district's simple quota it received one additional district mandate.[5] Any unallocated district seats are added to a national pool of compensatory seats.[5] In the final stage, compensatory mandates are calculated based on the national vote and using a modified D'Hondt method.[5] Only parties that reach the 5% national threshold compete for compensatory seats and any personal and district mandates won by the party are subtracted from the party's compensatory mandates.[5] Though calculated nationally, compensatory mandates are allocated at the district level.
Seats
Seats allocated to electoral district no. 8 by the National Electoral Committee of Estonia at each election was as follows:
- 2023 - 7[6]
- 2019 - 7[7]
- 2015 - 7[8]
- 2011 - 8[9]
- 2007 - 8[10]
- 2003 - 9[11]
- 1999 - 9[12]
- 1995 - 10[13]
Election results
Summary
| Election | Left EÜVP/EVP/ESDTP/Õ/V |
Constitution K/EÜRP/MKOE |
Social Democrats SDE/RM/M |
Greens EER/NJ/R |
Centre K/R |
Reform RE |
Isamaa I/IRL/I/I\ERSP/I |
Conservative People's EKRE/ERL/EME/KMÜ | ||||||||||||||||
|---|---|---|---|---|---|---|---|---|---|---|---|---|---|---|---|---|---|---|---|---|---|---|---|---|
| Votes | % | Seats | Votes | % | Seats | Votes | % | Seats | Votes | % | Seats | Votes | % | Seats | Votes | % | Seats | Votes | % | Seats | Votes | % | Seats | |
| 2023 | 5,084 | 12.94% | 1 | 308 | 0.78% | 0 | 4,021 | 10.23% | 0 | 9,777 | 26.11% | 2 | 4,673 | 11.89% | 1 | 9,153 | 23.29% | 1 | ||||||
| 2019 | 13 | 0.03% | 4,682 | 12.50% | 1 | 377 | 1.01% | 0 | 6,253 | 16.70% | 1 | 9,777 | 26.11% | 2 | 6,176 | 16.49% | 1 | 8,389 | 22.40% | 1 | ||||
| 2015 | 17 | 0.04% | 8,898 | 23.04% | 1 | 183 | 0.47% | 0 | 6,127 | 15.86% | 1 | 10,703 | 27.71% | 2 | 6,824 | 17.67% | 1 | 3,054 | 7.91% | 0 | ||||
| 2011 | 11,219 | 27.37% | 2 | 772 | 1.88% | 0 | 5,480 | 13.37% | 1 | 11,094 | 27.06% | 2 | 9,413 | 22.96% | 2 | 819 | 2.00% | 0 | ||||||
| 2007 | 75 | 0.18% | 29 | 0.07% | 0 | 6,114 | 14.49% | 1 | 2,911 | 6.90% | 0 | 9,078 | 21.51% | 1 | 11,100 | 26.30% | 2 | 7,758 | 18.38% | 1 | 4,472 | 10.60% | 1 | |
| 2003 | 170 | 0.42% | 121 | 0.30% | 0 | 2,265 | 5.63% | 0 | 10,973 | 27.28% | 2 | 5,182 | 12.88% | 1 | 4,424 | 11.00% | 1 | 6,769 | 16.83% | 1 | ||||
| 1999 | 160 | 0.38% | 0 | 7,755 | 18.45% | 1 | 10,485 | 24.95% | 2 | 4,259 | 10.13% | 0 | 8,151 | 19.39% | 1 | 2,784 | 6.62% | 0 | ||||||
| 1995 | 409 | 0.82% | 239 | 0.48% | 0 | 1,559 | 3.12% | 0 | 316 | 0.63% | 0 | 7,400 | 14.80% | 1 | 5,500 | 11.00% | 1 | 3,975 | 7.95% | 0 | 23,842 | 47.67% | 4 | |
(Excludes compensatory seats)
Detailed
2023
Results of the 2023 parliamentary election held on 5 March 2023:[14][15][16]
| Party | Votes per county | Total Votes | % | Seats | ||||||||
|---|---|---|---|---|---|---|---|---|---|---|---|---|
| Järva | Vil -jandi |
Over -seas |
Elec -tronic |
Per. | Dis. | Com. | Tot. | |||||
| Estonian Reform Party | REF | 1,570 | 2,101 | 21 | 7,091 | 10,933 | 27.82% | 1 | 1 | 0 | 2 | |
| Conservative People's Party of Estonia | EKRE | 2,492 | 3,787 | 83 | 2,608 | 9,153 | 23.29% | 0 | 1 | 0 | 1 | |
| Social Democratic Party | SDE | 827 | 1,493 | 7 | 2,672 | 5,084 | 12.94% | 0 | 1 | 1 | 2 | |
| Isamaa | IE | 838 | 1,505 | 5 | 2,200 | 4,673 | 11.89% | 0 | 1 | 0 | 1 | |
| Estonia 200 | EE200 | 530 | 1,050 | 10 | 2,542 | 4,195 | 10.68% | 0 | 0 | 0 | 0 | |
| Estonian Centre Party | KESK | 1,008 | 1,432 | 0 | 1,500 | 4,021 | 10.23% | 0 | 0 | 1 | 1 | |
| Parempoolsed | 143 | 209 | 0 | 438 | 806 | 2.05% | 0 | 0 | 0 | 0 | ||
| Estonian Greens | EER | 48 | 57 | 4 | 191 | 308 | 0.78% | 0 | 0 | 0 | 0 | |
| Andres Laiapea (Independent) | 26 | 40 | 0 | 56 | 124 | 0.32% | 0 | 0 | 0 | 0 | ||
| Valid Votes | 7,482 | 11,674 | 130 | 19,298 | 39,297 | 100.00% | 1 | 4 | 2 | 7 | ||
| Rejected Votes | 106 | 132 | 2 | 0 | 247 | 0.68% | ||||||
| Total Polled | 7,588 | 11,806 | 132 | 19,298 | 39,544 | 61.61% | ||||||
| Registered Electors | 23,012 | 35,513 | 5,661 | 64,186 | ||||||||
The following candidates were elected:[16]
- Personal mandates - Jürgen Ligi (REF), 5,797 votes.
- District mandates - Helmen Kütt (SDE), 2,098 votes; Jaak Madison (EKRE), 5,222 votes; Pipi-Liis Siemann (REF), 2,498 votes; and Helir-Valdor Seeder (IE), 2,689 votes.
- Compensatory mandates - Lauri Läänemets (SDE), 1,731 votes; and Jaak Aab (KESK), 1,562 votes.
2019
Results of the 2019 parliamentary election held on 3 March 2019:[17][18][19]
| Party | Votes per county | Total Votes | % | Seats | ||||||||
|---|---|---|---|---|---|---|---|---|---|---|---|---|
| Järva | Vil -jandi |
Over -seas |
Elec -tronic |
Per. | Dis. | Com. | Tot. | |||||
| Estonian Reform Party | RE | 1,719 | 2,758 | 22 | 5,278 | 9,777 | 26.11% | 1 | 1 | 0 | 2 | |
| Conservative People's Party of Estonia | EKRE | 2,341 | 3,241 | 75 | 2,732 | 8,389 | 22.40% | 1 | 0 | 0 | 1 | |
| Estonian Centre Party | K | 1,871 | 2,829 | 4 | 1,549 | 6,253 | 16.70% | 0 | 1 | 1 | 2 | |
| Isamaa | I | 1,137 | 2,207 | 20 | 2,812 | 6,176 | 16.49% | 0 | 1 | 0 | 1 | |
| Social Democratic Party | SDE | 980 | 1,648 | 12 | 2,042 | 4,682 | 12.50% | 0 | 1 | 0 | 1 | |
| Estonia 200 | 140 | 356 | 3 | 561 | 1,060 | 2.83% | 0 | 0 | 0 | 0 | ||
| Estonian Greens | EER | 79 | 111 | 3 | 184 | 377 | 1.01% | 0 | 0 | 0 | 0 | |
| Estonian Biodiversity Party | 45 | 123 | 3 | 179 | 350 | 0.93% | 0 | 0 | 0 | 0 | ||
| Estonian Free Party | EVA | 71 | 90 | 1 | 119 | 281 | 0.75% | 0 | 0 | 0 | 0 | |
| Jüri Malsub (Independent) | 27 | 25 | 0 | 38 | 90 | 0.24% | 0 | 0 | 0 | 0 | ||
| Estonian United Left Party | EÜVP | 2 | 4 | 1 | 6 | 13 | 0.03% | 0 | 0 | 0 | 0 | |
| Valid Votes | 8,412 | 13,392 | 144 | 15,500 | 37,448 | 100.00% | 2 | 4 | 1 | 7 | ||
| Rejected Votes | 114 | 141 | 1 | 0 | 256 | 0.68% | ||||||
| Total Polled | 8,526 | 13,533 | 145 | 15,500 | 37,704 | 61.15% | ||||||
| Registered Electors | 24,135 | 37,067 | 455 | 61,657 | ||||||||
The following candidates were elected:[19]
- Personal mandates - Jürgen Ligi (RE), 6,069 votes; and Jaak Madison (EKRE), 5,612 votes.
- District mandates - Jaak Aab (K), 2,227 votes; Yoko Alender (RE), 997 votes; Helmen Kütt (SDE), 2,194 votes; and Helir-Valdor Seeder (I), 3,138 votes.
- Compensatory mandates - Kersti Sarapuu (K), 1,394 votes.
2015
Results of the 2015 parliamentary election held on 1 March 2015:[20][21][22]
| Party | Votes per county | Total Votes | % | Seats | ||||||||
|---|---|---|---|---|---|---|---|---|---|---|---|---|
| Järva | Vil -jandi |
Over -seas |
Elec -tronic |
Per. | Dis. | Com. | Tot. | |||||
| Estonian Reform Party | RE | 2,533 | 4,221 | 12 | 3,937 | 10,703 | 27.71% | 1 | 1 | 0 | 2 | |
| Social Democratic Party | SDE | 2,236 | 4,098 | 16 | 2,548 | 8,898 | 23.04% | 0 | 1 | 1 | 2 | |
| Pro Patria and Res Publica Union | IRL | 1,876 | 2,732 | 14 | 2,202 | 6,824 | 17.67% | 0 | 1 | 0 | 1 | |
| Estonian Centre Party | K | 2,246 | 3,160 | 3 | 718 | 6,127 | 15.86% | 0 | 1 | 2 | 3 | |
| Conservative People's Party of Estonia | EKRE | 956 | 1,362 | 4 | 732 | 3,054 | 7.91% | 0 | 0 | 1 | 1 | |
| Estonian Free Party | EVA | 523 | 939 | 3 | 903 | 2,368 | 6.13% | 0 | 0 | 0 | 0 | |
| Party of People's Unity | RÜE | 72 | 71 | 0 | 62 | 205 | 0.53% | 0 | 0 | 0 | 0 | |
| Estonian Greens | EER | 50 | 74 | 0 | 59 | 183 | 0.47% | 0 | 0 | 0 | 0 | |
| Heli Koit (Independent) | 60 | 57 | 1 | 58 | 176 | 0.46% | 0 | 0 | 0 | 0 | ||
| Estonian Independence Party | EIP | 24 | 31 | 1 | 11 | 67 | 0.17% | 0 | 0 | 0 | 0 | |
| Estonian United Left Party | EÜVP | 3 | 13 | 0 | 1 | 17 | 0.04% | 0 | 0 | 0 | 0 | |
| Valid Votes | 10,579 | 16,758 | 54 | 11,231 | 38,622 | 100.00% | 1 | 4 | 4 | 9 | ||
| Rejected Votes | 127 | 186 | 0 | 0 | 313 | 0.80% | ||||||
| Total Polled | 10,706 | 16,944 | 54 | 11,231 | 38,935 | 59.67% | ||||||
| Registered Electors | 25,453 | 39,749 | 54 | 65,256 | ||||||||
The following candidates were elected:[22]
- Personal mandates - Jürgen Ligi (RE), 6,757 votes.
- District mandates - Johannes Kert (RE), 752 votes; Helmen Kütt (SDE), 3,817 votes; Mailis Reps (K), 2,981 votes; and Helir-Valdor Seeder (IRL), 2,908 votes.
- Compensatory mandates - Jaak Madison (EKRE), 1,883 votes; Jaanus Marrandi (SDE), 1,050 votes; Kersti Sarapuu (K), 1,164 votes; and Priit Toobal (K), 1,045 votes.
2011
Results of the 2011 parliamentary election held on 6 March 2011:[23][24][25]
| Party | Votes per county | Total Votes | % | Seats | ||||||||
|---|---|---|---|---|---|---|---|---|---|---|---|---|
| Järva | Vil -jandi |
Over -seas |
Elec -tronic |
Per. | Dis. | Com. | Tot. | |||||
| Social Democratic Party | SDE | 3,687 | 4,870 | 16 | 2,646 | 11,219 | 27.37% | 1 | 1 | 0 | 2 | |
| Estonian Reform Party | RE | 2,900 | 5,167 | 29 | 2,998 | 11,094 | 27.06% | 0 | 2 | 2 | 4 | |
| Pro Patria and Res Publica Union | IRL | 2,688 | 4,369 | 36 | 2,320 | 9,413 | 22.96% | 0 | 2 | 0 | 2 | |
| Estonian Centre Party | K | 1,709 | 3,208 | 6 | 557 | 5,480 | 13.37% | 0 | 1 | 1 | 2 | |
| Andreas Reinberg (Independent) | 511 | 643 | 0 | 259 | 1,413 | 3.45% | 0 | 0 | 0 | 0 | ||
| People's Union of Estonia | ERL | 167 | 534 | 0 | 118 | 819 | 2.00% | 0 | 0 | 0 | 0 | |
| Estonian Greens | EER | 217 | 340 | 9 | 206 | 772 | 1.88% | 0 | 0 | 0 | 0 | |
| Valdo Paddar (Independent) | 63 | 200 | 1 | 46 | 310 | 0.76% | 0 | 0 | 0 | 0 | ||
| Kalle Hiob (Independent) | 34 | 125 | 0 | 28 | 187 | 0.46% | 0 | 0 | 0 | 0 | ||
| Party of Estonian Christian Democrats | EKD | 33 | 94 | 0 | 23 | 150 | 0.37% | 0 | 0 | 0 | 0 | |
| Estonian Independence Party | EIP | 33 | 39 | 2 | 22 | 96 | 0.23% | 0 | 0 | 0 | 0 | |
| Russian Party in Estonia | VEE | 10 | 26 | 0 | 4 | 40 | 0.10% | 0 | 0 | 0 | 0 | |
| Valid Votes | 12,052 | 19,615 | 99 | 9,227 | 40,993 | 100.00% | 1 | 6 | 3 | 10 | ||
| Rejected Votes | 134 | 192 | 5 | 0 | 331 | 0.80% | ||||||
| Total Polled | 12,186 | 19,807 | 104 | 9,227 | 41,324 | 58.96% | ||||||
| Registered Electors | 27,479 | 42,509 | 104 | 70,092 | ||||||||
The following candidates were elected:[25]
- Personal mandates - Sven Mikser (SDE), 7,431 votes.
- District mandates - Enn Eesmaa (K), 1,535 votes; Kaia Iva (IRL), 1,064 votes; Kalle Jents (RE), 1,346 votes; Helmen Kütt (SDE), 1,693 votes; Jürgen Ligi (RE), 5,043 votes; and Helir-Valdor Seeder (IRL), 4,479 votes.
- Compensatory mandates - Peep Aru (RE), 896 votes; Tõnis Kõiv (RE), 961 votes; and Priit Toobal (K), 796 votes.
2007
Results of the 2007 parliamentary election held on 4 March 2007:[26][27][28][29]
| Party | Votes per county | Total Votes | % | Seats | ||||||||
|---|---|---|---|---|---|---|---|---|---|---|---|---|
| Järva | Vil -jandi |
Over -seas |
Elec -tronic |
Per. | Dis. | Com. | Tot. | |||||
| Estonian Reform Party | RE | 3,859 | 6,650 | 14 | 577 | 11,100 | 26.30% | 0 | 2 | 1 | 3 | |
| Estonian Centre Party | K | 3,559 | 5,339 | 9 | 171 | 9,078 | 21.51% | 0 | 1 | 2 | 3 | |
| Pro Patria and Res Publica Union | IRL | 2,569 | 4,587 | 63 | 539 | 7,758 | 18.38% | 0 | 1 | 1 | 2 | |
| Social Democratic Party | SDE | 2,772 | 2,915 | 13 | 414 | 6,114 | 14.49% | 0 | 1 | 0 | 1 | |
| People's Union of Estonia | ERL | 1,434 | 2,926 | 5 | 107 | 4,472 | 10.60% | 0 | 1 | 0 | 1 | |
| Estonian Greens | EER | 916 | 1,787 | 6 | 202 | 2,911 | 6.90% | 0 | 0 | 0 | 0 | |
| Party of Estonian Christian Democrats | EKD | 238 | 312 | 4 | 16 | 570 | 1.35% | 0 | 0 | 0 | 0 | |
| Estonian Independence Party | EIP | 32 | 36 | 1 | 8 | 77 | 0.18% | 0 | 0 | 0 | 0 | |
| Estonian Left Party | EVP | 24 | 47 | 1 | 3 | 75 | 0.18% | 0 | 0 | 0 | 0 | |
| Constitution Party | K | 7 | 22 | 0 | 0 | 29 | 0.07% | 0 | 0 | 0 | 0 | |
| Russian Party in Estonia | VEE | 8 | 12 | 0 | 0 | 20 | 0.05% | 0 | 0 | 0 | 0 | |
| Valid Votes | 15,418 | 24,633 | 116 | 2,037 | 42,204 | 100.00% | 0 | 6 | 4 | 10 | ||
| Rejected Votes | 169 | 200 | 9 | 0 | 378 | 0.89% | ||||||
| Total Polled | 15,587 | 24,833 | 125 | 2,037 | 42,582 | 59.17% | ||||||
| Registered Electors | 28,251 | 43,589 | 125 | 71,965 | ||||||||
The following candidates were elected:[29]
- District mandates - Jaak Aab (K), 4,229 votes; Meelis Atonen (RE), 4,687 votes; Tõnis Kõiv (RE), 1,926 votes; Jaanus Marrandi (ERL), 1,108 votes; Sven Mikser (SDE), 4,280 votes; and Helir-Valdor Seeder (IRL), 4,089 votes.
- Compensatory mandates - Peep Aru (RE), 1,568 votes; Kaia Iva (IRL), 886 votes; Jaan Kundla (K), 496 votes; and Arvo Sarapuu (K), 913 votes.
2003
Results of the 2003 parliamentary election held on 2 March 2003:[30][31][32][33]
| Party | Votes per county | Total Votes | % | Seats | |||||||
|---|---|---|---|---|---|---|---|---|---|---|---|
| Järva | Vil -jandi |
Over -seas |
Per. | Dis. | Com. | Tot. | |||||
| Estonian Centre Party | K | 4,211 | 6,758 | 4 | 10,973 | 27.28% | 0 | 2 | 0 | 2 | |
| Union for the Republic–Res Publica | ÜVE-RP | 4,806 | 4,783 | 7 | 9,596 | 23.86% | 0 | 2 | 0 | 2 | |
| People's Union of Estonia | ERL | 2,637 | 4,131 | 1 | 6,769 | 16.83% | 0 | 1 | 0 | 1 | |
| Estonian Reform Party | RE | 1,944 | 3,235 | 3 | 5,182 | 12.88% | 0 | 1 | 0 | 1 | |
| Pro Patria Union Party | I | 1,380 | 3,024 | 20 | 4,424 | 11.00% | 0 | 1 | 0 | 1 | |
| Moderate People's Party | RM | 829 | 1,414 | 22 | 2,265 | 5.63% | 0 | 0 | 1 | 1 | |
| Estonian Christian People's Party | EKRP | 192 | 184 | 0 | 376 | 0.93% | 0 | 0 | 0 | 0 | |
| Estonian Independence Party | EIP | 67 | 154 | 0 | 221 | 0.55% | 0 | 0 | 0 | 0 | |
| Estonian Social Democratic Labour Party | ESDTP | 64 | 106 | 0 | 170 | 0.42% | 0 | 0 | 0 | 0 | |
| Estonian United People's Party | EÜRP | 34 | 87 | 0 | 121 | 0.30% | 0 | 0 | 0 | 0 | |
| Ivan Tsvetkov (Independent) | 87 | 15 | 0 | 102 | 0.25% | 0 | 0 | 0 | 0 | ||
| Russian Party in Estonia | VEE | 12 | 15 | 0 | 27 | 0.07% | 0 | 0 | 0 | 0 | |
| Valid Votes | 16,263 | 23,906 | 57 | 40,226 | 100.00% | 0 | 7 | 1 | 8 | ||
| Rejected Votes | 143 | 289 | 1 | 433 | 1.06% | ||||||
| Total Polled | 16,406 | 24,195 | 58 | 40,659 | 54.75% | ||||||
| Registered Electors | 29,964 | 44,246 | 58 | 74,268 | |||||||
| Turnout | 54.75% | 54.68% | 100.00% | 54.75% | |||||||
The following candidates were elected:[33]
- District mandates - Jaak Allik (ERL), 1,937 votes; Peep Aru (RE), 2,064 votes; Andres Jalak (ÜVE-RP), 1,698 votes; Arnold Kimber (K), 1,830 votes; Jaanus Marrandi (K), 3,502 votes; Jaanus Rahumägi (ÜVE-RP), 3,798 votes; and Helir-Valdor Seeder (I), 2,524 votes.
- Compensatory mandates - Toomas Hendrik Ilves (RM), 1,430 votes.
1999
Results of the 1999 parliamentary election held on 7 March 1999:[34][35][36][37]
| Party | Votes per county | Total Votes | % | Seats | |||||||
|---|---|---|---|---|---|---|---|---|---|---|---|
| Järva | Vil -jandi |
Over -seas |
Per. | Dis. | Com. | Tot. | |||||
| Estonian Centre Party | K | 4,360 | 6,121 | 4 | 10,485 | 24.95% | 0 | 2 | 1 | 3 | |
| Pro Patria Union | I | 3,170 | 4,836 | 145 | 8,151 | 19.39% | 1 | 0 | 0 | 1 | |
| Moderate | M | 2,548 | 5,170 | 37 | 7,755 | 18.45% | 0 | 1 | 0 | 1 | |
| Estonian Coalition Party | KE | 2,725 | 3,334 | 1 | 6,060 | 14.42% | 0 | 1 | 0 | 1 | |
| Estonian Reform Party | RE | 1,981 | 2,276 | 2 | 4,259 | 10.13% | 0 | 0 | 2 | 2 | |
| Estonian Country People's Party | EME | 1,007 | 1,774 | 3 | 2,784 | 6.62% | 0 | 0 | 0 | 0 | |
| Estonian Christian People's Party | EKRP | 481 | 477 | 0 | 958 | 2.28% | 0 | 0 | 0 | 0 | |
| Estonian Blue Party | ESE | 301 | 447 | 3 | 751 | 1.79% | 0 | 0 | 0 | 0 | |
| Helju Orr (Independent) | 51 | 151 | 0 | 202 | 0.48% | 0 | 0 | 0 | 0 | ||
| Estonian United People's Party | EÜRP | 28 | 132 | 0 | 160 | 0.38% | 0 | 0 | 0 | 0 | |
| Russian Party in Estonia | VEE | 78 | 78 | 0 | 156 | 0.37% | 0 | 0 | 0 | 0 | |
| Progress Party | 41 | 111 | 0 | 152 | 0.36% | 0 | 0 | 0 | 0 | ||
| Jaan Kivi (Independent) | 12 | 83 | 0 | 95 | 0.23% | 0 | 0 | 0 | 0 | ||
| Farmers' Assembly | 18 | 42 | 1 | 61 | 0.15% | 0 | 0 | 0 | 0 | ||
| Valid Votes | 16,801 | 25,032 | 196 | 42,029 | 100.00% | 1 | 4 | 3 | 8 | ||
| Rejected Votes | 251 | 350 | 2 | 603 | 1.41% | ||||||
| Total Polled | 17,052 | 25,382 | 198 | 42,632 | 55.78% | ||||||
| Registered Electors | 30,295 | 45,933 | 198 | 76,426 | |||||||
| Turnout | 56.29% | 55.26% | 100.00% | 55.78% | |||||||
The following candidates were elected:[37]
- Personal mandates - Mart Laar (I), 5,446 votes.
- District mandates - Toomas Hendrik Ilves (M), 4,521 votes; Ants Käärma (KE), 2,179 votes; Peeter Kreitzberg (K), 2,252 votes; and Jaanus Marrandi (K), 2,373 votes.
- Compensatory mandates - Sven Mikser (K), 721 votes; Märt Rask (RE), 1,647 votes; and Andres Taimla (RE), 531 votes.
1995
Results of the 1995 parliamentary election held on 5 March 1995:[38][39][40][41]
| Party | Votes per county | Total Votes | % | Seats | |||||||
|---|---|---|---|---|---|---|---|---|---|---|---|
| Järva | Vil -jandi |
Over -seas |
Per. | Dis. | Com. | Tot. | |||||
| Coalition Party and Rural People's Association | KMÜ | 8,873 | 14,943 | 26 | 23,842 | 47.67% | 1 | 3 | 0 | 4 | |
| Estonian Centre Party | K | 3,834 | 3,555 | 11 | 7,400 | 14.80% | 0 | 1 | 0 | 1 | |
| Estonian Reform Party | RE | 2,499 | 2,982 | 19 | 5,500 | 11.00% | 0 | 1 | 1 | 2 | |
| Pro Patria and ERSP Union | I\ERSP | 1,240 | 2,463 | 272 | 3,975 | 7.95% | 0 | 0 | 1 | 1 | |
| Better Estonia/Estonian Citizen | PE/EK | 1,152 | 2,191 | 17 | 3,360 | 6.72% | 0 | 0 | 0 | 0 | |
| Moderate | M | 450 | 1,102 | 7 | 1,559 | 3.12% | 0 | 0 | 0 | 0 | |
| The Right Wingers | P | 394 | 648 | 24 | 1,066 | 2.13% | 0 | 0 | 1 | 1 | |
| Estonian Farmers' Party | ETRE | 221 | 502 | 3 | 726 | 1.45% | 0 | 0 | 0 | 0 | |
| Estonian Future Party | TEE | 212 | 402 | 1 | 615 | 1.23% | 0 | 0 | 0 | 0 | |
| Justice | Õ | 184 | 224 | 1 | 409 | 0.82% | 0 | 0 | 0 | 0 | |
| Forest Party | 160 | 190 | 2 | 352 | 0.70% | 0 | 0 | 0 | 0 | ||
| Fourth Force | NJ | 98 | 217 | 1 | 316 | 0.63% | 0 | 0 | 0 | 0 | |
| Our Home is Estonia | MKOE | 107 | 132 | 0 | 239 | 0.48% | 0 | 0 | 0 | 0 | |
| Arnold Kuusik (Independent) | 25 | 213 | 0 | 238 | 0.48% | 0 | 0 | 0 | 0 | ||
| Estonian National Federation | ERKL | 98 | 116 | 0 | 214 | 0.43% | 0 | 0 | 0 | 0 | |
| Blue Party | SE | 73 | 115 | 0 | 188 | 0.38% | 0 | 0 | 0 | 0 | |
| Estonian Democratic Union | EDL | 4 | 7 | 0 | 11 | 0.02% | 0 | 0 | 0 | 0 | |
| Valid Votes | 19,624 | 30,002 | 384 | 50,010 | 100.00% | 1 | 5 | 3 | 9 | ||
| Rejected Votes | 200 | 330 | 0 | 530 | 1.05% | ||||||
| Total Polled | 19,824 | 30,332 | 384 | 50,540 | 67.52% | ||||||
| Registered Electors | 29,057 | 45,413 | 384 | 74,854 | |||||||
| Turnout | 68.22% | 66.79% | 100.00% | 67.52% | |||||||
The following candidates were elected:[41]
- Personal mandates - Ants Käärma (KMÜ), 5,818 votes.
- District mandates - Jaak Allik (KMÜ), 4,476 votes; Valve Kirsipuu (RE), 4,035 votes; Tiit Made (K), 3,674 votes; Ilmar Mändmets (KMÜ), 2,506 votes; and Raoul Üksvärav (KMÜ), 4,582 votes.
- Compensatory mandates - Vootele Hansen (P), 789 votes; Mart Laar (I\ERSP), 2,093 votes; and Andres Taimla (RE), 473 votes.
References
- ^ "RV022U: Population by sex, age group and county, 1 January. administrative division as at 01.01.2018". Tallinn, Estonia: Statistics Estonia. Retrieved 19 January 2021.
- ^ "Members of the Riigikogu". Tallinn, Estonia: Riigikogu. Retrieved 19 January 2021.
- ^ "Election for Estonian Parliament". Election Guide. Arlington, U.S.A.: International Foundation for Electoral Systems. Retrieved 19 January 2021.
- ^ "Electoral Assistance: ElecData, Compendium of Electoral Data - Estonia". Strasbourg, France: Council of Europe. Retrieved 19 January 2021.
- ^ a b c d e f g "Estonian elections in a nutshell: Ascertaining the results - Ascertaining the election results at Riigikogu elections". Tallinn, Estonia: National Electoral Committee of Estonia. Retrieved 23 December 2020.
- ^ "Mandaatide jaotamine XV Riigikogu valimistel". Tallinn, Estonia: National Electoral Committee of Esotnia. 30 November 2022. Retrieved 17 March 2023.
- ^ "Mandaatide jaotamine XIV Riigikogu valimistel" (in Estonian). Tallinn, Estonia: Riigi Teataja. 5 December 2018. Retrieved 19 January 2021.
- ^ "Mandaatide jaotamine XIII Riigikogu valimistel" (in Estonian). Tallinn, Estonia: Riigi Teataja. 2 December 2014. Retrieved 19 January 2021.
- ^ "Mandaatide jaotamine XII Riigikogu valimistel" (in Estonian). Tallinn, Estonia: Riigi Teataja. 3 December 2010. Retrieved 19 January 2021.
- ^ "Riigikogu valimine 4 Märts 2007: Üldandmed - Valimisringkonnad ja mandaatide jaotus" (in Estonian). Tallinn, Estonia: National Electoral Committee of Estonia. Retrieved 19 January 2021.
- ^ "Riigikogu valimine 2 Märts 2003: Üldandmed - Valimisringkonnad ja mandaatide jaotus" (in Estonian). Tallinn, Estonia: National Electoral Committee of Estonia. Retrieved 19 January 2021.
- ^ "Riigikogu valimine 7 Märts 1999: Üldandmed - Valimisringkonnad ja mandaatide jaotus" (in Estonian). Tallinn, Estonia: National Electoral Committee of Estonia. Retrieved 19 January 2021.
- ^ Heinsalu, Alo; Koitmäe, Arne; Mandre, Leino; Pilving, Mihkel; Vinkel, Priit (2016). Eero, Gerli (ed.). Elections in Estonia: 1992-2015 (PDF). Tallinn, Estonia: National Electoral Committee of Estonia. p. 42. ISSN 2504-5555. Retrieved 19 January 2021.
- ^ "Riigikogu valimised 2023: Hääletamis- ja valimistulemus - Valimisringkond nr 8 (Järva- ja Viljandimaa)". Tallinn, Estonia: National Electoral Committee of Estonia. Retrieved 19 March 2023.
- ^ "Riigikogu valimised 2023: Detailne hääletamistulemus - Valimisringkond nr 8 (Järva- ja Viljandimaa)". Tallinn, Estonia: National Electoral Committee of Estonia. Retrieved 19 March 2023.
- ^ a b "Riigikogu valimised 2023: Valitud Riigikogu liikmed - Mandaatide omandamise viis". Tallinn, Estonia: National Electoral Committee of Estonia. Retrieved 19 March 2023.
- ^ "Riigikogu valimised 2019: Hääletamis- ja valimistulemus - Valimisringkond nr 8 (Järva- ja Viljandimaa)" (in Estonian). Tallinn, Estonia: National Electoral Committee of Estonia. Retrieved 19 January 2021.
- ^ "Riigikogu valimised 2019: Detailne hääletamistulemus - Valimisringkond nr 8 (Järva- ja Viljandimaa)" (in Estonian). Tallinn, Estonia: National Electoral Committee of Estonia. Retrieved 19 January 2021.
- ^ a b "Riigikogu valimised 2019: Valitud Riigikogu liikmed - Mandaatide omandamise viis" (in Estonian). Tallinn, Estonia: National Electoral Committee of Estonia. Retrieved 19 January 2021.
- ^ "Riigikogu valimised 2015: Hääletamis- ja valimistulemus hetkeseisuga - Valimisringkond 8 (Järva- ja Viljandimaa)" (in Estonian). Tallinn, Estonia: National Electoral Committee of Estonia. Retrieved 20 January 2021.
- ^ "Riigikogu valimised 2015: Detailne hääletamistulemus - Valimisringkond nr 8 (Järva- ja Viljandimaa)" (in Estonian). Tallinn, Estonia: National Electoral Committee of Estonia. Retrieved 20 January 2021.
- ^ a b "Riigikogu valimised 2015: Valitud Riigikogu liikmed - Mandaatide omandamise viis" (in Estonian). Tallinn, Estonia: National Electoral Committee of Estonia. Retrieved 20 January 2021.
- ^ "Riigikogu valimised 2011: Valimistulemus - Hääletamistulemus - Valimisringkond 8 (Järva, Viljandi)" (in Estonian). Tallinn, Estonia: National Electoral Committee of Estonia. Retrieved 20 January 2021.
- ^ "Riigikogu valimised 2011: Hääletamistulemus - Valimisringkond 8 (Järva, Viljandi)" (in Estonian). Tallinn, Estonia: National Electoral Committee of Estonia. Retrieved 20 January 2021.
- ^ a b "Riigikogu valimised 2011: Valitud Riigikogu liikmed - Mandaatide omandamise viis" (in Estonian). Tallinn, Estonia: National Electoral Committee of Estonia. Retrieved 20 January 2021.
- ^ "Riigikogu valimine 4 Märts 2007: Häälte ja mandaatide jaotus - Järva Maakond" (in Estonian). Tallinn, Estonia: National Electoral Committee of Estonia. Retrieved 20 January 2021.
- ^ "Riigikogu valimine 4 Märts 2007: Häälte ja mandaatide jaotus - Viljandi Maakond" (in Estonian). Tallinn, Estonia: National Electoral Committee of Estonia. Retrieved 20 January 2021.
- ^ "Riigikogu valimine 4 Märts 2007: Valimistulemus - Hääletamistulemus - Valimisringkond nr 8" (in Estonian). Tallinn, Estonia: National Electoral Committee of Estonia. Retrieved 20 January 2021.
- ^ a b "Riigikogu valimine 4 Märts 2007: Valimistulemus - Mandaatide omandamise viis" (in Estonian). Tallinn, Estonia: National Electoral Committee of Estonia. Retrieved 20 January 2021.
- ^ "Riigikogu valimine 2 Märts 2003: Häälte ja mandaatide jaotus - Järva Maakond" (in Estonian). Tallinn, Estonia: National Electoral Committee of Estonia. Retrieved 20 January 2021.
- ^ "Riigikogu valimine 2 Märts 2003: Häälte ja mandaatide jaotus - Viljandi Maakond" (in Estonian). Tallinn, Estonia: National Electoral Committee of Estonia. Retrieved 20 January 2021.
- ^ "Riigikogu valimine 2 Märts 2003: Valimistulemus - Hääletamistulemus - Valimisringkond nr 8" (in Estonian). Tallinn, Estonia: National Electoral Committee of Estonia. Retrieved 20 January 2021.
- ^ a b "Riigikogu valimine 2 Märts 2003: Valimistulemus - Mandaatide omandamise viis" (in Estonian). Tallinn, Estonia: National Electoral Committee of Estonia. Retrieved 20 January 2021.
- ^ "Riigikogu valimine 7 Märts 1999: Valimispäev - Järva Maakond" (in Estonian). Tallinn, Estonia: National Electoral Committee of Estonia. Retrieved 20 January 2021.
- ^ "Riigikogu valimine 7 Märts 1999: Valimispäev - Viljandi Maakond" (in Estonian). Tallinn, Estonia: National Electoral Committee of Estonia. Retrieved 20 January 2021.
- ^ "Riigikogu valimine 7 Märts 1999: Hääletamistulemus - Valimisringkond nr 7" (in Estonian). Tallinn, Estonia: National Electoral Committee of Estonia. Retrieved 20 January 2021.
- ^ a b "Riigikogu valimine 7 Märts 1999: Valimistulemus - Mandaatide omandamise viis" (in Estonian). Tallinn, Estonia: National Electoral Committee of Estonia. Retrieved 20 January 2021.
- ^ "Riigikogu valimine 5 Märts 1995: Valimispäev - Järva Maakond" (in Estonian). Tallinn, Estonia: National Electoral Committee of Estonia. Retrieved 20 January 2021.
- ^ "Riigikogu valimine 5 Märts 1995: Valimispäev - Viljandi Maakond" (in Estonian). Tallinn, Estonia: National Electoral Committee of Estonia. Retrieved 20 January 2021.
- ^ "Riigikogu valimine 5 Märts 1995: Hääletamistulemus - Valimisringkond nr 7" (in Estonian). Tallinn, Estonia: National Electoral Committee of Estonia. Retrieved 20 January 2021.
- ^ a b "Riigikogu valimine 5 Märts 1995: Valimistulemus - Mandaatide omandamise viis" (in Estonian). Tallinn, Estonia: National Electoral Committee of Estonia. Retrieved 20 January 2021.