
| Electoral district no. 10 | |
|---|---|
| Valimisringkond nr 10 | |
| Electoral District for the Riigikogu | |
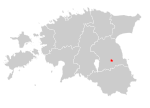 Location of Electoral district no. 10 within Estonia | |
| Municipality | Tartu |
| County | Tartu |
| Population | 96,123 (2020)[1] |
| Electorate | 67,525 (2019) |
| Current Electoral District | |
| Created | 1995 |
| Seats | List
|
| Member of the Riigikogu[2] | List
|
| Created from | District no. 10 |
Electoral district no. 10 (Estonian: Valimisringkond nr 10) is one of the 12 multi-member electoral districts of the Riigikogu, the national legislature of Estonia. The district was established as electoral district no. 9 in 1995 following the re-organisation of electoral districts. It was renamed electoral district no. 10 in 2003 following another re-organisation of electoral districts. It is conterminous with the municipality of Tartu. The district currently elects eight of the 101 members of the Riigikogu using the open party-list proportional representation electoral system. At the 2019 parliamentary election it had 67,525 registered electors.
Electoral system
Electoral district no. 10 currently elects eight of the 101 members of the Riigikogu using the open party-list proportional representation electoral system.[3][4] The allocation of seats is carried out in three stages. In the first stage, any individual candidate, regardless of whether they are a party or independent candidate, who receives more votes than the district's simple quota (Hare quota: valid votes in district/number of seats allocated to district) is elected via a personal mandate.[5] In the second stage, district mandates are allocated to parties by dividing their district votes by the district's simple quota.[5] Only parties that reach the 5% national threshold compete for district mandates and any personal mandates won by the party are subtracted from the party's district mandates.[5] Prior to 2003 if a party's surplus/remainder votes was equal to or greater than 75% of the district's simple quota it received one additional district mandate.[5] Any unallocated district seats are added to a national pool of compensatory seats.[5] In the final stage, compensatory mandates are calculated based on the national vote and using a modified D'Hondt method.[5] Only parties that reach the 5% national threshold compete for compensatory seats and any personal and district mandates won by the party are subtracted from the party's compensatory mandates.[5] Though calculated nationally, compensatory mandates are allocated at the district level.
Seats
Seats allocated to electoral district no. 10 by the National Electoral Committee of Estonia at each election was as follows:
Election results
Summary
| Election | Left EÜVP/EVP/ESDTP/Õ/V |
Constitution K/EÜRP/MKOE |
Social Democrats SDE/RM/M |
Greens EER/NJ/R |
Centre K/R |
Reform RE |
Isamaa I/IRL/I/I\ERSP/I |
Conservative People's EKRE/ERL/EME/KMÜ | ||||||||||||||||
|---|---|---|---|---|---|---|---|---|---|---|---|---|---|---|---|---|---|---|---|---|---|---|---|---|
| Votes | % | Seats | Votes | % | Seats | Votes | % | Seats | Votes | % | Seats | Votes | % | Seats | Votes | % | Seats | Votes | % | Seats | Votes | % | Seats | |
| 2023 | 786 | 1.60% | 0 | 4,869 | 9.92% | 1 | 821 | 1.67% | 0 | 3,600 | 7.34% | 0 | 17,627 | 35.92% | 3 | 4,219 | 8.60% | 0 | 7,138 | 14.55% | 1 | |||
| 2019 | 30 | 0.07% | 0 | 5,087 | 11.35% | 1 | 939 | 2.09% | 0 | 6,099 | 13.60% | 1 | 15,504 | 34.58% | 3 | 5,416 | 12.08% | 1 | 7,641 | 17.04% | 1 | |||
| 2015 | 22 | 0.05% | 0 | 7,541 | 16.79% | 1 | 725 | 1.61% | 0 | 6,787 | 15.11% | 1 | 14,984 | 33.37% | 2 | 6,478 | 14.43% | 1 | 3,109 | 6.92% | 0 | |||
| 2011 | 8,593 | 18.73% | 1 | 1,674 | 3.65% | 0 | 7,106 | 15.49% | 1 | 15,798 | 34.43% | 3 | 11,156 | 24.31% | 2 | 542 | 1.18% | 0 | ||||||
| 2007 | 91 | 0.21% | 0 | 227 | 0.51% | 0 | 5,996 | 13.54% | 1 | 3,593 | 8.12% | 0 | 7,171 | 16.20% | 1 | 15,335 | 34.64% | 3 | 9,607 | 21.70% | 1 | 1,624 | 3.67% | 0 |
| 2003 | 228 | 0.55% | 0 | 573 | 1.38% | 0 | 3,577 | 8.63% | 0 | 6,431 | 15.51% | 1 | 11,634 | 28.07% | 2 | 4,812 | 11.61% | 1 | 3,332 | 8.04% | 0 | |||
| 1999 | 813 | 2.09% | 0 | 5,914 | 15.22% | 1 | 6,789 | 17.48% | 1 | 10,169 | 26.18% | 2 | 9,863 | 25.39% | 2 | 1,109 | 2.85% | 0 | ||||||
| 1995 | 1,023 | 2.48% | 0 | 2,251 | 5.45% | 0 | 1,942 | 4.70% | 0 | 696 | 1.68% | 0 | 4,043 | 9.78% | 0 | 7,548 | 18.26% | 1 | 6,812 | 16.48% | 1 | 7,671 | 18.56% | 1 |
(Excludes compensatory seats)
Detailed
2023
Results of the 2023 parliamentary election held on 5 March 2023:[14][15][16]
| Party | Votes | Total Votes | % | Seats | |||||||
|---|---|---|---|---|---|---|---|---|---|---|---|
| Tartu | Over -seas |
Elec -tronic |
Per. | Dis. | Com. | Tot. | |||||
| Estonian Reform Party | REF | 6,312 | 37 | 11,094 | 17,627 | 35.92% | 1 | 2 | 1 | 4 | |
| Estonia 200 | EE200 | 3,318 | 18 | 5,645 | 9,043 | 18.43% | 0 | 1 | 0 | 1 | |
| Conservative People's Party of Estonia | EKRE | 5,167 | 84 | 1,771 | 7,138 | 14.55% | 0 | 1 | 0 | 1 | |
| Social Democratic Party | SDE | 1,974 | 16 | 2,809 | 4,869 | 9.92% | 0 | 1 | 0 | 1 | |
| Isamaa | IE | 2,191 | 12 | 1,950 | 4,219 | 8.60% | 0 | 0 | 1 | 1 | |
| Estonian Centre Party | KESK | 2,556 | 3 | 986 | 3,600 | 7.34% | 0 | 0 | 0 | 0 | |
| Parempoolsed | 386 | 2 | 573 | 965 | 1.97% | 0 | 0 | 0 | 0 | ||
| Estonian Greens | EER | 341 | 4 | 464 | 821 | 1.67% | 0 | 0 | 0 | 0 | |
| Estonian United Left Party | EÜVP | 636 | 3 | 141 | 786 | 1.60% | 0 | 0 | 0 | 0 | |
| Valid Votes | 22,881 | 179 | 25,433 | 49,068 | 100.00% | 1 | 5 | 2 | 8 | ||
| Rejected Votes | 179 | 3 | 0 | 195 | 0.40% | ||||||
| Total Polled | 23,060 | 182 | 25,433 | 49,263 | 67.06% | ||||||
| Registered Electors | 66,768 | 6,688 | 73,456 | ||||||||
The following candidates were elected:[16]
- Personal mandates - Urmas Klaas (REF), 8,065 votes.
- District mandates - Yoko Alender (REF), 2,051 votes; Kristina Kallas (EE200), 4,288 votes; Ants Laaneots (REF), 1,869 votes; Heljo Pikhof (SDE), 1,242 votes; and Jaak Valge (EKRE), 2,340 votes.
- Compensatory mandates - Signe Kivi (REF), 1,286 votes; and Tõnis Lukas (IE), 2,218 votes.
2019
Results of the 2019 parliamentary election held on 3 March 2019:[17][18][19]
| Party | Votes | Total Votes | % | Seats | |||||||
|---|---|---|---|---|---|---|---|---|---|---|---|
| Tartu | Over -seas |
Elec -tronic |
Per. | Dis. | Com. | Tot. | |||||
| Estonian Reform Party | RE | 6,647 | 38 | 8,819 | 15,504 | 34.58% | 1 | 2 | 0 | 3 | |
| Conservative People's Party of Estonia | EKRE | 5,288 | 77 | 2,276 | 7,641 | 17.04% | 0 | 1 | 1 | 2 | |
| Estonian Centre Party | K | 4,779 | 11 | 1,309 | 6,099 | 13.60% | 0 | 1 | 0 | 1 | |
| Isamaa | I | 2,824 | 26 | 2,566 | 5,416 | 12.08% | 0 | 1 | 0 | 1 | |
| Social Democratic Party | SDE | 2,271 | 31 | 2,785 | 5,087 | 11.35% | 0 | 1 | 0 | 1 | |
| Estonia 200 | 1,197 | 7 | 1,473 | 2,677 | 5.97% | 0 | 0 | 0 | 0 | ||
| Estonian Greens | EER | 426 | 8 | 505 | 939 | 2.09% | 0 | 0 | 0 | 0 | |
| Estonian Free Party | EVA | 399 | 3 | 435 | 837 | 1.87% | 0 | 0 | 0 | 0 | |
| Estonian Biodiversity Party | 260 | 1 | 340 | 601 | 1.34% | 0 | 0 | 0 | 0 | ||
| Estonian United Left Party | EÜVP | 21 | 0 | 9 | 30 | 0.07% | 0 | 0 | 0 | 0 | |
| Valid Votes | 24,112 | 202 | 20,517 | 44,831 | 100.00% | 1 | 6 | 1 | 8 | ||
| Rejected Votes | 220 | 2 | 0 | 222 | 0.49% | ||||||
| Total Polled | 24,332 | 204 | 20,517 | 45,053 | 66.72% | ||||||
| Registered Electors | 66,865 | 660 | 67,525 | ||||||||
The following candidates were elected:[19]
- Personal mandates - Urmas Klaas (RE), 6,119 votes.
- District mandates - Signe Kivi (RE), 1,356 votes; Ants Laaneots (RE), 3,053 votes; Tõnis Lukas (I), 2,506 votes; Aadu Must (K), 2,370 votes; Heljo Pikhof (SDE), 1,522 votes; and Jaak Valge (EKRE), 2,740 votes.
- Compensatory mandates - Ruuben Kaalep (EKRE), 566 votes.
2015
Results of the 2015 parliamentary election held on 1 March 2015:[20][21][22]
| Party | Votes | Total Votes | % | Seats | |||||||
|---|---|---|---|---|---|---|---|---|---|---|---|
| Tartu | Over -seas |
Elec -tronic |
Per. | Dis. | Com. | Tot. | |||||
| Estonian Reform Party | RE | 9,255 | 37 | 5,692 | 14,984 | 33.37% | 1 | 1 | 1 | 3 | |
| Social Democratic Party | SDE | 4,890 | 26 | 2,625 | 7,541 | 16.79% | 0 | 1 | 1 | 2 | |
| Estonian Centre Party | K | 6,225 | 12 | 550 | 6,787 | 15.11% | 0 | 1 | 0 | 1 | |
| Pro Patria and Res Publica Union | IRL | 4,115 | 33 | 2,330 | 6,478 | 14.43% | 0 | 1 | 0 | 1 | |
| Estonian Free Party | EVA | 3,015 | 14 | 1,974 | 5,003 | 11.14% | 0 | 1 | 1 | 2 | |
| Conservative People's Party of Estonia | EKRE | 2,359 | 19 | 731 | 3,109 | 6.92% | 0 | 0 | 0 | 0 | |
| Estonian Greens | EER | 431 | 2 | 292 | 725 | 1.61% | 0 | 0 | 0 | 0 | |
| Urmo Karusoo (Independent) | 88 | 0 | 23 | 111 | 0.25% | 0 | 0 | 0 | 0 | ||
| Party of People's Unity | RÜE | 78 | 1 | 29 | 108 | 0.24% | 0 | 0 | 0 | 0 | |
| Estonian Independence Party | EIP | 32 | 1 | 6 | 39 | 0.09% | 0 | 0 | 0 | 0 | |
| Estonian United Left Party | EÜVP | 21 | 0 | 1 | 22 | 0.05% | 0 | 0 | 0 | 0 | |
| Valid Votes | 30,509 | 145 | 14,253 | 44,907 | 100.00% | 1 | 5 | 3 | 9 | ||
| Rejected Votes | 272 | 1 | 0 | 273 | 0.60% | ||||||
| Total Polled | 30,781 | 146 | 14,253 | 45,180 | 66.30% | ||||||
| Registered Electors | 68,003 | 146 | 68,149 | ||||||||
The following candidates were elected:[22]
- Personal mandates - Ants Laaneots (RE), 5,920 votes.
- District mandates - Krista Aru (EVA), 2,529 votes; Aadu Must (K), 2,139 votes; Mihkel Raud (SDE), 3,229 votes; Anne Sulling (RE), 4,197 votes; and Margus Tsahkna (IRL), 2,267 votes.
- Compensatory mandates - Jüri Adams (EVA), 720 votes; Urmas Klaas (RE), 1,501 votes; and Heljo Pikhof (SDE), 2,042 votes.
2011
Results of the 2011 parliamentary election held on 6 March 2011:[23][24][25]
| Party | Votes | Total Votes | % | Seats | |||||||
|---|---|---|---|---|---|---|---|---|---|---|---|
| Tartu | Over -seas |
Elec -tronic |
Per. | Dis. | Com. | Tot. | |||||
| Estonian Reform Party | RE | 11,225 | 38 | 4,535 | 15,798 | 34.43% | 1 | 2 | 0 | 3 | |
| Pro Patria and Res Publica Union | IRL | 7,721 | 60 | 3,375 | 11,156 | 24.31% | 0 | 2 | 0 | 2 | |
| Social Democratic Party | SDE | 6,272 | 21 | 2,300 | 8,593 | 18.73% | 0 | 1 | 0 | 1 | |
| Estonian Centre Party | K | 6,368 | 6 | 732 | 7,106 | 15.49% | 0 | 1 | 0 | 1 | |
| Estonian Greens | EER | 1,178 | 5 | 491 | 1,674 | 3.65% | 0 | 0 | 0 | 0 | |
| People's Union of Estonia | ERL | 428 | 1 | 113 | 542 | 1.18% | 0 | 0 | 0 | 0 | |
| Estonian Independence Party | EIP | 269 | 4 | 68 | 341 | 0.74% | 0 | 0 | 0 | 0 | |
| Russian Party in Estonia | VEE | 210 | 0 | 32 | 242 | 0.53% | 0 | 0 | 0 | 0 | |
| Sten-Hans Vihmar (Independent) | 122 | 0 | 32 | 154 | 0.34% | 0 | 0 | 0 | 0 | ||
| Party of Estonian Christian Democrats | EKD | 117 | 2 | 34 | 153 | 0.33% | 0 | 0 | 0 | 0 | |
| Veiko Rämmel (Independent) | 110 | 0 | 18 | 128 | 0.28% | 0 | 0 | 0 | 0 | ||
| Valid Votes | 34,020 | 137 | 11,730 | 45,887 | 100.00% | 1 | 6 | 0 | 7 | ||
| Rejected Votes | 332 | 10 | 0 | 342 | 0.74% | ||||||
| Total Polled | 34,352 | 147 | 11,730 | 46,229 | 65.14% | ||||||
| Registered Electors | 70,821 | 147 | 70,968 | ||||||||
The following candidates were elected:[25]
- Personal mandates - Urmas Kruuse (RE), 6,824 votes.
- District mandates - Laine Jänes (RE), 2,211 votes; Tõnis Lukas (IRL), 4,807 votes; Rait Maruste (RE), 2,425 votes; Aadu Must (K), 1,901 votes; Heljo Pikhof (SDE), 3,270 votes; and Margus Tsahkna (IRL), 3,228 votes.
2007
Results of the 2007 parliamentary election held on 4 March 2007:[26][27][28]
| Party | Votes | Total Votes | % | Seats | |||||||
|---|---|---|---|---|---|---|---|---|---|---|---|
| Tartu | Over -seas |
Elec -tronic |
Per. | Dis. | Com. | Tot. | |||||
| Estonian Reform Party | RE | 14,259 | 29 | 1,047 | 15,335 | 34.64% | 1 | 2 | 0 | 3 | |
| Pro Patria and Res Publica Union | IRL | 8,758 | 129 | 720 | 9,607 | 21.70% | 0 | 1 | 1 | 2 | |
| Estonian Centre Party | K | 7,046 | 9 | 116 | 7,171 | 16.20% | 0 | 1 | 0 | 1 | |
| Social Democratic Party | SDE | 5,558 | 15 | 423 | 5,996 | 13.54% | 0 | 1 | 0 | 1 | |
| Estonian Greens | EER | 3,295 | 14 | 284 | 3,593 | 8.12% | 0 | 0 | 1 | 1 | |
| People's Union of Estonia | ERL | 1,556 | 6 | 62 | 1,624 | 3.67% | 0 | 0 | 1 | 1 | |
| Party of Estonian Christian Democrats | EKD | 509 | 11 | 24 | 544 | 1.23% | 0 | 0 | 0 | 0 | |
| Constitution Party | K | 221 | 0 | 6 | 227 | 0.51% | 0 | 0 | 0 | 0 | |
| Estonian Left Party | EVP | 88 | 0 | 3 | 91 | 0.21% | 0 | 0 | 0 | 0 | |
| Russian Party in Estonia | VEE | 81 | 0 | 0 | 81 | 0.18% | 0 | 0 | 0 | 0 | |
| Valid Votes | 41,371 | 213 | 2,685 | 44,269 | 100.00% | 1 | 5 | 3 | 9 | ||
| Rejected Votes | 456 | 6 | 0 | 462 | 1.03% | ||||||
| Total Polled | 41,827 | 219 | 2,685 | 44,731 | 62.69% | ||||||
| Registered Electors | 71,128 | 219 | 71,347 | ||||||||
The following candidates were elected:[28]
- Personal mandates - Laine Jänes (RE), 9,303 votes.
- District mandates - Hannes Astok (RE), 1,465 votes; Tõnis Lukas (IRL), 3,979 votes; Silver Meikar (RE), 902 votes; Aadu Must (K), 2,088 votes; and Heljo Pikhof (SDE), 3,270 votes.
- Compensatory mandates - Karel Rüütli (ERL), 558 votes; Toomas Trapido (EER), 1,691 votes; and Peeter Tulviste (IRL), 2,424 votes.
2003
Results of the 2003 parliamentary election held on 2 March 2003:[29][30][31]
| Party | Votes | Total Votes | % | Seats | ||||||
|---|---|---|---|---|---|---|---|---|---|---|
| Tartu | Over -seas |
Per. | Dis. | Com. | Tot. | |||||
| Estonian Reform Party | RE | 11,634 | 0 | 11,634 | 28.07% | 1 | 1 | 0 | 2 | |
| Union for the Republic–Res Publica | ÜVE-RP | 10,254 | 47 | 10,301 | 24.85% | 0 | 2 | 1 | 3 | |
| Estonian Centre Party | K | 6,426 | 5 | 6,431 | 15.51% | 0 | 1 | 0 | 1 | |
| Pro Patria Union Party | I | 4,720 | 92 | 4,812 | 11.61% | 0 | 1 | 1 | 2 | |
| Moderate People's Party | RM | 3,559 | 18 | 3,577 | 8.63% | 0 | 0 | 0 | 0 | |
| People's Union of Estonia | ERL | 3,331 | 1 | 3,332 | 8.04% | 0 | 0 | 0 | 0 | |
| Estonian United People's Party | EÜRP | 573 | 0 | 573 | 1.38% | 0 | 0 | 0 | 0 | |
| Estonian Social Democratic Labour Party | ESDTP | 228 | 0 | 228 | 0.55% | 0 | 0 | 0 | 0 | |
| Estonian Christian People's Party | EKRP | 209 | 3 | 212 | 0.51% | 0 | 0 | 0 | 0 | |
| Estonian Independence Party | EIP | 181 | 2 | 183 | 0.44% | 0 | 0 | 0 | 0 | |
| Väino Karo (Independent) | 95 | 0 | 95 | 0.23% | 0 | 0 | 0 | 0 | ||
| Russian Party in Estonia | VEE | 73 | 0 | 73 | 0.18% | 0 | 0 | 0 | 0 | |
| Valid Votes | 41,283 | 168 | 41,451 | 100.00% | 1 | 5 | 2 | 8 | ||
| Rejected Votes | 429 | 17 | 446 | 1.06% | ||||||
| Total Polled | 41,712 | 185 | 41,897 | 57.74% | ||||||
| Registered Electors | 72,380 | 185 | 72,565 | |||||||
| Turnout | 57.63% | 100.00% | 57.74% | |||||||
The following candidates were elected:[31]
- Personal mandates - Andrus Ansip (RE), 7,177 votes.
- District mandates - Margus Hanson (RE), 1,082 votes; Teet Jagomägi (ÜVE-RP), 3,753 votes; Urmo Kööbi (ÜVE-RP), 1,558 votes; Tõnis Lukas (I), 2,120 votes; Sven Mikser (K), 1,327 votes;
- Compensatory mandates - Ene Ergma (ÜVE-RP), 979 votes; and Peeter Tulviste (I), 1,572 votes.
1999
Results of the 1999 parliamentary election held on 7 March 1999:[32][33][34]
| Party | Votes | Total Votes | % | Seats | ||||||
|---|---|---|---|---|---|---|---|---|---|---|
| Tartu | Over -seas |
Per. | Dis. | Com. | Tot. | |||||
| Estonian Reform Party | RE | 10,151 | 18 | 10,169 | 26.18% | 1 | 1 | 0 | 2 | |
| Pro Patria Union | I | 9,593 | 270 | 9,863 | 25.39% | 1 | 1 | 1 | 3 | |
| Estonian Centre Party | K | 6,785 | 4 | 6,789 | 17.48% | 0 | 1 | 1 | 2 | |
| Moderate | M | 5,875 | 39 | 5,914 | 15.22% | 0 | 1 | 1 | 2 | |
| Estonian Coalition Party | KE | 1,954 | 2 | 1,956 | 5.04% | 0 | 0 | 0 | 0 | |
| Estonian Country People's Party | EME | 1,109 | 0 | 1,109 | 2.85% | 0 | 0 | 0 | 0 | |
| Russian Party in Estonia | VEE | 817 | 0 | 817 | 2.10% | 0 | 0 | 0 | 0 | |
| Estonian United People's Party | EÜRP | 813 | 0 | 813 | 2.09% | 0 | 0 | 0 | 0 | |
| Estonian Blue Party | ESE | 486 | 5 | 491 | 1.26% | 0 | 0 | 0 | 0 | |
| Estonian Christian People's Party | EKRP | 399 | 0 | 399 | 1.03% | 0 | 0 | 0 | 0 | |
| Farmers' Assembly | 277 | 4 | 281 | 0.72% | 0 | 0 | 0 | 0 | ||
| Malle Salupere (Independent) | 204 | 0 | 204 | 0.53% | 0 | 0 | 0 | 0 | ||
| Progress Party | 40 | 1 | 41 | 0.11% | 0 | 0 | 0 | 0 | ||
| Valid Votes | 38,503 | 343 | 38,846 | 100.00% | 2 | 4 | 3 | 9 | ||
| Rejected Votes | 697 | 16 | 713 | 1.80% | ||||||
| Total Polled | 39,200 | 359 | 39,559 | 57.39% | ||||||
| Registered Electors | 68,567 | 359 | 68,926 | |||||||
| Turnout | 57.17% | 100.00% | 57.39% | |||||||
The following candidates were elected:[34]
- Personal mandates - Tõnis Lukas (I), 5,667 votes; and Toomas Savi (RE), 6,535 votes.
- District mandates - Jüri Adams (I), 1,914 votes; Andrus Ansip (RE), 898 votes; Tõnu Kauba (K), 1,244 voets; Marju Lauristin (M), 3,585 votes.
- Compensatory mandates - Jaan Leppik (I), 912 votes; Mihkel Pärnoja (M), 237 votes; and Olev Raju (K), 899 votes.
1995
Results of the 1995 parliamentary election held on 5 March 1995:[35][36][37]
| Party | Votes | Total Votes | % | Seats | ||||||
|---|---|---|---|---|---|---|---|---|---|---|
| Tartu | Over -seas |
Per. | Dis. | Com. | Tot. | |||||
| Coalition Party and Rural People's Association | KMÜ | 7,632 | 39 | 7,671 | 18.56% | 0 | 1 | 1 | 2 | |
| Estonian Reform Party | RE | 7,468 | 80 | 7,548 | 18.26% | 1 | 0 | 1 | 2 | |
| Pro Patria and ERSP Union | I\ERSP | 6,363 | 449 | 6,812 | 16.48% | 0 | 1 | 1 | 2 | |
| Estonian Centre Party | K | 4,028 | 15 | 4,043 | 9.78% | 0 | 0 | 2 | 2 | |
| Estonian Future Party | TEE | 3,676 | 23 | 3,699 | 8.95% | 0 | 0 | 0 | 0 | |
| The Right Wingers | P | 3,090 | 77 | 3,167 | 7.66% | 0 | 0 | 1 | 1 | |
| Our Home is Estonia | MKOE | 2,248 | 3 | 2,251 | 5.45% | 0 | 0 | 2 | 2 | |
| Moderate | M | 1,899 | 43 | 1,942 | 4.70% | 0 | 0 | 1 | 1 | |
| Better Estonia/Estonian Citizen | PE/EK | 1,189 | 22 | 1,211 | 2.93% | 0 | 0 | 0 | 0 | |
| Justice | Õ | 1,023 | 0 | 1,023 | 2.48% | 0 | 0 | 0 | 0 | |
| Fourth Force | NJ | 690 | 6 | 696 | 1.68% | 0 | 0 | 0 | 0 | |
| Estonian National Federation | ERKL | 371 | 8 | 379 | 0.92% | 0 | 0 | 0 | 0 | |
| Henn Täär (Independent) | 324 | 0 | 324 | 0.78% | 0 | 0 | 0 | 0 | ||
| Estonian Farmers' Party | ETRE | 220 | 2 | 222 | 0.54% | 0 | 0 | 0 | 0 | |
| Forest Party | 185 | 1 | 186 | 0.45% | 0 | 0 | 0 | 0 | ||
| Blue Party | SE | 100 | 1 | 101 | 0.24% | 0 | 0 | 0 | 0 | |
| Estonian Democratic Union | EDL | 56 | 2 | 58 | 0.14% | 0 | 0 | 0 | 0 | |
| Valid Votes | 40,562 | 771 | 41,333 | 100.00% | 1 | 2 | 9 | 12 | ||
| Rejected Votes | 413 | 0 | 413 | 0.99% | ||||||
| Total Polled | 40,975 | 771 | 41,746 | 64.99% | ||||||
| Registered Electors | 63,463 | 771 | 64,234 | |||||||
| Turnout | 64.57% | 100.00% | 64.99% | |||||||
The following candidates were elected:[37]
- Personal mandates - Toomas Savi (RE), 6,306 votes.
- District mandates - Rein Järlik (KMÜ), 3,970 votes; and Tõnis Lukas (I\ERSP), 3,147 votes.
- Compensatory mandates - Sergei Issakov (MKOE), 619 votes; Tõnu Kõrda (K), 470 votes; Mati Meos (KMÜ), 436 votes; Aap Neljas (RE), 496 votes; Mihkel Pärnoja (M), 389 votes; Valentin Strukov (MKOE), 1,188 votes; Enn Tarto (P), 2,814 votes; Lauri Vahtre (I\ERSP), 1,743 votes; and Andra Veidemann (K), 1,481 votes.
References
- ^ "RV022U: Population by sex, age group and county, 1 January. administrative division as at 01.01.2018". Tallinn, Estonia: Statistics Estonia. Retrieved 21 January 2021.
- ^ "Members of the Riigikogu". Tallinn, Estonia: Riigikogu. Retrieved 21 January 2021.
- ^ "Election for Estonian Parliament". Election Guide. Arlington, U.S.A.: International Foundation for Electoral Systems. Retrieved 19 January 2021.
- ^ "Electoral Assistance: ElecData, Compendium of Electoral Data - Estonia". Strasbourg, France: Council of Europe. Retrieved 19 January 2021.
- ^ a b c d e f g "Estonian elections in a nutshell: Ascertaining the results - Ascertaining the election results at Riigikogu elections". Tallinn, Estonia: National Electoral Committee of Estonia. Retrieved 23 December 2020.
- ^ "Mandaatide jaotamine XV Riigikogu valimistel". Tallinn, Estonia: National Electoral Committee of Esotnia. 30 November 2022. Retrieved 17 March 2023.
- ^ "Mandaatide jaotamine XIV Riigikogu valimistel" (in Estonian). Tallinn, Estonia: Riigi Teataja. 5 December 2018. Retrieved 21 January 2021.
- ^ "Mandaatide jaotamine XIII Riigikogu valimistel" (in Estonian). Tallinn, Estonia: Riigi Teataja. 2 December 2014. Retrieved 21 January 2021.
- ^ "Mandaatide jaotamine XII Riigikogu valimistel" (in Estonian). Tallinn, Estonia: Riigi Teataja. 3 December 2010. Retrieved 21 January 2021.
- ^ "Riigikogu valimine 4 Märts 2007: Üldandmed - Valimisringkonnad ja mandaatide jaotus" (in Estonian). Tallinn, Estonia: National Electoral Committee of Estonia. Retrieved 20 January 2021.
- ^ "Riigikogu valimine 2 Märts 2003: Üldandmed - Valimisringkonnad ja mandaatide jaotus" (in Estonian). Tallinn, Estonia: National Electoral Committee of Estonia. Retrieved 21 January 2021.
- ^ "Riigikogu valimine 7 Märts 1999: Üldandmed - Valimisringkonnad ja mandaatide jaotus" (in Estonian). Tallinn, Estonia: National Electoral Committee of Estonia. Retrieved 21 January 2021.
- ^ Heinsalu, Alo; Koitmäe, Arne; Mandre, Leino; Pilving, Mihkel; Vinkel, Priit (2016). Eero, Gerli (ed.). Elections in Estonia: 1992-2015 (PDF). Tallinn, Estonia: National Electoral Committee of Estonia. p. 42. ISSN 2504-5555. Retrieved 19 January 2021.
- ^ "Riigikogu valimised 2023: Hääletamis- ja valimistulemus - Valimisringkond nr 10 (Tartu linn)". Tallinn, Estonia: National Electoral Committee of Estonia. Retrieved 19 March 2023.
- ^ "Riigikogu valimised 2023: Detailne hääletamistulemus - Valimisringkond nr 10 (Tartu linn)". Tallinn, Estonia: National Electoral Committee of Estonia. Retrieved 19 March 2023.
- ^ a b "Riigikogu valimised 2019: Valitud Riigikogu liikmed - Mandaatide omandamise viis". Tallinn, Estonia: National Electoral Committee of Estonia. Retrieved 19 March 2023.
- ^ "Riigikogu valimised 2019: Hääletamis- ja valimistulemus - Valimisringkond nr 10 (Tartu linn)" (in Estonian). Tallinn, Estonia: National Electoral Committee of Estonia. Retrieved 21 January 2021.
- ^ "Riigikogu valimised 2019: Detailne hääletamistulemus - Valimisringkond nr 10 (Tartu linn)" (in Estonian). Tallinn, Estonia: National Electoral Committee of Estonia. Retrieved 21 January 2021.
- ^ a b "Riigikogu valimised 2019: Valitud Riigikogu liikmed - Mandaatide omandamise viis" (in Estonian). Tallinn, Estonia: National Electoral Committee of Estonia. Retrieved 21 January 2021.
- ^ "Riigikogu valimised 2015: Hääletamis- ja valimistulemus hetkeseisuga - Valimisringkond 10 (Tartu linn)" (in Estonian). Tallinn, Estonia: National Electoral Committee of Estonia. Retrieved 21 January 2021.
- ^ "Riigikogu valimised 2015: Detailne hääletamistulemus - Valimisringkond nr 10 (Tartu linn)" (in Estonian). Tallinn, Estonia: National Electoral Committee of Estonia. Retrieved 21 January 2021.
- ^ a b "Riigikogu valimised 2015: Valitud Riigikogu liikmed - Mandaatide omandamise viis" (in Estonian). Tallinn, Estonia: National Electoral Committee of Estonia. Retrieved 21 January 2021.
- ^ "Riigikogu valimised 2011: Valimistulemus - Hääletamistulemus - Valimisringkond 10 (Tartu linn)" (in Estonian). Tallinn, Estonia: National Electoral Committee of Estonia. Retrieved 22 January 2021.
- ^ "Riigikogu valimised 2011: Hääletamistulemus - Valimisringkond 10 (Tartu linn)" (in Estonian). Tallinn, Estonia: National Electoral Committee of Estonia. Retrieved 22 January 2021.
- ^ a b "Riigikogu valimised 2011: Valitud Riigikogu liikmed - Mandaatide omandamise viis" (in Estonian). Tallinn, Estonia: National Electoral Committee of Estonia. Retrieved 22 January 2021.
- ^ "Riigikogu valimine 4 Märts 2007: Häälte ja mandaatide jaotus - Tartu Linn" (in Estonian). Tallinn, Estonia: National Electoral Committee of Estonia. Retrieved 24 January 2021.
- ^ "Riigikogu valimine 4 Märts 2007: Valimistulemus - Hääletamistulemus - Valimisringkond nr 10" (in Estonian). Tallinn, Estonia: National Electoral Committee of Estonia. Retrieved 24 January 2021.
- ^ a b "Riigikogu valimine 4 Märts 2007: Valimistulemus - Mandaatide omandamise viis" (in Estonian). Tallinn, Estonia: National Electoral Committee of Estonia. Retrieved 24 January 2021.
- ^ "Riigikogu valimine 2 Märts 2003: Häälte ja mandaatide jaotus - Tartu Linn" (in Estonian). Tallinn, Estonia: National Electoral Committee of Estonia. Retrieved 24 January 2021.
- ^ "Riigikogu valimine 2 Märts 2003: Valimistulemus - Hääletamistulemus - Valimisringkond nr 10" (in Estonian). Tallinn, Estonia: National Electoral Committee of Estonia. Retrieved 24 January 2021.
- ^ a b "Riigikogu valimine 2 Märts 2003: Valimistulemus - Mandaatide omandamise viis" (in Estonian). Tallinn, Estonia: National Electoral Committee of Estonia. Retrieved 24 January 2021.
- ^ "Riigikogu valimine 7 Märts 1999: Valimispäev - Tartu Linn" (in Estonian). Tallinn, Estonia: National Electoral Committee of Estonia. Retrieved 24 January 2021.
- ^ "Riigikogu valimine 7 Märts 1999: Hääletamistulemus - Valimisringkond nr 9" (in Estonian). Tallinn, Estonia: National Electoral Committee of Estonia. Retrieved 24 January 2021.
- ^ a b "Riigikogu valimine 7 Märts 1999: Valimistulemus - Mandaatide omandamise viis" (in Estonian). Tallinn, Estonia: National Electoral Committee of Estonia. Retrieved 24 January 2021.
- ^ "Riigikogu valimine 5 Märts 1995: Valimispäev - Tartu Linn" (in Estonian). Tallinn, Estonia: National Electoral Committee of Estonia. Retrieved 24 January 2021.
- ^ "Riigikogu valimine 5 Märts 1995: Hääletamistulemus - Valimisringkond nr 9" (in Estonian). Tallinn, Estonia: National Electoral Committee of Estonia. Retrieved 24 January 2021.
- ^ a b "Riigikogu valimine 5 Märts 1995: Valimistulemus - Mandaatide omandamise viis" (in Estonian). Tallinn, Estonia: National Electoral Committee of Estonia. Retrieved 24 January 2021.