
| Electoral district no. 1 | |
|---|---|
| Valimisringkond nr 1Hendrik Johannes Terras | |
| Electoral District for the Riigikogu | |
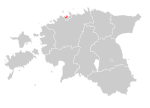 Location of Electoral district no. 1 within Estonia | |
| Municipality | Tallinn |
| County | Harju |
| Population | 169,247 (2020)[1] |
| Electorate | 85,469 (2019) |
| Current Electoral District | |
| Created | 1995 |
| Seats | List
|
| Member of the Riigikogu[2] | List |
Electoral district no. 1 (Estonian: Valimisringkond nr 1) is one of the 12 multi-member electoral districts of the Riigikogu, the national legislature of Estonia. The electoral district was established in 1995 following the re-organisation of the electoral districts in Tallinn. It is conterminous with the districts of Haabersti, Kristiine and Põhja-Tallinn in Tallinn. The district currently elects 10 of the 101 members of the Riigikogu using the open party-list proportional representation electoral system. At the 2019 parliamentary election it had 85,469 registered electors.
Electoral system
Electoral district no. 1 currently elects 10 of the 101 members of the Riigikogu using the open party-list proportional representation electoral system.[3][4] The allocation of seats is carried out in three stages. In the first stage, any individual candidate, regardless of whether they are a party or independent candidate, who receives more votes than the district's simple quota (Hare quota: valid votes in district/number of seats allocated to district) is elected via a personal mandate.[5] In the second stage, district mandates are allocated to parties by dividing their district votes by the district's simple quota.[5] Only parties that reach the 5% national threshold compete for district mandates and any personal mandates won by the party are subtracted from the party's district mandates.[5] Prior to 2003 if a party's surplus/remainder votes was equal to or greater than 75% of the district's simple quota it received one additional district mandate.[5] Any unallocated district seats are added to a national pool of compensatory seats.[5] In the final stage, compensatory mandates are calculated based on the national vote and using a modified D'Hondt method.[5] Only parties that reach the 5% national threshold compete for compensatory seats and any personal and district mandates won by the party are subtracted from the party's compensatory mandates.[5] Though calculated nationally, compensatory mandates are allocated at the district level.
Seats
Seats allocated to electoral district no. 1 by the National Electoral Committee of Estonia at each election was as follows:
- 2023 - 10[6]
- 2019 - 10[7]
- 2015 - 9[8]
- 2011 - 9[9]
- 2007 - 8[10]
- 2003 - 8[11]
- 1999 - 8[12]
- 1995 - 8[13]
Election results
Summary
| Election | Left EÜVP/EVP/ESDTP/Õ/V |
Constitution K/EÜRP/MKOE |
Social Democrats SDE/RM/M |
Greens EER/NJ/R |
Centre K/R |
Estonia 200 EE200 |
Reform RE |
Isamaa I/IRL/I/I\ERSP/I |
Conservative People's EKRE/ERL/EME/KMÜ | ||||||||||||||||||
|---|---|---|---|---|---|---|---|---|---|---|---|---|---|---|---|---|---|---|---|---|---|---|---|---|---|---|---|
| Votes | % | Seats | Votes | % | Seats | Votes | % | Seats | Votes | % | Seats | Votes | % | Seats | Votes | % | Seats | Votes | % | Seats | Votes | % | Seats | Votes | % | Seats | |
| 2023 | 2,016 | 3.27% | 0 | 6,165 | 10.00% | 1 | 665 | 1.08% | 0 | 12,870 | 20.89% | 2 | 9,638 | 15.64% | 1 | 19,346 | 31.40% | 3 | 3,471 | 5.56% | 0 | 5,956 | 9.67% | 1 | |||
| 2019 | 70 | 0.12% | 0 | 5,683 | 10.11% | 1 | 1,812 | 3.22% | 0 | 16,950 | 30.16% | 3 | 2,635 | 4.69% | 0 | 16,299 | 29.01% | 3 | 4,950 | 8.81% | 1 | 6,361 | 11.32% | 1 | |||
| 2015 | 39 | 0.07% | 0 | 7,718 | 13.70% | 1 | 539 | 0.96% | 0 | 18,916 | 33.58% | 3 | 14,149 | 25.11% | 2 | 7,193 | 12.77% | 1 | 2,986 | 5.30% | 0 | ||||||
| 2011 | 7,210 | 13.68% | 1 | 1,128 | 2.14% | 0 | 17,072 | 32.38% | 3 | 12,396 | 23.51% | 2 | 10,984 | 20.83% | 2 | 324 | 0.61% | 0 | |||||||||
| 2007 | 82 | 0.17% | 0 | 716 | 1.50% | 0 | 4,498 | 9.40% | 1 | 3,421 | 7.15% | 0 | 15,949 | 33.34% | 2 | 11,871 | 24.81% | 2 | 9,363 | 19.57% | 1 | 573 | 1.20% | 0 | |||
| 2003 | 387 | 0.94% | 0 | 1,109 | 2.71% | 0 | 2,251 | 5.50% | 0 | 12,235 | 29.87% | 2 | 7,787 | 19.01% | 1 | 2,765 | 6.75% | 0 | 1,376 | 3.36% | 0 | ||||||
| 1999 | 2,589 | 6.69% | 0 | 5,192 | 13.42% | 1 | 6,927 | 17.90% | 1 | 7,003 | 18.10% | 1 | 8,778 | 22.69% | 1 | 637 | 1.65% | 0 | |||||||||
| 1995 | 841 | 1.98% | 0 | 5,047 | 11.87% | 0 | 1,704 | 4.01% | 0 | 328 | 0.77% | 0 | 6,851 | 16.11% | 1 | 10,858 | 25.54% | 1 | 3,172 | 7.46% | 0 | 9,335 | 21.96% | 1 | |||
(Excludes compensatory seats)
Detailed
2023
Results of the 2019 parliamentary election held on 5 March 2023:[14][15][16]
| Party | Votes per district | Total Votes | % | Seats | |||||||||
|---|---|---|---|---|---|---|---|---|---|---|---|---|---|
| Haaber -sti |
Kris -tiine |
Põhja- Tallinn |
Over -seas |
Elec -tronic |
Per. | Dis. | Com. | Tot. | |||||
| Estonian Reform Party | REF | 1,492 | 1,643 | 1,436 | 52 | 14,241 | 19,346 | 31.40% | 1 | 2 | 1 | 4 | |
| Estonian Centre Party | KESK | 3,741 | 1,662 | 3,332 | 12 | 3,632 | 12,870 | 20.89% | 0 | 2 | 2 | 4 | |
| Estonia 200 | EE200 | 715 | 873 | 873 | 20 | 6,935 | 9,638 | 15.64% | 0 | 1 | 1 | 2 | |
| Social Democratic Party | SDE | 437 | 558 | 804 | 19 | 4,112 | 6,165 | 10.00% | 0 | 1 | 0 | 1 | |
| Conservative People's Party of Estonia | EKRE | 1,232 | 1,202 | 1,445 | 52 | 1,732 | 5,956 | 9.67% | 0 | 1 | 0 | 1 | |
| Isamaa | IE | 442 | 547 | 438 | 10 | 1,893 | 3,471 | 5.63% | 0 | 0 | 1 | 1 | |
| Estonian United Left Party | EÜVP | 671 | 230 | 674 | 5 | 363 | 2,016 | 3.27% | 0 | 0 | 0 | 0 | |
| Parempoolsed | 116 | 167 | 187 | 3 | 896 | 1,404 | 2.28% | 0 | 0 | 0 | 0 | ||
| Estonian Greens | EER | 57 | 73 | 99 | 2 | 415 | 665 | 1.08% | 0 | 0 | 0 | 0 | |
| Indrek Nicholas Nurmberg (Independent) | 15 | 17 | 21 | 1 | 23 | 79 | 0.01% | 0 | 0 | 0 | 0 | ||
| Valid Votes | 8,918 | 6,972 | 9,309 | 176 | 34,242 | 61,610 | 100.00% | 1 | 7 | 5 | 13 | ||
| Rejected Votes | 386 | 85 | 124 | 5 | 0 | 600 | 0.03% | ||||||
| Total Polled | 9,304 | 7,057 | 9,433 | 179 | 34,242 | 62,010 | 64.82% | ||||||
| Registered Electors | 29,987 | 22,078 | 34,242 | 9,353 | 95,660 | ||||||||
The following candidates were elected:[16]
- Personal mandates - Kristen Michal (REF), 9,214 votes.
- District mandates - Vadim Belobrovtsev (KESK), 3,231 votes; Raimond Kaljulaid (SDE), 1,819 votes; Anastassia Kovalenko-Kõlvart (KESK), 2,806 votes; Johanna-Maria Lehtme (EE200), 5,251 votes; Pärtel-Peeter Pere (REF), 1,474 votes; Signe Riisalo (REF), 4,523 votes and Varro Vooglaid (EKRE), 2,509 votes.
- Compensatory mandates - Andre Hanimägi (KESK), 466 votes; Tanel Kiik (KESK), 1,610 votes; Riina Solman (IE), 1,773 votes; Hendrik Johannes Terras (E200), 1,610 votes; Kristo Enn Vaga (REF), 591 votes.
2019
Results of the 2019 parliamentary election held on 3 March 2019:[17][18][19]
| Party | Votes per district | Total Votes | % | Seats | |||||||||
|---|---|---|---|---|---|---|---|---|---|---|---|---|---|
| Haaber -sti |
Kris -tiine |
Põhja- Tallinn |
Over -seas |
Elec -tronic |
Per. | Dis. | Com. | Tot. | |||||
| Estonian Centre Party | K | 5,069 | 2,323 | 5,942 | 33 | 3,583 | 16,950 | 30.16% | 1 | 2 | 1 | 4 | |
| Estonian Reform Party | RE | 1,587 | 1,616 | 1,733 | 40 | 11,323 | 16,299 | 29.01% | 1 | 2 | 0 | 3 | |
| Conservative People's Party of Estonia | EKRE | 1,165 | 1,267 | 1,483 | 69 | 2,377 | 6,361 | 11.32% | 0 | 1 | 0 | 1 | |
| Social Democratic Party | SDE | 565 | 547 | 909 | 30 | 3,632 | 5,683 | 10.11% | 0 | 1 | 1 | 2 | |
| Isamaa | I | 666 | 757 | 778 | 14 | 2,735 | 4,950 | 8.81% | 0 | 1 | 0 | 1 | |
| Estonia 200 | 250 | 259 | 381 | 5 | 1,740 | 2,635 | 4.69% | 0 | 0 | 0 | 0 | ||
| Estonian Greens | EER | 172 | 186 | 360 | 10 | 1,084 | 1,812 | 3.22% | 0 | 0 | 0 | 0 | |
| Estonian Biodiversity Party | 63 | 77 | 133 | 3 | 363 | 639 | 1.14% | 0 | 0 | 0 | 0 | ||
| Estonian Free Party | EVA | 43 | 72 | 96 | 7 | 246 | 464 | 0.83% | 0 | 0 | 0 | 0 | |
| Magnus Saar (Independent) | 33 | 32 | 61 | 4 | 86 | 216 | 0.38% | 0 | 0 | 0 | 0 | ||
| Hannes Veskimäe (Independent) | 16 | 14 | 19 | 0 | 63 | 112 | 0.20% | 0 | 0 | 0 | 0 | ||
| Estonian United Left Party | EÜVP | 17 | 10 | 22 | 0 | 21 | 70 | 0.12% | 0 | 0 | 0 | 0 | |
| Valid Votes | 9,646 | 7,160 | 11,917 | 215 | 27,253 | 56,191 | 100.00% | 2 | 7 | 2 | 11 | ||
| Rejected Votes | 78 | 339 | 116 | 5 | 0 | 538 | 0.95% | ||||||
| Total Polled | 9,724 | 7,499 | 12,033 | 220 | 27,253 | 56,729 | 66.37% | ||||||
| Registered Electors | 28,262 | 22,289 | 34,228 | 690 | 85,469 | ||||||||
The following candidates were elected:[19]
- Personal mandates - Raimond Kaljulaid (K), 7,303 votes; and Kristen Michal (RE), 6,347 votes.
- District mandates - Arto Aas (RE), 2,339 votes; Vadim Belobrovtsev[a] (K), 1,969 votes; Marek Jürgenson (K), 1,813 votes; Tarmo Kruusimäe (I), 1,811 votes; Sven Mikser (SDE), 1,693 votes; Heidy Purga (RE), 4,763 votes; and Urmas Reitelmann (EKRE), 2,585 votes.
- Compensatory mandates - Kalev Kallo (K), 289 votes; and Riina Sikkut (SDE), 1,610 votes.
2015
Results of the 2015 parliamentary election held on 1 March 2015:[21][22][23]
| Party | Votes per district | Total Votes | % | Seats | |||||||||
|---|---|---|---|---|---|---|---|---|---|---|---|---|---|
| Haaber -sti |
Kris -tiine |
Põhja- Tallinn |
Over -seas |
Elec -tronic |
Per. | Dis. | Com. | Tot. | |||||
| Estonian Centre Party | K | 6,435 | 3,126 | 7,617 | 30 | 1,708 | 18,916 | 33.58% | 1 | 2 | 2 | 5 | |
| Estonian Reform Party | RE | 2,182 | 2,335 | 2,279 | 40 | 7,313 | 14,149 | 25.11% | 0 | 2 | 0 | 2 | |
| Social Democratic Party | SDE | 1,215 | 1,250 | 1,733 | 24 | 3,496 | 7,718 | 13.70% | 0 | 1 | 0 | 1 | |
| Pro Patria and Res Publica Union | IRL | 1,251 | 1,292 | 1,336 | 35 | 3,279 | 7,193 | 12.77% | 0 | 1 | 0 | 1 | |
| Estonian Free Party | EVA | 651 | 747 | 945 | 13 | 2,201 | 4,557 | 8.09% | 0 | 0 | 1 | 1 | |
| Conservative People's Party of Estonia | EKRE | 615 | 696 | 764 | 11 | 900 | 2,986 | 5.30% | 0 | 0 | 0 | 0 | |
| Estonian Greens | EER | 69 | 100 | 141 | 3 | 226 | 539 | 0.96% | 0 | 0 | 0 | 0 | |
| Estonian Independence Party | EIP | 23 | 31 | 30 | 0 | 23 | 107 | 0.19% | 0 | 0 | 0 | 0 | |
| Party of People's Unity | RÜE | 16 | 18 | 23 | 2 | 30 | 89 | 0.16% | 0 | 0 | 0 | 0 | |
| Svetlana Ivnitskaja (Independent) | 12 | 8 | 18 | 0 | 8 | 46 | 0.08% | 0 | 0 | 0 | 0 | ||
| Estonian United Left Party | EÜVP | 15 | 8 | 13 | 0 | 3 | 39 | 0.07% | 0 | 0 | 0 | 0 | |
| Valid Votes | 12,484 | 9,611 | 14,899 | 158 | 19,187 | 56,339 | 100.00% | 1 | 6 | 3 | 10 | ||
| Rejected Votes | 100 | 82 | 126 | 3 | 0 | 311 | 0.55% | ||||||
| Total Polled | 12,584 | 9,693 | 15,025 | 161 | 19,187 | 56,650 | 68.91% | ||||||
| Registered Electors | 26,913 | 21,786 | 33,345 | 161 | 82,205 | ||||||||
The following candidates were elected:[23]
- Personal mandates - Mihhail Kõlvart (K), 10,996 votes.
- District mandates - Kristen Michal (RE), 4,766 votes; Eiki Nestor (SDE), 3,744 votes; Heidy Purga (RE), 3,283 votes; Märt Sults (K), 1,285 votes; Ken-Marti Vaher (IRL), 2,313 votes; and Viktor Vassiljev (K), 1,862 votes.
- Compensatory mandates - Kalev Kallo (K), 575 votes; Külliki Kübarsepp (EVA), 1,032 votes; and Lauri Laasi (K), 407 votes.
2011
Results of the 2011 parliamentary election held on 6 March 2011:[24][25][26]
| Party | Votes per district | Total Votes | % | Seats | |||||||||
|---|---|---|---|---|---|---|---|---|---|---|---|---|---|
| Haaber -sti |
Kris -tiine |
Põhja- Tallinn |
Over -seas |
Elec -tronic |
Per. | Dis. | Com. | Tot. | |||||
| Estonian Centre Party | K | 5,336 | 2,835 | 6,967 | 12 | 1,922 | 17,072 | 32.38% | 1 | 2 | 1 | 4 | |
| Estonian Reform Party | RE | 2,431 | 2,398 | 2,404 | 38 | 5,125 | 12,396 | 23.51% | 1 | 1 | 1 | 3 | |
| Pro Patria and Res Publica Union | IRL | 2,104 | 2,332 | 2,430 | 69 | 4,049 | 10,984 | 20.83% | 0 | 2 | 0 | 2 | |
| Social Democratic Party | SDE | 1,403 | 1,378 | 1,899 | 35 | 2,495 | 7,210 | 13.68% | 0 | 1 | 0 | 1 | |
| Mart Helme (Independent) | 499 | 589 | 654 | 15 | 710 | 2,467 | 4.68% | 0 | 0 | 0 | 0 | ||
| Estonian Greens | EER | 204 | 208 | 318 | 9 | 389 | 1,128 | 2.14% | 0 | 0 | 0 | 0 | |
| Russian Party in Estonia | VEE | 254 | 97 | 190 | 2 | 140 | 683 | 1.30% | 0 | 0 | 0 | 0 | |
| People's Union of Estonia | ERL | 75 | 73 | 90 | 1 | 85 | 324 | 0.61% | 0 | 0 | 0 | 0 | |
| Party of Estonian Christian Democrats | EKD | 43 | 68 | 90 | 0 | 48 | 249 | 0.47% | 0 | 0 | 0 | 0 | |
| Estonian Independence Party | EIP | 36 | 26 | 38 | 1 | 22 | 123 | 0.23% | 0 | 0 | 0 | 0 | |
| Andres Ergma (Independent) | 21 | 10 | 22 | 0 | 17 | 70 | 0.13% | 0 | 0 | 0 | 0 | ||
| Svetlana Ivnitskaja (Independent) | 5 | 4 | 5 | 0 | 2 | 16 | 0.03% | 0 | 0 | 0 | 0 | ||
| Valid Votes | 12,411 | 10,018 | 15,107 | 182 | 15,004 | 52,722 | 100.00% | 2 | 6 | 2 | 10 | ||
| Rejected Votes | 133 | 108 | 159 | 14 | 0 | 414 | 0.78% | ||||||
| Total Polled | 12,544 | 10,126 | 15,266 | 196 | 15,004 | 53,136 | 69.74% | ||||||
| Registered Electors | 25,109 | 20,170 | 30,714 | 196 | 76,189 | ||||||||
The following candidates were elected:[26]
- Personal mandates - Deniss Boroditš (K), 5,896 votes; and Taavi Rõivas (RE), 6,710 votes.
- District mandates - Andres Herkel (IRL), 1,765 votes; Tarmo Leinatamm (RE), 1,562 votes; Eiki Nestor (SDE), 4,003 votes; Yana Toom (K), 4,510 votes; Ken-Marti Vaher (IRL), 5,412 votes; and Viktor Vassiljev (K), 1,914 votes.
- Compensatory mandates - Remo Holsmer (RE), 694 votes; and Kalev Kallo (K), 308 votes.
2007
Results of the 2007 parliamentary election held on 4 March 2007:[27][28][29]
| Party | Votes per district | Total Votes | % | Seats | |||||||||
|---|---|---|---|---|---|---|---|---|---|---|---|---|---|
| Haaber -sti |
Kris -tiine |
Põhja- Tallinn |
Over -seas |
Elec -tronic |
Per. | Dis. | Com. | Tot. | |||||
| Estonian Centre Party | K | 5,282 | 3,075 | 7,200 | 11 | 381 | 15,949 | 33.34% | 1 | 1 | 1 | 3 | |
| Estonian Reform Party | RE | 3,901 | 3,536 | 3,262 | 21 | 1,151 | 11,871 | 24.81% | 1 | 1 | 0 | 2 | |
| Pro Patria and Res Publica Union | IRL | 2,645 | 2,877 | 2,769 | 86 | 986 | 9,363 | 19.57% | 0 | 1 | 2 | 3 | |
| Social Democratic Party | SDE | 1,159 | 1,304 | 1,503 | 53 | 479 | 4,498 | 9.40% | 0 | 1 | 0 | 1 | |
| Estonian Greens | EER | 864 | 975 | 1,193 | 12 | 377 | 3,421 | 7.15% | 0 | 0 | 1 | 1 | |
| Party of Estonian Christian Democrats | EKD | 308 | 306 | 408 | 12 | 46 | 1,080 | 2.26% | 0 | 0 | 0 | 0 | |
| Constitution Party | K | 293 | 109 | 298 | 1 | 15 | 716 | 1.50% | 0 | 0 | 0 | 0 | |
| People's Union of Estonia | ERL | 175 | 148 | 203 | 0 | 47 | 573 | 1.20% | 0 | 0 | 0 | 0 | |
| Estonian Independence Party | EIP | 35 | 26 | 53 | 1 | 16 | 131 | 0.27% | 0 | 0 | 0 | 0 | |
| Russian Party in Estonia | VEE | 43 | 19 | 52 | 1 | 5 | 120 | 0.25% | 0 | 0 | 0 | 0 | |
| Estonian Left Party | EVP | 26 | 27 | 26 | 0 | 3 | 82 | 0.17% | 0 | 0 | 0 | 0 | |
| Svetlana Ivnitskaja (Independent) | 12 | 3 | 10 | 1 | 1 | 27 | 0.06% | 0 | 0 | 0 | 0 | ||
| Niina-Inessa Stepanova (Independent) | 3 | 6 | 1 | 0 | 1 | 11 | 0.02% | 0 | 0 | 0 | 0 | ||
| Valid Votes | 14,746 | 12,411 | 16,978 | 199 | 3,508 | 47,842 | 100.00% | 2 | 4 | 4 | 10 | ||
| Rejected Votes | 115 | 85 | 133 | 7 | 0 | 340 | 0.71% | ||||||
| Total Polled | 14,861 | 12,496 | 17,111 | 206 | 3,508 | 48,182 | 66.26% | ||||||
| Registered Electors | 23,269 | 19,739 | 29,500 | 206 | 72,714 | ||||||||
The following candidates were elected:[29]
- Personal mandates - Rein Lang (RE), 7,025 votes; and Vilja Savisaar (K), 8,531 votes.
- District mandates - Jaak Aaviksoo (IRL), 4,241 votes; Eiki Nestor (SDE), 2,615 votes; Taavi Rõivas (RE), 1,701 votes; and Vladimir Velman (K), 3,342 votes.
- Compensatory mandates - Andres Herkel (IRL), 1,244 votes; Lauri Laasi (K), 705 votes; Maret Merisaar (EER), 443 votes; and Ken-Marti Vaher (IRL), 2,313 votes.
2003
Results of the 2003 parliamentary election held on 2 March 2003:[30][31][32]
| Party | Votes per district | Total Votes | % | Seats | ||||||||
|---|---|---|---|---|---|---|---|---|---|---|---|---|
| Haaber -sti |
Kris -tiine |
Põhja- Tallinn |
Over -seas |
Per. | Dis. | Com. | Tot. | |||||
| Estonian Centre Party | K | 3,341 | 3,063 | 5,815 | 16 | 12,235 | 29.87% | 1 | 1 | 1 | 3 | |
| Union for the Republic–Res Publica | ÜVE-RP | 4,041 | 4,079 | 4,039 | 47 | 12,206 | 29.80% | 1 | 1 | 2 | 4 | |
| Estonian Reform Party | RE | 3,176 | 2,413 | 2,184 | 14 | 7,787 | 19.01% | 0 | 1 | 0 | 1 | |
| Pro Patria Union Party | I | 842 | 895 | 961 | 67 | 2,765 | 6.75% | 0 | 0 | 1 | 1 | |
| Moderate People's Party | RM | 665 | 642 | 923 | 21 | 2,251 | 5.50% | 0 | 0 | 1 | 1 | |
| People's Union of Estonia | ERL | 456 | 445 | 472 | 3 | 1,376 | 3.36% | 0 | 0 | 0 | 0 | |
| Estonian United People's Party | EÜRP | 469 | 196 | 440 | 4 | 1,109 | 2.71% | 0 | 0 | 0 | 0 | |
| Estonian Christian People's Party | EKRP | 131 | 133 | 158 | 2 | 424 | 1.04% | 0 | 0 | 0 | 0 | |
| Estonian Social Democratic Labour Party | ESDTP | 116 | 97 | 174 | 0 | 387 | 0.94% | 0 | 0 | 0 | 0 | |
| Estonian Independence Party | EIP | 47 | 86 | 78 | 0 | 211 | 0.52% | 0 | 0 | 0 | 0 | |
| Russian Party in Estonia | VEE | 61 | 29 | 61 | 1 | 152 | 0.37% | 0 | 0 | 0 | 0 | |
| Enn Oja (Independent) | 21 | 17 | 21 | 0 | 59 | 0.14% | 0 | 0 | 0 | 0 | ||
| Valid Votes | 13,366 | 12,095 | 15,326 | 175 | 40,962 | 100.00% | 2 | 3 | 5 | 10 | ||
| Rejected Votes | 122 | 136 | 175 | 4 | 437 | 1.06% | ||||||
| Total Polled | 13,488 | 12,231 | 15,501 | 179 | 41,399 | 62.51% | ||||||
| Registered Electors | 20,469 | 18,912 | 26,665 | 179 | 66,225 | |||||||
| Turnout | 65.89% | 64.67% | 58.13% | 100.00% | 62.51% | |||||||
The following candidates were elected:[32]
- Personal mandates - Juhan Parts (ÜVE-RP), 6,890 votes; and Vilja Savisaar (K), 5,919 votes.
- District mandates - Elle Kull (ÜVE-RP), 2,217 votes; Rein Lang (RE), 4,283 votes; and Vladimir Velman (K), 2,143 votes.
- Compensatory mandates - Andres Herkel (I), 1,238 votes; Eiki Nestor (RM), 1,233 votes; Evelyn Sepp (K), 292 votes; Avo Üprus (ÜVE-RP), 372 votes; and Ken-Marti Vaher (ÜVE-RP), 1,379 votes.
1999
Results of the 1999 parliamentary election held on 7 March 1999:[33][34][35]
| Party | Votes per district | Total Votes | % | Seats | ||||||||
|---|---|---|---|---|---|---|---|---|---|---|---|---|
| Haaber -sti |
Kris -tiine |
Põhja- Tallinn |
Over -seas |
Per. | Dis. | Com. | Tot. | |||||
| Pro Patria Union | I | 2,839 | 2,768 | 2,929 | 242 | 8,778 | 22.69% | 1 | 0 | 1 | 2 | |
| Estonian Reform Party | RE | 2,393 | 2,365 | 2,215 | 30 | 7,003 | 18.10% | 0 | 1 | 1 | 2 | |
| Estonian Centre Party | K | 2,239 | 1,957 | 2,729 | 2 | 6,927 | 17.90% | 0 | 1 | 1 | 2 | |
| Moderate | M | 1,775 | 1,578 | 1,766 | 73 | 5,192 | 13.42% | 0 | 1 | 1 | 2 | |
| Russian Party in Estonia | VEE | 1,093 | 485 | 1,415 | 2 | 2,995 | 7.74% | 0 | 0 | 0 | 0 | |
| Estonian United People's Party | EÜRP | 996 | 450 | 1,142 | 1 | 2,589 | 6.69% | 0 | 0 | 2 | 2 | |
| Estonian Coalition Party | KE | 488 | 497 | 922 | 7 | 1,914 | 4.95% | 0 | 0 | 1 | 1 | |
| Estonian Christian People's Party | EKRP | 342 | 346 | 399 | 24 | 1,111 | 2.87% | 0 | 0 | 0 | 0 | |
| Estonian Blue Party | ESE | 170 | 235 | 257 | 9 | 671 | 1.73% | 0 | 0 | 0 | 0 | |
| Estonian Country People's Party | EME | 181 | 229 | 225 | 2 | 637 | 1.65% | 0 | 0 | 0 | 0 | |
| Dimitri Klenski (Independent) | 215 | 134 | 205 | 0 | 554 | 1.43% | 0 | 0 | 0 | 0 | ||
| Progress Party | 43 | 57 | 102 | 0 | 202 | 0.52% | 0 | 0 | 0 | 0 | ||
| Farmers' Assembly | 25 | 45 | 46 | 5 | 121 | 0.31% | 0 | 0 | 0 | 0 | ||
| Valid Votes | 12,799 | 11,146 | 14,352 | 397 | 38,694 | 100.00% | 1 | 3 | 7 | 11 | ||
| Rejected Votes | 172 | 152 | 269 | 3 | 596 | 1.52% | ||||||
| Total Polled | 12,971 | 11,298 | 14,621 | 400 | 39,290 | 59.28% | ||||||
| Registered Electors | 20,815 | 18,024 | 27,045 | 400 | 66,284 | |||||||
| Turnout | 62.32% | 62.68% | 54.06% | 100.00% | 59.28% | |||||||
The following candidates were elected:[35]
- Personal mandates - Jüri Mõis (I), 6,739 votes.
- District mandates - Arvo Haug (K), 2,234 votes; Valve Kirsipuu (RE), 3,556 votes; Eiki Nestor (M), 1,956 votes.
- Compensatory mandates - Ivi Eenmaa (KE), 580 votes; Vootele Hansen (M), 1,209 votes; Andres Herkel (I), 737 votes; Kalev Kallo (K), 523 votes; Tiit Toomsalu (EÜRP), 134 votes; Rein Voog (RE), 527 votes; and Valentina Võssotskaja (EÜRP), 64 votes.
1995
Results of the 1995 parliamentary election held on 5 March 1995:[36][37][38]
| Party | Votes per district | Total Votes | % | Seats | ||||||||
|---|---|---|---|---|---|---|---|---|---|---|---|---|
| Haaber -sti |
Kris -tiine |
Põhja- Tallinn |
Over -seas |
Per. | Dis. | Com. | Tot. | |||||
| Estonian Reform Party | RE | 3,782 | 3,354 | 3,577 | 145 | 10,858 | 25.54% | 1 | 0 | 0 | 1 | |
| Coalition Party and Rural People's Association | KMÜ | 2,915 | 2,789 | 3,572 | 59 | 9,335 | 21.96% | 1 | 0 | 3 | 4 | |
| Estonian Centre Party | K | 2,125 | 1,869 | 2,838 | 19 | 6,851 | 16.11% | 0 | 1 | 1 | 2 | |
| Our Home is Estonia | MKOE | 1,924 | 1,022 | 2,096 | 5 | 5,047 | 11.87% | 0 | 0 | 0 | 0 | |
| Pro Patria and ERSP Union | I\ERSP | 828 | 816 | 1,084 | 444 | 3,172 | 7.46% | 0 | 0 | 1 | 1 | |
| Moderate | M | 527 | 530 | 619 | 28 | 1,704 | 4.01% | 0 | 0 | 1 | 1 | |
| Better Estonia/Estonian Citizen | PE/EK | 414 | 422 | 546 | 7 | 1,389 | 3.27% | 0 | 0 | 0 | 0 | |
| The Right Wingers | P | 418 | 363 | 393 | 21 | 1,195 | 2.81% | 0 | 0 | 1 | 1 | |
| Estonian Future Party | TEE | 256 | 255 | 329 | 7 | 847 | 1.99% | 0 | 0 | 0 | 0 | |
| Justice | Õ | 252 | 200 | 388 | 1 | 841 | 1.98% | 0 | 0 | 0 | 0 | |
| Estonian National Federation | ERKL | 102 | 106 | 128 | 3 | 339 | 0.80% | 0 | 0 | 0 | 0 | |
| Fourth Force | NJ | 121 | 92 | 108 | 7 | 328 | 0.77% | 0 | 0 | 0 | 0 | |
| Estonian Farmers' Party | ETRE | 64 | 99 | 65 | 1 | 229 | 0.54% | 0 | 0 | 0 | 0 | |
| Blue Party | SE | 68 | 42 | 70 | 2 | 182 | 0.43% | 0 | 0 | 0 | 0 | |
| Lembit Annus (Independent) | 23 | 16 | 72 | 0 | 111 | 0.26% | 0 | 0 | 0 | 0 | ||
| Forest Party | 16 | 19 | 27 | 0 | 62 | 0.15% | 0 | 0 | 0 | 0 | ||
| Estonian Democratic Union | EDL | 6 | 6 | 12 | 0 | 24 | 0.06% | 0 | 0 | 0 | 0 | |
| Valid Votes | 13,841 | 12,000 | 15,924 | 749 | 42,514 | 100.00% | 2 | 1 | 7 | 10 | ||
| Rejected Votes | 105 | 87 | 144 | 0 | 336 | 0.78% | ||||||
| Total Polled | 13,946 | 12,087 | 16,068 | 749 | 42,850 | 72.64% | ||||||
| Registered Electors | 18,564 | 16,635 | 23,045 | 749 | 58,993 | |||||||
| Turnout | 75.12% | 72.66% | 69.72% | 100.00% | 72.64% | |||||||
The following candidates were elected:[38]
- Personal mandates - Siim Kallas (RE), 10,459 votes; and Andrus Öövel (KMÜ), 5,839 votes.
- District mandates - Arvo Haug (K), 2,561 votes.
- Compensatory mandates - Jüri Adams (I\ERSP), 1,626 votes; Karin Jaani (P), 670 votes; Krista Kilvet (K), 760 votes; Märt Kubo (KMÜ), 142 votes; Tõnu-Reid Kukk (KMÜ), 98 votes; Eiki Nestor (M), 1,250 votes; and Eino Tamm (KMÜ), 269 votes.
Notes
References
- ^ "Tallinna elanike arv" (in Estonian). Tallinn, Estonia: City of Tallinn. Retrieved 23 December 2020.
- ^ "Members of the Riigikogu". Tallinn, Estonia: Riigikogu. Retrieved 20 December 2020.
- ^ "Election for Estonian Parliament". Election Guide. Arlington, U.S.A.: International Foundation for Electoral Systems. Retrieved 19 January 2021.
- ^ "Electoral Assistance: ElecData, Compendium of Electoral Data - Estonia". Strasbourg, France: Council of Europe. Retrieved 19 January 2021.
- ^ a b c d e f g "Estonian elections in a nutshell: Ascertaining the results - Ascertaining the election results at Riigikogu elections". Tallinn, Estonia: National Electoral Committee of Estonia. Retrieved 23 December 2020.
- ^ "National Electoral Committee distributed mandates for Riigikogu elections". Tallinn, Estonia: National Electoral Committee of Estonia. 30 November 2022. Retrieved 16 March 2023.
- ^ "Mandaatide jaotamine XIV Riigikogu valimistel" (in Estonian). Tallinn, Estonia: Riigi Teataja. 5 December 2018. Retrieved 19 January 2021.
- ^ "Mandaatide jaotamine XIII Riigikogu valimistel" (in Estonian). Tallinn, Estonia: Riigi Teataja. 2 December 2014. Retrieved 19 January 2021.
- ^ "Mandaatide jaotamine XII Riigikogu valimistel" (in Estonian). Tallinn, Estonia: Riigi Teataja. 3 December 2010. Retrieved 19 January 2021.
- ^ "Riigikogu valimine 4 Märts 2007: Üldandmed - Valimisringkonnad ja mandaatide jaotus" (in Estonian). Tallinn, Estonia: National Electoral Committee of Estonia. Retrieved 19 January 2021.
- ^ "Riigikogu valimine 2 Märts 2003: Üldandmed - Valimisringkonnad ja mandaatide jaotus" (in Estonian). Tallinn, Estonia: National Electoral Committee of Estonia. Retrieved 19 January 2021.
- ^ "Riigikogu valimine 7 Märts 1999: Üldandmed - Valimisringkonnad ja mandaatide jaotus" (in Estonian). Tallinn, Estonia: National Electoral Committee of Estonia. Retrieved 19 January 2021.
- ^ Heinsalu, Alo; Koitmäe, Arne; Mandre, Leino; Pilving, Mihkel; Vinkel, Priit (2016). Eero, Gerli (ed.). Elections in Estonia: 1992-2015 (PDF). Tallinn, Estonia: National Electoral Committee of Estonia. p. 42. ISSN 2504-5555. Retrieved 19 January 2021.
- ^ "Riigikogu valimised 2023: Hääletamis- ja valimistulemus - Valimisringkond nr 1 (Tallinna Haabersti, Põhja-Tallinna ja Kristiine linnaosa)". Tallinn, Estonia: National Electoral Committee of Estonia. Retrieved 16 March 2023.
- ^ "Riigikogu valimised 2019: Detailne hääletamistulemus - Valimisringkond nr 1 (Tallinna Haabersti, Põhja-Tallinna ja Kristiine linnaosa)". Tallinn, Estonia: National Electoral Committee of Estonia. Retrieved 23 December 2020.
- ^ a b "Riigikogu valimised 2019: Valitud Riigikogu liikmed - Mandaatide omandamise viis" (in Estonian). Tallinn, Estonia: National Electoral Committee of Estonia. Retrieved 23 December 2020.
- ^ "Riigikogu valimised 2019: Hääletamis- ja valimistulemus - Valimisringkond nr 1 (Tallinna Haabersti, Põhja-Tallinna ja Kristiine linnaosa)" (in Estonian). Tallinn, Estonia: National Electoral Committee of Estonia. Retrieved 23 December 2020.
- ^ "Riigikogu valimised 2019: Detailne hääletamistulemus - Valimisringkond nr 1 (Tallinna Haabersti, Põhja-Tallinna ja Kristiine linnaosa)" (in Estonian). Tallinn, Estonia: National Electoral Committee of Estonia. Retrieved 23 December 2020.
- ^ a b "Riigikogu valimised 2019: Valitud Riigikogu liikmed - Mandaatide omandamise viis" (in Estonian). Tallinn, Estonia: National Electoral Committee of Estonia. Retrieved 23 December 2020.
- ^ "Loe, miks ei lähe riigikokku Vadim Belobrovtsev, Vladimir Svet ja Lauri Laats". Delfi (in Estonian). 3 April 2019. Retrieved 13 March 2021.
- ^ "Riigikogu valimised 2015: Hääletamis- ja valimistulemus hetkeseisuga - Valimisringkond 1 (Tallinna Haabersti, Põhja-Tallinna ja Kristiine linnaosa)" (in Estonian). Tallinn, Estonia: National Electoral Committee of Estonia. Retrieved 24 December 2020.
- ^ "Riigikogu valimised 2015: Detailne hääletamistulemus - Valimisringkond nr 1 (Tallinna Haabersti, Põhja-Tallinna ja Kristiine linnaosa)" (in Estonian). Tallinn, Estonia: National Electoral Committee of Estonia. Retrieved 24 December 2020.
- ^ a b "Riigikogu valimised 2015: Valitud Riigikogu liikmed - Mandaatide omandamise viis" (in Estonian). Tallinn, Estonia: National Electoral Committee of Estonia. Retrieved 24 December 2020.
- ^ "Riigikogu valimised 2011: Valimistulemus - Hääletamistulemus - Valimisringkond 1 (Haabersti , Kristiine, Põhja-Tallinn)" (in Estonian). Tallinn, Estonia: National Electoral Committee of Estonia. Retrieved 24 December 2020.
- ^ "Riigikogu valimised 2011: Hääletamistulemus - Valimisringkond 1 (Haabersti , Kristiine, Põhja-Tallinn)" (in Estonian). Tallinn, Estonia: National Electoral Committee of Estonia. Retrieved 24 December 2020.
- ^ a b "Riigikogu valimised 2011: Valitud Riigikogu liikmed - Mandaatide omandamise viis" (in Estonian). Tallinn, Estonia: National Electoral Committee of Estonia. Retrieved 24 December 2020.
- ^ "Riigikogu valimine 4 Märts 2007: Häälte ja mandaatide jaotus - Valimisringkond nr 1" (in Estonian). Tallinn, Estonia: National Electoral Committee of Estonia. Retrieved 24 December 2020.
- ^ "Riigikogu valimine 4 Märts 2007: Valimistulemus - Hääletamistulemus - Valimisringkond nr 1" (in Estonian). Tallinn, Estonia: National Electoral Committee of Estonia. Retrieved 24 December 2020.
- ^ a b "Riigikogu valimine 4 Märts 2007: Valimistulemus - Mandaatide omandamise viis" (in Estonian). Tallinn, Estonia: National Electoral Committee of Estonia. Retrieved 24 December 2020.
- ^ "Riigikogu valimine 2 Märts 2003: Häälte ja mandaatide jaotus - Valimisringkond nr 1" (in Estonian). Tallinn, Estonia: National Electoral Committee of Estonia. Retrieved 24 December 2020.
- ^ "Riigikogu valimine 2 Märts 2003: Valimistulemus - Hääletamistulemus - Valimisringkond nr 1" (in Estonian). Tallinn, Estonia: National Electoral Committee of Estonia. Retrieved 24 December 2020.
- ^ a b "Riigikogu valimine 2 Märts 2003: Valimistulemus - Mandaatide omandamise viis" (in Estonian). Tallinn, Estonia: National Electoral Committee of Estonia. Retrieved 24 December 2020.
- ^ "Riigikogu valimine 7 Märts 1999: Valimispäev - Tallinn 1" (in Estonian). Tallinn, Estonia: National Electoral Committee of Estonia. Retrieved 24 December 2020.
- ^ "Riigikogu valimine 7 Märts 1999: Hääletamistulemus - Valimisringkond nr 1" (in Estonian). Tallinn, Estonia: National Electoral Committee of Estonia. Retrieved 24 December 2020.
- ^ a b "Riigikogu valimine 7 Märts 1999: Valimistulemus - Mandaatide omandamise viis" (in Estonian). Tallinn, Estonia: National Electoral Committee of Estonia. Retrieved 24 December 2020.
- ^ "Riigikogu valimine 5 Märts 1995: Valimispäev - Tallinn 1" (in Estonian). Tallinn, Estonia: National Electoral Committee of Estonia. Retrieved 24 December 2020.
- ^ "Riigikogu valimine 5 Märts 1995: Hääletamistulemus - Valimisringkond nr 1" (in Estonian). Tallinn, Estonia: National Electoral Committee of Estonia. Retrieved 24 December 2020.
- ^ a b "Riigikogu valimine 5 Märts 1995: Valimistulemus - Mandaatide omandamise viis" (in Estonian). Tallinn, Estonia: National Electoral Committee of Estonia. Retrieved 24 December 2020.