
First-order hold (FOH) is a mathematical model of the practical reconstruction of sampled signals that could be done by a conventional digital-to-analog converter (DAC) and an analog circuit called an integrator. For FOH, the signal is reconstructed as a piecewise linear approximation to the original signal that was sampled. A mathematical model such as FOH (or, more commonly, the zero-order hold) is necessary because, in the sampling and reconstruction theorem, a sequence of Dirac impulses, xs(t), representing the discrete samples, x(nT), is low-pass filtered to recover the original signal that was sampled, x(t). However, outputting a sequence of Dirac impulses is impractical. Devices can be implemented, using a conventional DAC and some linear analog circuitry, to reconstruct the piecewise linear output for either predictive or delayed FOH.
Even though this is not what is physically done, an identical output can be generated by applying the hypothetical sequence of Dirac impulses, xs(t), to a linear time-invariant system, otherwise known as a linear filter with such characteristics (which, for an LTI system, are fully described by the impulse response) so that each input impulse results in the correct piecewise linear function in the output.
YouTube Encyclopedic
-
1/4Views:17 60516 7441 2824 910
-
Lecture 17, Interpolation | MIT RES.6.007 Signals and Systems, Spring 2011
-
Lecture 19, Discrete-Time Sampling | MIT RES.6.007 Signals and Systems, Spring 2011
-
Signal Reconstruction Tutorial
-
ENGR487 Lecture5 Closed-Loop Pulse Transfer Function and Discrete Euqivalent
Transcription
The following content is provided under a Creative Commons license. Your support will help MIT OpenCourseWare continue to offer high quality educational resources for free. To make a donation or view additional materials from hundreds of MIT courses, visit MIT OpenCourseWare at ocw.mit.edu. [MUSIC PLAYING] PROFESSOR: In discussing the sampling theorem, we saw that for a band limited signal, which is sampled at a frequency that is at least twice the highest frequency, we can implement exact reconstruction of the original signal by low pass filtering an impulse train, whose areas are identical to the sample values. Well essentially, this low pass filtering operation provides for us an interpolation in between the sampled values. In other words, the output of a low pass filter, in fact, is a continuous curve, which fits between the sampled values some continuous function. Now, I'm sure that many of you are familiar with other kinds of interpolation that we could potentially provide in between sampled values. And in fact, in today's lecture what I would like to do is first of all developed the interpretation of the reconstruction as an interpolation process and then also see how this exact interpolation, using a low pass filter, relates to other kinds of interpolation, such as linear interpolation that you may already be familiar with. Well to begin, let's again review what the overall system is for exact sampling and reconstruction. And so let me remind you that the overall system for sampling and desampling, or reconstruction, is as I indicate here. The sampling process consists of multiplying by an impulse train. And then the reconstruction process corresponds to processing that impulse train with a low pass filter. So if the spectrum of the original signal is what I indicate in this diagram, then after sampling with an impulse train, that spectrum is replicated. And this replicated spectrum for reconstruction is then processed through a low pass filter. And so, in fact, if this frequency response is an ideal low pass filter, as I indicate on the diagram below, then multiplying the spectrum of the sample signal by this extracts for us just the portion of the spectrum centered around the origin. And what we're left with, then, is the spectrum, finally, of the reconstructed signal, which for the case of an ideal low pass filter is exactly equal to the spectrum of the original signal. Now, that is the frequency domain picture of the sampling and reconstruction. Let's also look at, basically, the same process. But let's examine it now in the time domain. Well in the time domain, what we have is our original signal multiplied by an impulse train. And this then is the sample signal, or the impulse train whose areas are equal to the sample values. And because of the fact that this is an impulse train, in fact, we can take this term inside the summation. And of course, what counts about x of t in this expression is just as values at the sampling instance, which are displaced in time by capital T. And so what we can equivalently write is the expression for the impulse train samples, or impulse train of samples, as I've indicated here. Simply an impulse train, whose areas are the sampled values. Now, in the reconstruction we process that impulse train with a low pass filter. That's the basic notion of the reconstruction. And so in the time domain, the reconstructed signal is related to the impulse train of samples through a convolution with the filter impulse response. And carrying out this convolution, since this is just a train of pulses, in effect, what happens in this convolution is that this impulse response gets reproduced at each of the locations of the impulses in x of p of t with the appropriate area. And finally, then, in the time domain, the reconstructed signal is simply a linear combination of shifted versions of the impulse response with amplitudes, which are the sample values. And so this expression, in fact then, is our basic reconstruction expression in the time domain. Well in terms of a diagram, we can think of the original waveform as I've shown here. And the red arrows denote the sampled wave form, or the train of impulses, whose amplitudes are the sampled values of the original continuous time signal. And then, I've shown here what might be a typical impulse response, particularly typical in the case where we're talking about reconstruction with an ideal low pass filter. Now, what happens in the reconstruction is that the convolution of these impulses with this impulse response means that in the reconstruction, we superimpose one of these impulse responses-- whatever the filter impulse response happens to be-- at each of these time instance. And in doing that, then those are added up. And that gives us the total reconstructed signal. Of course, for the case in which the filter is an ideal low pass filter, then what we know is that in that case, the impulse response is of the form of a sync function. But generally, we may want to consider other kinds of impulse responses. And so in fact, the interpolating impulse response may have and will have, as this discussion goes along, some different shapes. Now what I'd like to do is illustrate, or demonstrate, this process of effectively doing the interpolation by replacing each of the impulses by an appropriate interpolating impulse response and adding these up. And I'd like to do this with a computer movie that we generated. And what you'll see in the computer movie is, essentially, an original wave form, which is a continuous curve. And then below that in the movie is a train of samples. And then below that will be the reconstructed signal. And the reconstruction will be carried out by showing the location of the impulse response as it moves along in the wave form. And then the reconstructed curve is simply the summation of those as that impulse response moves along. So what you'll see then is an impulse response like this-- for the particular case of an ideal low pass filter for the reconstruction-- placed successively at the locations of these impulses. And that is the convolution process. And below that then will be the summation of these. And the summation of those will then be the reconstructed signal. So let's take a look at, first of all that reconstruction where the impulse response corresponds to the impulse response of an ideal low pass filter. Shown here, first, is the continuous time signal, which we want to sample and then reconstruct using band limited interpolation, or equivalently, ideal low pass filtering on the set of samples. So the first step then is to sample this continuous time signal. And we see here now the set of samples. And superimposed on the samples are the original continuous time signal to focus on the fact that those are samples of the top curve. Let's now remove the continuous time envelope of the samples. And it's this set of samples that we then want to use for the reconstruction. The reconstruction process, interpreted as interpolation, consists of replacing each sample with a sine x over x function. And so let's first consider the sample at t equals 0. And here is the interpolating sine x over x function associated with that sample. Now, the more general process then is to place a sine x over x function at the time location of each sample and superimpose those. Let's begin that process at the left-hand set of samples. And in the bottom curve, we'll build up the reconstruction as those sine x over x functions are added together. So we begin with the left-hand sample. And we see there the sine x over x function on the bottom curve is the first step in the reconstruction. We now have the sine x over x function associated with the second sample. Let's add that in. Now we move on to the third sample. And that sine x over x function is added in. Continuing on, the next sample generates a sine x over x function, which is superimposed on the result that we've accumulated so far. And now let's just speed up the process. We'll move on to the fifth sample. Add that in. The sixth sample, add that in. And continue on through the set of samples. And keep in mind the fact that, basically, what we're doing explicitly here is the convolution of the impulse train with a sine x over x function. And because the set of samples that we started with were samples of an exactly band limited function, what we are reconstructing exactly is the original continuous time signal that we have on the top trace. OK, so that then kind of gives you the picture of doing interpolation by replacing the impulses by a continuous curve. And that's the way we're fitting a continuous curve to the original impulse train. And let me stress that this reconstruction process-- by putting the impulses through a filter-- follows this relationship whether or not this impulse response, in fact, corresponds to an ideal low pass filter. What this expression always says is that reconstructing this way corresponds to replacing the impulses by a shifted impulse response with an amplitude that is an amplitude corresponding to the sample value. Now the kind of reconstruction that we've just talked about, and the ideal reconstruction, is often referred to as band limited interpolation because we're interpolating in between the samples by making the assumption that the signal is band limited and using the impulse response for an ideal low pass filter, which has a cut off frequency consistent with the assumed bandwidth for the signal. So if we look here, for example, at the impulse train, then in the demonstration that you just saw, we built up the reconstructed curve by replacing each of these impulses with the sync function. And the sum of those built up the reconstructed curve. Well, there are lots of other kinds of interpolation that are perhaps maybe not as exact but often easier to implement. And what I'd like to do is focus our attention on two of these. The first that I want to mention is what's referred to as the zero order hold, where in effect, we do the interpolation in between these sample values by simply holding the sample value until the next sampling instant. And the reconstruction that we end up, in that case, will look something like this. It's a staircase, or box car, kind of function where we've simply held the sample value until the next sampling instant and then replaced by that value, held it until the next sampling instant, et cetera. Now that's one kind of interpolation. Another kind of very common interpolation is what's referred to as linear interpolation, where we simply fit a straight line between the sampled values. And in that case, the type of reconstruction that we would get would look something like I indicate here, where we take a sample value, and the following sample value, and simply fit an interpolated curve between them, which is a straight line. Now interestingly, in fact, both the zero order hold and the linear interpolation, which is often referred to as a first order hold, can also be either implemented or interpreted, both implemented and interpreted, in the context of the equation that we just developed. In particular, the processing of the impulse train of samples by a linear time invariant filter. Specifically, if we consider a system where the impulse response is a rectangular function, then in fact, if we processed the train of samples through a filter with this impulse response, exactly the reconstruction that we would get is what I've shown here. Alternatively, if we chose an impulse response which was a triangular impulse response, then what in effect happens is that each of these impulses activates this triangle. And when we add up those triangles at successive locations, in fact, what we generate is this linear interpolation. So what this says, in fact, is that either a zero order hold, which holds the value, or linear interpolation can likewise be interpreted as a process of convulving the impulse train of samples with an appropriate filter impulse response. Well, what I'd like to do is demonstrate, as we did with the band limited interpolation or the sync interpolation as it's sometimes called-- interpolating with a sine x over x-- let me now show the process. First of all, where we have a zero order hold as corresponding to this impulse response. In which case, we'll see basically the same process as we saw in the computer generated movie previously. But now, rather than a sync function replacing each of these impulses, we'll have a rectangular function. That will generate then our approximation, which is a zero order hold. And following that, we'll do exactly the same thing with the same wave form, using a first order hold or a triangular impulse response. In which case, what we'll see again is that as the triangle moves along here, and we build up the running sum or the convolution, then we'll, in fact, fit the original curve with a linear curve. So now let's again look at that, remembering that at the top we'll see the original continuous curve, exactly the one that we had before. Below it, the set of samples together with the impulse response moving along. And then finally below that, the accumulation of those impulse responses, or equivalently the convolution, or equivalently the reconstruction. So we have the same continuous time signal that we use previously with band limited interpolation. And in this case now, we want to sample and then interpolate first with a zero order hold and then with a first order hold. So the first step then is to sample the continuous time signal. And we show here the set of samples, once again, superimposed on which we have the continuous time signal, which of course is exactly the same curve as we have in the top. Well, let's remove that envelope so that we focus attention on the samples that we're using to interpolate. And the interpolation process consists of replacing each sample by a rectangular signal, whose amplitude is equal to the sample size. So let's put one, first of all, at t equals 0 associated with that sample. And that then would be the interpolating rectangle associated with the sample at t equals 0. Now to build up the interpolation, what we'll have is one of those at each sample time, and those are added together. We'll start that process, as we did before, at the left-hand end of the set of samples and build the interpolating signal on the bottom. So with the left-hand sample, we have first the rectangle associated with that. That's shown now on the bottom curve. We now have an interpolating rectangle with a second sample that gets added into the bottom curve. Similarly, an interpolating rectangle with the zero order hold with the third sample. We add that into the bottom curve. And as we proceed, we're building a staircase approximation. On to the next sample, that gets added in as we see there. And now let's speed up the process. And we'll see the staircase approximation building up. And notice in this case, as in the previous case, that what we're basically watching dynamically is the convolution of the impulse train of samples with the impulse response of the interpolating filter, which in this particular case is just a rectangular pulse. And so this staircase approximation that we're generating is the zero order hold interpolation between the samples of the band limited signal, which is at the top. Now let's do the same thing with a first order hold. So in this case, we want to interpolate using a triangular impulse response rather then the sine x over x, or rectangular impulse responses that we showed previously. So first, let's say with the sample at t equals 0, we would replace that with a triangular interpolating function. And more generally, each impulse or sample is replaced with a triangular interpolating function of a height equal to the sample type. And these are superimposed to generate the linear interpolation. We'll begin this process with the leftmost sample. And we'll build the superposition below in the bottom curve. So here is the interpolating triangle for the leftmost sample. And now it's reproduced below. With the second sample, we have an interpolating triangle, which is added into the bottom curve. And now on to the third sample. And again, that interpolating triangle will be added on to the curve that we've developed so far. And now onto the next sample. We add that in. Then we'll speed up the process. And as we proceed through, we are building, basically, a linear interpolation in between the sample points, essentially corresponding to-- if one wants to think of it this way-- connecting the dots. And what you're watching, once again, is essentially the convolution process convulving the impulse train with the impulse response of the interpolating filter. And what we're generating, then, is a linear approximation to the band limited continuous time curve at the top. OK, so what we have then is several other kinds of interpolation, which fit within the same context as exact band limited interpolation. One being interpolation in the time domain with an impulse response, which is a rectangle. The second being interpolation in the time domain with an impulse response, which is a triangle. And in fact, it's interesting to also look at the relationship between that and band limited interpolation. Look at it, specifically, in the frequency domain. Well, in the frequency domain, what we know, of course, is that for exact interpolation, what we want as our interpolating filter is an ideal low pass filter. Now keep in mind, by the way, that an ideal low pass filter is an abstraction, as I've stressed several times in the past. An ideal low pass filter is a non-causal filter and, in fact, infinite extent, which is one of the reasons why in any case we would use some approximation to it. But here, what we have is the exact interpolating filter. And that corresponds to an ideal low pass filter. If, instead, we carried out the interpolating using the zero order hold, the zero order hold has a rectangular impulse response. And that means in the frequency domain, its frequency response is of the form of a sync function, or sine x over x. And so this, in fact, when we're doing the reconstruction with a zero order hold, is the associated frequency response. Now notice that it does some approximate low pass filtering. But of course, it permits significant energy outside the past band of the filter. Well, instead of the zero order hold, if we used the first order hold corresponding to the triangular impulse response, in that case then in the frequency domain, the associated frequency response would be the Fourier transform of the triangle. And the Fourier transform of a triangle is a sine squared x over x squared kind of function. And so in that case, what we would have for the frequency response, associated with the first order hold, is a frequency response as I show here. And the fact that there's somewhat more attenuation outside the past band of the ideal filter is what suggests, in fact, that the first order hold, or linear interpolation, gives us a somewhat smoother approximation to the original signal than the zero order hold does. And so, in fact, just to compare these two, we can see that here is the ideal filter. Here is the zero order hold, corresponding to generating a box car kind of reconstruction. And here is the first order hold, corresponding to a linear interpolation. Now in fact, in many sampling systems, in any sampling system really, we need to use some approximation to the low pass filter. And very often, in fact, what is done in many sampling systems, is to first use just the zero order hold, and then follow the zero order hold with some additional low pass filtering. Well, to illustrate some of these ideas and the notion of doing a reconstruction with a zero order hold or first order hold and then in fact adding to that some additional low pass filtering, what I'd like to do is demonstrate, or illustrate, sampling and interpolation in the context of some images. An image, of course, is a two-dimensional signal. The independent variables are spatial variables not time variables. And of course, we can sample in both of the spatial dimensions, both in x and y. And what I've chosen as a possibly appropriate choice for an image is, again, our friend and colleague J.B.J. Fourier. So let's begin with the original image, which we then want to sample and reconstruct. And the sampling is done by effectively multiplying by a pulse both horizontally and vertically. The sample picture is then the next one that I show. And as you can see, this corresponds, in effect, to extracting small brightness elements out of the original image. In fact, let's look in a little closer. And what you can see, essentially, is that what we have, of course, are not impulses spatially but small spatial pillars that implement the sampling for us. OK, now going back to the original sample picture, we know that a picture can be reconstructed by low pass filtering from the samples. And in fact, we can do that optically in this case by simply defocusing the camera. And when we do that, what happens is that we smear out the picture, or effectively convulve the impulses with the point spread function of the optical system. And this then is not too bad a reconstruction. So that's an approximate reconstruction. And focusing back now what we have again is the sample picture. Now these images are, in fact, taken off a computer display. And a common procedure in computer generated or displayed images is in fact the use of a zero order hold. And if the sampling rate is high enough, then that actually works reasonably well. So now let's look at the result of applying a zero order hold to the sample image that I just showed. The zero order hold corresponds to replacing the impulses by rectangles. And you can see that what that generates is a mosaic effect, as you would expect. And in fact, let's go in a little closer and emphasize the mosaic effect. You can see that, essentially, where there were impulses previously, there are now rectangles with those brightness values. A very common procedure with computer generated images is to first do a zero order hold, as we've done here, and then follow that with some additional low pass filtering. And fact, we can do that low pass filtering now again by defocusing the camera. And you can begin to see that with the zero order hold plus the low pass filtering, the reconstruction is not that bad. Well, let's go back to the full image with the zero order hold. And again, now the effect of low pass filtering will be somewhat better. And let's defocus again here. And you can begin to see that this is a reasonable reconstruction. With the mosaic, in fact, with this back in focus, you can apply your own low pass filtering to it either by squinting, or if you have the right or wrong kind of eyeglasses, either taking them off or putting them on. Now, in addition to the zero order hold, we can, of course, apply a first order hold. And that would correspond to replacing the impulses, instead of with rectangles as we have here, replacing them with triangles. And so now let's take a look at the result of a first order hold applied to the original samples. And you can see now that the reconstruction is somewhat smoother because of the fact that we're using an impulse response that's somewhat smoother or a corresponding frequency response that has a sharper cut off. I emphasize again that this is a somewhat low pass filtered version of the original because we have under sampled somewhat spatially to bring out the point that I want to illustrate. OK, to emphasize these effects even more, what I'd like to do is go through, basically, the same sequence again. But in this case, what we'll do is double the sample spacing both horizontal and vertically. This of course, means that we'll be even more highly under sampled than in the ones I previously showed. And so the result of the reconstructions with some low pass filtering will be a much more low pass filtered image. So we now have the sampled picture. But I've now under sampled considerably more. And you can see the effect of the sampling. And if we now apply a zero order hold to this picture, we will again get a mosaic. And let's look at that. And that mosaic, of course, looks even blockier than the original. And again, it emphasizes the fact that the zero order hold simply corresponds to filling in squares, or replacing the impulses, by squares, with the corresponding brightness values. Finally, if we, instead of a zero order hold, use a first order hold, corresponding to two dimensional triangles in place of these original blocks. What we get is the next image. And that, again, is a smoother reconstruction consistent with the fact that the triangles are smoother than the rectangles. Again, I emphasize that this looks so highly low pass filtered because of the fact that we've under sampled so severely to essentially emphasize the effect. As I mentioned, the images that we just looked at were taken from a computer, although of course the original images were continuous time images or more specifically, continuous space. That is the independent variable is a spatial variable. Now, computer processing of signals, pictures, speech, or whatever the signals are is very important and useful because it offers a lot of flexibility. And in fact, the kinds of things that I showed with these pictures would have been very hard to do without, in fact, doing computer processing. Well, in computer processing of any kind of signal, basically what's required is that we do the processing in the context of discrete time signals and discrete time processing because of the fact that a computer is run off a clock. And essentially, things happen in the computer as a sequence of numbers and as a sequence of events. Well, it turns out that the sampling theorem, in fact, as I've indicated previously, provides us with a very nice mechanism for converting our continuous time signals into discrete time signals. For example, for computer processing or, in fact, if it's not a computer for some other kind of discrete time or perhaps digital processing. Well, the basic idea, as I've indicated previously, is to carry out discrete time processing of continuous time signals by first converting the continuous time signal to a discrete time signal, carry out the appropriate discrete time processing of the discrete time signal, and then after we're done with that processing, converting from the discrete time sequence back to a continuous time signal, corresponding to the output that we have here. Well in the remainder of this lecture, what I'd like to analyze is the first step in that process, namely the conversion from a continuous time signal to a discrete time signal and understand how the two relate both in the time domain and in the frequency domain. And in the next lecture, we'll be analyzing and demonstrating the overall system, including some intermediate processing. So the first step in the process is the conversion from a continuous time signal to a discrete time signal. And that can be thought of as a process that involves two steps, although in practical terms it may not be implemented specifically as these two steps. The two steps are to first convert from the continuous time, or continuous time continuous signal, to an impulse train through a sampling process and then to convert that impulse train to a discrete time sequence. And the discrete time sequence x of n is simply then a sequence of values which are the samples of the continuous time signal. And as we'll see as we walk through this, basically the step of going from the impulse train to the sequence corresponds principally to a relabeling step where we pick off the impulse values and use those as the sequence values for the discrete time signal. So what I'd like to do as a first step in understanding this process is to analyze it in particular with our attention focused on trying to understand what the relationship is in the frequency domain between the discrete time Fourier transform of the sequence, discrete time signal, and the continuous time Fourier transform of the original unsampled, and then the sampled signal. So let's go through that. And in particular, what we have is a process where the continuous time signal is, of course, modulated or multiplied by an impulse train. And that gives us, then, another continuous time signal. We're still in the continuous time domain. It gives us another continuous time signal, which is an impulse train. And in fact, we've gone through this analysis previously. And what we have is this multiplication or taking this term inside the summation and recognizing that the impulse train is simply an impulse train with areas of the impulses, which are the samples of the continuous time function. We can then carry out the analysis in the frequency domain. Now in the time domain, we have a multiplication process. So in the frequency domain, we have a convolution of the Fourier transform of the continuous time signal, the original signal, and the Fourier transform of the impulse train, which is itself an impulse train. So in the frequency domain then, the Fourier transform of the sampled signal, which is an impulse train, is the convolution of the Fourier transform of the sampling function P of t and the Fourier transform of the sampled signal. Since the sampling signal is a periodic impulse train, its Fourier transform is an impulse train. And consequently, carrying out this convolution in effect says that this Fourier transform simply gets replicated at each of the locations of these impulses. And finally, what we end up with then is a Fourier transform after the sampling process, which is the original Fourier transform of the continuous signal but added to itself shifted by integer multiples of the sampling frequency. And so this is the basic equation then that tells us in the frequency domain what happens through the first part of this two step process. Now I emphasize that it's a two step process. The first process is sampling, where we're still essentially in the continuous time world. The next step is essentially a relabeling process, where we convert that impulse train simply to a sequence. So let's look at the next step. The next step is to take the impulse train and convert it through a process to a sequence. And the sequence values are simply then samples of the original continuous signal. And so now we can analyze this. And what we want to relate is the discrete time Fourier transform of this and the continuous time Fourier transform of this, or in fact, the continuous time Fourier transform of x of C of T. OK, we have the impulse train. And it's Fourier transform we can get by simply evaluating the Fourier transform. And since the Fourier transform of this-- since this corresponds to an impulse train-- the Fourier transform, by the time we change some sums and integrals, will then have this impulse replaced by the Fourier transform of the shifted impulse, which is this exponential factor. So this expression is the Fourier transform of the impulse train, the continuous time Fourier transform. And alternatively, we can look at the Fourier transform of the sequence. And this, of course, is a discrete time Fourier transform. So we have the continuous time Fourier transform of the impulse train, we have the discrete Fourier transform of the sequence. And now we want to look at how those two relate. Well, it pretty much falls out of just comparing these two summations. In particular, this term and this term are identical. That's just a relabeling of what the sequence values are. And notice that when we compare these exponential factors, they're identical as long as we associate capital omega with little omega times capital T. In other words, if we were to replace here capital omega by little omega times capital T, and replace x of n by x of c of nt, then this expression would be identical to this expression. So in fact, these two are equal with a relabeling, or with a transformation, between small omega and capital omega. And so in fact, the relationship that we have is that the discrete time Fourier transform of the sequence of samples is equal to the continuous time Fourier transform of the impulse train of samples where we associate the continuous time frequency variable and the discrete time frequency variable through a frequency scaling as I indicate here. Or said another way, the discrete time spectrum is the continuous time spectrum of the samples with small omega replaced by capital omega divided by capital T. All right. So we have then this two step process. The first step is taking the continuous time signal, sampling it with an impulse train. In the frequency domain, that corresponds to replicating the Fourier transform of the original continuous time signal. The second step is relabeling that, in effect turning it into a sequence. And what that does in the frequency domain is provide us with a rescaling of the frequency axis, or as we'll see a frequency normalization, which is associated with the corresponding time normalization in the time domain. Well, let's look at those statements a little more specifically. What I show here is the original continuous time signal. And then below it is the sampled signal. And these two are signals in the continuous time domain. Now, what is the conversion from this impulse train to a sequence? Well, it's simply taking these impulse areas, or these sample values, and relabeling them, in effect as I show below, as sequence values. And essentially, I'm now replacing the impulse by the designation of a sequence value. That's one step. But the other important step to focus on is that whereas in the impulse train, these impulses are spaced by integer multiples of the sampling period capital T. In the sequence, of course, because of the way that we label sequences, these are always spaced by simply integer multiples of one. So in effect, you could say that the step in going from here to here corresponds to normalizing out in the time domain the sampling period capital T. To stress that another way, if the sampling period were doubled so that in this picture, the spacing stretched out by a factor of two. Nevertheless, for the discrete time signal, the spacing would remain as one. And essentially, it's the envelope of those sequence values that would then get compressed in time. So you can think of the step in going from the impulse train to the samples as, essentially, a time normalization. Now let's look at this in the frequency domain. In the frequency domain, what we have is the Fourier transform of our original continuous signal. After sampling with an impulse train, this spectrum retains its shape but is replicated at integer multiples of the sampling frequency 2 pi over capital T, as I indicate here. Now, we know that a discrete time spectrum must be periodic in frequency with a period of 2 pi. Here, we have the periodicity. But it's not periodic with a period of 2 pi. It's periodic with a period, which is equal to the sampling frequency. However, in converting from the samples to the sequence values, we go through another step. What's the other step? The other step is a time normalization, where we take the impulses, which are spaced by the sampling period. And we rescale that, essentially in the time domain, to a spacing which is unity. So we're dividing out in the time domain by a factor, which is equal to the sampling period. Well, dividing out in the time domain by capital T would correspond to multiplying in the frequency domain the frequency axis by capital T. And indeed, what happens is that in going from the impulse train to the sequence values, we now rescale this axis so that, in fact, the axis gets stretched by capital T. And the frequency, which corresponded to 2 pi over capital T, now gets renormalized to 2 pi. So just looking at this again, and perhaps with the overall picture, in the time domain, we've gone from a continuous curve to samples, relabeled those, and in effect implemented a time normalization. Corresponding in the frequency domain, we have replicated the spectrum through the initial sampling process and then rescaled the frequency axis so that, in fact, now this periodicity corresponds to a periodicity here, which is 2 pi, and here, which is the sampling frequency. So very often, in fact-- and we'll be doing this next time-- when you think of continuous time signals, which have been converted to discrete time signals, when you look at the discrete time frequency axis, the frequency 2 pi is associated with the sampling frequency as it was applied to the original continuous time signal. Now as I indicated, what we'll want to go on to from here is an understanding of what happens when we take a continuous time signal, convert it to a discrete time signal as I've just gone through, do some discrete time processing with a linear time invariant system, and then carry that back into the continuous time world. That is a procedure that we'll go through, and analyze, and in fact, illustrate in some detail next time. In preparation for that, what I would be eager to encourage you to do using the study guide and in reviewing this lecture, is to begin the next lecture with a careful and thorough understanding of the arguments that I've just gone through. In particular, understanding the process that's involved in going from a continuous time signal through sampling to a discrete time signal. And what that means in the frequency domain in terms of taking the original spectrum, replicating it because of the sampling process, and then rescaling that so that the periodicity gets rescaled so that it's periodic with a period of 2 pi. So we'll continue with that next time, focusing now on the subsequent steps in the processing. Thank you.
Basic first-order hold

First-order hold is the hypothetical filter or LTI system that converts the ideally sampled signal


to the piecewise linear signal

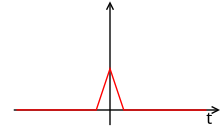
resulting in an effective impulse response of

- where is the triangular function.

The effective frequency response is the continuous Fourier transform of the impulse response.


- where is the normalized sinc function.

The Laplace transform transfer function of FOH is found by substituting s = i 2 π f:


This is an acausal system in that the linear interpolation function moves toward the value of the next sample before such sample is applied to the hypothetical FOH filter.
Delayed first-order hold

Delayed first-order hold, sometimes called causal first-order hold, is identical to FOH above except that its output is delayed by one sample period resulting in a delayed piecewise linear output signal


resulting in an effective impulse response of

- where is the triangular function.
The effective frequency response is the continuous Fourier transform of the impulse response.


- where is the sinc function.

The Laplace transform transfer function of the delayed FOH is found by substituting s = i 2 π f:

The delayed output makes this a causal system. The impulse response of the delayed FOH does not respond before the input impulse.
This kind of delayed piecewise linear reconstruction is physically realizable by implementing a digital filter of gain H(z) = 1 − z−1, applying the output of that digital filter (which is simply x[n]−x[n−1]) to an ideal conventional digital-to-analog converter (that has an inherent zero-order hold as its model) and integrating (in continuous-time, H(s) = 1/(sT)) the DAC output.
Predictive first-order hold

Lastly, the predictive first-order hold is quite different. This is a causal hypothetical LTI system or filter that converts the ideally sampled signal
into a piecewise linear output such that the current sample and immediately previous sample are used to linearly extrapolate up to the next sampling instance. The output of such a filter would be


resulting in an effective impulse response of


- where is the rectangular function and is the triangular function.

The effective frequency response is the continuous Fourier transform of the impulse response.


- where is the sinc function.
The Laplace transform transfer function of the predictive FOH is found by substituting s = i 2 π f:

This a causal system. The impulse response of the predictive FOH does not respond before the input impulse.
This kind of piecewise linear reconstruction is physically realizable by implementing a digital filter of gain H(z) = 1 − z−1, applying the output of that digital filter (which is simply x[n]−x[n−1]) to an ideal conventional digital-to-analog converter (that has an inherent zero-order hold as its model) and applying that DAC output to an analog filter with transfer function H(s) = (1+sT)/(sT).
See also
External links
- Sankar, Krishna (2007). "Zero order hold and first order hold based interpolation". dspLog Signal Processing for Communication.