To install click the Add extension button. That's it.

The source code for the WIKI 2 extension is being checked by specialists of the Mozilla Foundation, Google, and Apple. You could also do it yourself at any point in time.

4,5
Kelly Slayton
Congratulations on this excellent venture… what a great idea!
Alexander Grigorievskiy
I use WIKI 2 every day and almost forgot how the original Wikipedia looks like.
Live Statistics
English Articles
Improved in 24 Hours
Added in 24 Hours
What we do. Every page goes through several hundred of perfecting techniques; in live mode. Quite the same Wikipedia. Just better.
.
Leo
Newton
Brights
Milds

2000 Epping Forest District Council election

From Wikipedia, the free encyclopedia

2000 Epping Forest District Council election

← 1999 4 May 2000 2002 →

19 seats to Epping Forest District Council
29 seats needed for a majority
Turnout30.4% Increase1.4
  First party Second party Third party
 
Party Conservative Liberal Democrats Labour
Last election 19 seats, 42.7% 15 seats, 25.1% 14 seats, 26.4%
Seats before 18 16 14
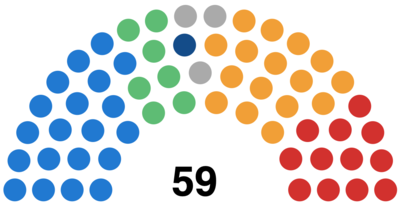
Seats won 20 16 12
Seat change Increase1 Increase1 Decrease2
Popular vote 8,465 4,751 3,738
Percentage 43.1% 24.2% 19.1%
Swing Increase0.4% Decrease0.9% Decrease7.3%

  Fourth party Fifth party
 
Party Loughton Residents Independent
Last election 7 seats, 2.6% 3 seats
Seats before 7 3
Seats won 7 3
Seat change Steady Steady
Popular vote 1,751 917
Percentage 8.9% 4.7%
Swing Increase6.3% N/A

Council composition following the election

Council control before election

No overall control
Conservative largest party

Council control after election

No overall control
Conservative largest party

Elections to Epping Forest Council were held on 4 May 2000. One third of the council was up for election and the council stayed under no overall control. Overall turnout was 30.4%. This was the last election with some of the current boundaries.

YouTube Encyclopedic

  • 1/5
    Views:
    7 116 433
    19 974
    737
    684
    24 840
  • The Secret City inside of London Revealed
  • The City of London's Medieval & Modern Guilds
  • Webinar: The right trees in the right places
  • RSM In Conversation Live with Steve Norris
  • The Mosley Riots - Professor Clive Bloom

Transcription

# The (Secret) City of London -- Part 1 The Great City of London, known for its historical landmarks, modern skyscrapers, ancient markets and famous bridges. It's arguably the financial capital of the world and home to over eleven *thousand* people. Wait, what? Eleven... thousand? That's right: but the City of London is a different place from London -- though London is also known for its historical landmarks, modern skyscrapers, ancient markets, famous bridges and is home to the government, royal family and seven million people. But, if you look map of London crafted by a careful cartographer that map will have a one-square mile hole near the middle -- it's here where the City of London lives inside of the city named London. Despite these confusingly close names the two Londons have separate city halls and elect separate mayors, who collect separate taxes to fund separate police who enforce separate laws. The Mayor of the City of London has a fancy title 'The Right Honourable the Lord Mayor of London' to match his fancy outfit. He also gets to ride in a golden carriage and work in a Guildhall while the mayor of London has to wear a suit, ride a bike and work in an office building. The City of London also has its own flag and its own crest which is awesome and makes London's lack of either twice as sad. To top it off the City of London gets to act more like one of the countries in the UK than just an oddly located city -- for uniquely the corporation that runs the city of London is older than the United Kingdom by several hundred years. So how did the UK end up with two Londons, one inside of the other? Because: Romans. 2,000 years ago they came to Great Britain, killed a bunch of druids, and founded a trading post on the River Thames and named it Londonimium. Being Romans they got to work doing what Romans do: enforcing laws, increasing trade, building temples, public baths, roads, bridges and a wall to defend their work. And it's this wall which is why the current City of London exists -- for though the Romans came and the Romans went and kingdoms rose and kingdoms fell, the wall endured protecting the city within. And The City, governing itself and trading with the world, grew rich. A thousand years after the Romans (yet still a thousand years ago) when William the Conqueror came to Great Britain to conqueror everything and begin modern british history he found the City of London, with its sturdy walls more challenging to defeat than farmers on open fields. So he agreed to recognize the rights and privileges City of Londoners were used to in return for the them recognizing him as the new King. Though after the negotiation, William quickly built towers around the City of London which were just as much about protecting William from the locals within as defending against the Vikings from without. This started a thousand-year long tradition whereby Monarchs always reconfirmed that 'yes' the City of London is a special, unique place best left to its own business, while simultaneously distrusting it. Many a monarch thought the City of London was too powerful and rich. And one even built a new Capital city nearby, named Westminster, to compete with the City of London and hopefully, suck power and wealth away from it. This was the start of the second London. As the centuries passed, Westminster grew and merged with nearby towns eventually surrounding the walled-in, and still separate City of London. But, people began to call the whole urban collection 'London' and the name became official when Parliament joined towns together under a single municipal government with a mayor. But, the mayor of London still doesn't have power over the tiny City of London which has rules and traditions like nowhere else in the country and possibly the world. For example, the ruling monarch doesn't just enter the City of London on a whim, but instead asks for permission from the Lord Mayor at a ceremony. While it's not required by law, the ceremony is, unusual to say the least. The City of London also has a representative in Parliament, The Remembrancer, whose job it is to protects the City's special rights. Because of this, laws passed by Parliament sometimes don't apply to the City of London: most notably voting reforms, which we'll discuss next time. But if you're curious, unlike anywhere else in the UK elections in the City of London involve Medieval Guilds and modern companies. Finally, the City of London also owns and operates land and buildings far outside its border, making it quite wealthy. Once you start looking for The City's Crest you'll find it in lots of places, but most notably on Tower Bridge which, while being in London is operated by City of London, These crests everywhere when combined with the City of London's age and wealth and quazi-independent status make it an irresistible temptation for conspiracy nuts. Add in the oldest Masonic temple and it's not long before the crazy part of the Internet yelling about secret societies controlling the world via the finance industry from inside the City-state of London. (And don't forget the reptilian alien Queen who's really behind it all.) But conspiracy theories aside, the City of London is not an independent nation like the Vatican is, no matter how much you might read it on the Internet, rather it's a unique place in the United Kingdom with a long and complicated history. The wall that began all this 2,000 years ago is now mostly gone -- so the border between London and its secret inner city isn't so obvious. Though, next time you're in London, if you come across a small dragon on the street, he still guards the entrance to the city in a city in a country in a country.
By-elections

Grange Hill by-election

Grange Hill By-Election 24 June 1999
Party Candidate Votes % ±%
Liberal Democrats 621 51.8 Decrease1.6
Conservative 534 45.0 Increase4.6
Labour 43 3.6 Decrease2.6
Majority 97 6.8 Decrease6.1
Turnout 1,198
Liberal Democrats hold Swing

Debden Green by-election

Debden Green By-Election 11 November 1999
Party Candidate Votes % ±%
Labour 514 68.8 Decrease6.7
Conservative 138 18.5 Decrease6.0
Independent 60 8.0 N/A
Liberal Democrats 35 4.7 Increase4.7
Majority 376 50.3 Decrease2.0
Turnout 747 19.2 Decrease4.8
Labour hold Swing

Results

Broadway

Broadway
Party Candidate Votes % ±%
Labour Margaret Owen 498 65.1 Decrease12.5
Conservative Ian Locks 267 34.9 Increase12.5
Majority 231 30.2 Decrease25.0
Turnout 765 19.8 Decrease2.5
Labour hold Swing

Buckhurst Hill East

Buckhurst Hill East
Party Candidate Votes % ±%
Liberal Democrats Leonard Martin 620 60.0 Decrease4.8
Conservative George Denny 301 29.1 Increase6.0
Labour Ronald Rodwell 112 10.8 Decrease1.3
Majority 319 30.9 Decrease10.8
Turnout 1,033 31.6 Increase5.5
Liberal Democrats hold Swing

Buckhurst Hill West

Buckhurst Hill West
Party Candidate Votes % ±%
Liberal Democrats Ann Haigh 876 55.0 Increase2.0
Conservative Richard Watts 648 40.7 Decrease1.8
Labour Janice Croke 70 4.4 Steady
Majority 228 14.3 Increase3.8
Turnout 1,594 32.2 Decrease0.5
Liberal Democrats hold Swing


Chigwell Village
Party Candidate Votes % ±%
Conservative John Gilliham 564 79.2 Increase47.3
Liberal Democrats Peter Netherclift 148 20.8 Increase14.9
Majority 416 58.4 Increase28.1
Turnout 712 22.5 Decrease9.1
Conservative hold Swing

Debden Green

Debden Green
Party Candidate Votes % ±%
Labour Colin Huckle 485 62.1 Decrease13.4
Conservative Derek Knight 296 37.9 Increase13.4
Majority 189 24.2 Decrease26.8
Turnout 781 20.1 Decrease1.0
Labour hold Swing

Epping Hemnall

Epping Hemnall
Party Candidate Votes % ±%
Liberal Democrats Janet Whitehouse 862 50.6 Increase0.5
Conservative Ian Hull 704 41.3 Increase0.7
Labour Barry Johns 137 8.0 Decrease1.4
Majority 158 9.3 Decrease0.2
Turnout 1,703 37.4 Decrease3.3
Liberal Democrats hold Swing

Epping Lindsey

Epping Lindsey
Party Candidate Votes % ±%
Conservative Richard Brady 705 41.8 Decrease7.6
Liberal Democrats Robert Goold 558 33.1 Increase13.0
Labour Thomas Norris 422 25.0 Decrease5.5
Majority 147 8.7 Decrease10.2
Turnout 1,685 36.3 Increase6.1
Conservative gain from Labour Swing

Grange Hill

Grange Hill
Party Candidate Votes % ±%
Liberal Democrats William Maclaine 740 53.4 Decrease1.5
Conservative Ronald McCarthy 561 40.4 Increase4.1
Labour Sidney Miller 86 6.2 Decrease2.6
Majority 179 13.0 Decrease5.6
Turnout 1,387 31.8 Increase5.8
Liberal Democrats hold Swing

High Ongar

High Ongar
Party Candidate Votes % ±%
Conservative  Maggie McEwen Unopposed
Majority N/A N/A Increase83.1
Turnout N/A N/A N/A
Conservative hold Swing

Loughton Forest

Loughton Forest
Party Candidate Votes % ±%
Loughton Residents Ronald Gow 537 51.2 Increase0.7
Conservative Stephen Metcalfe 402 38.4 Increase5.0
Labour Joan Ormston 109 10.4 Decrease2.8
Majority 135 12.8 Decrease4.3
Turnout 1,048 33.3 Decrease0.7
Loughton Residents hold Swing

Loughton Roding

Loughton Roding
Party Candidate Votes % ±%
Labour Stanley Goodwin 630 54.6 Decrease6.6
Conservative Jessica Bostock 375 32.5 Increase3.3
Liberal Democrats Lucille Thompson 148 12.8 Increase3.2
Majority 255 22.1 Decrease9.9
Turnout 1,153 28.8 Increase4.2
Labour hold Swing

Loughton St. John's

Loughton St John's
Party Candidate Votes % ±%
Loughton Residents Roger Pearce 602 53.8 Increase0.2
Conservative Colin Finn 401 35.8 Increase2.9
Labour Thomas Owen 116 10.4 Decrease3.0
Majority 201 18.0 Decrease2.7
Turnout 1,119 27.8 Increase5.3
Loughton Residents hold Swing

Loughton St. Mary's

Loughton St Mary's
Party Candidate Votes % ±%
Loughton Residents Michael Wardle 612 61.4 Increase1.7
Conservative John Silberrad 290 29.1 Increase5.7
Labour Peter Lavin 94 9.4 Decrease7.5
Majority 322 32.3 Decrease4.0
Turnout 996 31.0 Increase0.4
Loughton Residents hold Swing

Passingford

Passingford
Party Candidate Votes % ±%
Conservative Diana Collins 391 84.6 Decrease15.4
Liberal Democrats Susan Hutchings 71 15.4 Increase15.4
Majority 320 69.2 Decrease30.8
Turnout 462 29.7 Increase29.7
Conservative hold Swing

Roothing Country

Roothing Country
Party Candidate Votes % ±%
Liberal Democrats Douglas Kelly 431 66.5 Increase25.8
Conservative William White 217 33.5 Decrease4.2
Majority 214 33.0 Increase30.0
Turnout 648 54.5 Decrease2.3
Liberal Democrats hold Swing

Roydon

Roydon
Party Candidate Votes % ±%
Independent Norman Clark 435 82.7 Increase36.1
Labour Robin Walker 91 17.3 N/A
Majority 344 65.4 Increase54.9
Turnout 526 25.2 Decrease22.1
Independent gain from Independent Swing

Sheering

Sheering
Party Candidate Votes % ±%
Conservative John Harrington 397 76.9 Increase49.4
Labour Jill Finlay 119 23.1 Decrease1.1
Majority 278 53.8 Increase33.0
Turnout 516 23.8 Increase3.0
Conservative gain from Liberal Democrats Swing

Theydon Bois

Theydon Bois
Party Candidate Votes % ±%
Conservative Robert Glozier 591 45.2 Decrease17.7
Independent Ronald Smith 482 36.9 N/A
Liberal Democrats Monica Richardson 165 12.6 Decrease13.1
Labour Derek Clark 69 5.3 Decrease6.1
Majority 109 8.3 Decrease28.9
Turnout 1,307 42.5 Increase10.5
Conservative gain from Independent Swing

Waltham Abbey East

Waltham Abbey East
Party Candidate Votes % ±%
Conservative Mark Gilding 841 66.0 Increase5.2
Labour John Langer 340 26.7 Decrease4.4
Liberal Democrats Ingrid Black 93 7.3 Decrease0.8
Majority 501 39.3 Increase9.6
Turnout 1,274 22.8 Steady
Conservative hold Swing

Waltham Abbey Paternoster

Waltham Abbey Paternoster
Party Candidate Votes % ±%
Conservative Peter Johnson 514 56.3 Decrease7.2
Labour Albert Farren 360 39.4 Increase7.4
Liberal Democrats Olive Dunseath 39 4.3 Decrease0.2
Majority 154 16.9 Decrease14.6
Turnout 913 27.3 Increase1.4
Conservative gain from Labour Swing

References

This page was last edited on 6 January 2024, at 13:45
Basis of this page is in Wikipedia. Text is available under the CC BY-SA 3.0 Unported License. Non-text media are available under their specified licenses. Wikipedia® is a registered trademark of the Wikimedia Foundation, Inc. WIKI 2 is an independent company and has no affiliation with Wikimedia Foundation.