To install click the Add extension button. That's it.

The source code for the WIKI 2 extension is being checked by specialists of the Mozilla Foundation, Google, and Apple. You could also do it yourself at any point in time.

4,5
Kelly Slayton
Congratulations on this excellent venture… what a great idea!
Alexander Grigorievskiy
I use WIKI 2 every day and almost forgot how the original Wikipedia looks like.
Live Statistics
English Articles
Improved in 24 Hours
Added in 24 Hours
What we do. Every page goes through several hundred of perfecting techniques; in live mode. Quite the same Wikipedia. Just better.
.
Leo
Newton
Brights
Milds

2003 Harlow District Council election

From Wikipedia, the free encyclopedia

2003 Harlow District Council election
← 2002 1 May 2003 2004 →

11 of the 33 seats to Harlow District Council
17 seats needed for a majority
  First party Second party Third party
 
Party Conservative Liberal Democrats Labour
Seats before 12 12 9
Seats won 4 4 3
Seats after 12 12 9
Seat change Steady0 Steady0 Steady0
Popular vote 4,610 3,915 5,394
Percentage 32.7% 27.8% 38.3%

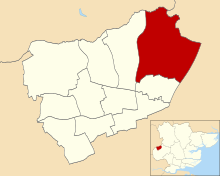
Map showing the results of contested wards in the 2003 Harlow District Council elections.

Council control before election

No overall control

Council control after election

No overall control

The 2003 Harlow District Council election took place on 1 May 2003 to elect members of Harlow District Council in Essex, England. One third of the council was up for election and the council stayed under no overall control.[1]

After the election, the composition of the council was

Background

Before the election both the Conservatives and Liberal Democrats had 12 councillors, while Labour had 9 seats.[3]

A total of 36 candidates stood for the 11 seats that were being contested, with the councillors who got the lowest number of votes from the 2002 election defending their seats.[3] One Labour councillor, John Cave, stood down at the election after 32 years, while 3 former Labour councillors and 1 former Liberal Democrat councillor attempted to regain seats.[3] Among the councillors defending their seats was the Conservative group leader Andrew Johnson in Sumners and Kingsmoor ward.[3]

Election result

There was no change in the party situation on the council with no party gaining a majority.[4] The closest result was in Bush Fair ward where Liberal Democrat Chris Millington held the seat by 39 votes, but the Liberal Democrat council chairman Nick Macy was not re-elected after contesting the Labour held seat in Little Parndon and Hare Street.[5] Overall turnout at the election was 29%.[6]

However an enquiry was started after the election as 3,279 postal votes had to be rejected as they did not have an official mark on them.[7]

Harlow local election result 2003[2][6]
Party Seats Gains Losses Net gain/loss Seats % Votes % Votes +/−
  Conservative 4 0 0 Steady 36.4 32.7 4,610 Increase0.9
  Liberal Democrats 4 0 0 Steady 36.4 27.8 3,915 Decrease1.9
  Labour 3 0 0 Steady 27.3 38.3 5,394 Increase0.6
  Socialist Alliance 0 0 0 Steady 0 1.3 181 Increase0.7

Ward results

Bush Fair

Location of Bush Fair ward
Bush Fair[6]
Party Candidate Votes %
Liberal Democrats Christopher Millington 663 46.5
Labour Terence Brandon 624 43.7
Conservative Hazel Beckers 140 9.8
Majority 39 2.8
Turnout 1,427 31.3
Liberal Democrats hold

Church Langley

Location of Church Langley ward
Church Langley[6]
Party Candidate Votes %
Conservative Anthony Hall 705 68.2
Liberal Democrats Molly White 179 17.3
Labour Tina Baker 150 14.5
Majority 526 50.9
Turnout 1,034 22.5
Conservative hold

Great Parndon

Location of Great Parndon ward
Great Parndon[6]
Party Candidate Votes %
Conservative Patrick McClarnon 706 49.3
Labour Suzanne Ennifer 514 35.9
Liberal Democrats Peter Barton 211 14.7
Majority 192 13.4
Turnout 1,431 30.9
Conservative hold

Harlow Common

Location of Harlow Common ward
Harlow Common[6]
Party Candidate Votes %
Labour Mark Wilkinson 725 54.5
Conservative Nora Arnott 405 30.4
Liberal Democrats Audrey Curran 201 15.1
Majority 320 24.1
Turnout 1,331 29.1
Labour hold

Little Parndon & Hare Street

Location of Little Parndon and Hare Street ward
Little Parndon & Hare Street[6]
Party Candidate Votes %
Labour Valerie Clark 707 49.2
Liberal Democrats Nicholas Macy 372 25.9
Conservative John Goddard 293 20.4
Socialist Alliance John Hobbs 66 4.6
Majority 335 23.3
Turnout 1,438 31.0
Labour hold

Mark Hall

Location of Mark Hall ward
Mark Hall[6]
Party Candidate Votes %
Liberal Democrats Lesley Rideout 598 44.8
Labour Sean Folan 510 38.2
Conservative Callum Finlayson 179 13.4
Socialist Alliance Robert Delbridge 48 3.6
Majority 88 6.6
Turnout 1,335 33.6
Liberal Democrats hold

Netteswell

Location of Netteswell ward
Netteswell[6]
Party Candidate Votes %
Liberal Democrats James Pailing 622 49.8
Labour Feroz Khan 406 32.5
Conservative Matthew Warren 153 12.3
Socialist Alliance Josephine Clarke 67 5.4
Majority 216 17.3
Turnout 1,248 29.2
Liberal Democrats hold

Old Harlow

Location of Old Harlow ward
Old Harlow[6]
Party Candidate Votes %
Conservative Sue Livings 809 56.3
Labour Robert Eschle 430 29.9
Liberal Democrats Simon MacNeill 198 13.8
Majority 379 26.4
Turnout 1,437 34.5
Conservative hold

Staple Tye

Location of Staple Tye ward
Staple Tye[6]
Party Candidate Votes %
Liberal Democrats Michael Faccini 519 55.2
Labour Sandra Rootsey 246 26.2
Conservative Shona Souter 175 18.6
Majority 273 29.0
Turnout 940 22.7
Liberal Democrats hold

Sumners and Kingsmoor

Location of Summers and Kingsmoor ward
Sumners and Kingsmoor[6]
Party Candidate Votes %
Conservative Andrew Johnson 572 48.2
Labour Derek Eardley 452 38.1
Liberal Democrats Peter Mabey 163 13.7
Majority 120 10.1
Turnout 1,187 25.4
Conservative hold

Toddbrook

Location of Toddbrook ward
Toddbrook[6]
Party Candidate Votes %
Labour Robert Davis 630 48.8
Conservative Muriel Jolles 473 36.6
Liberal Democrats Paul Lawton 189 14.6
Majority 157 12.2
Turnout 1,292 29.6
Labour hold

References

  1. ^ "Local elections". BBC News Online. Retrieved 31 December 2014.
  2. ^ a b "English councils - Non-metropolitan districts". The Times. NewsBank. 3 May 2003. p. 47.
  3. ^ a b c d "Citizen election news". Greater London, Kent, and Surrey Counties Publications. NewsBank. 7 April 2003.
  4. ^ "Essex: Tories make gains in local elections". Essex County Publications. NewsBank. 2 May 2003.
  5. ^ "Election reaction". Hertfordshire County Publications. NewsBank. 7 May 2003.
  6. ^ a b c d e f g h i j k l m "Election results". Harlow District Council. Political Science Resources. Archived from the original on 31 December 2014. Retrieved 31 December 2014.
  7. ^ "Ballot blunder probed". Greater London, Kent, and Surrey Counties Publications. NewsBank. 7 May 2003.
This page was last edited on 27 July 2023, at 20:28
Basis of this page is in Wikipedia. Text is available under the CC BY-SA 3.0 Unported License. Non-text media are available under their specified licenses. Wikipedia® is a registered trademark of the Wikimedia Foundation, Inc. WIKI 2 is an independent company and has no affiliation with Wikimedia Foundation.