
Kent, Texas | |
|---|---|
 Ruins of Kent Public School | |
| Nickname: Kent Ghost Town | |
 Kent Location of Kent in West Texas  Kent Kent (the United States) | |
| Coordinates: 31°04′09″N 104°13′02″W / 31.06917°N 104.21722°W | |
| Country | United States |
| State | Texas |
| County | Culberson |
| Elevation | 4,206 ft (1,282 m) |
| Population (2000[2]) | |
| • Total | 60 |
| Time zone | UTC-6 (Central (CST)) |
| • Summer (DST) | UTC-5 (CDT) |
| ZIP code | 79855 |
| Area code | 432 |
Kent is a ghost town in Culberson County, Texas, United States.
YouTube Encyclopedic
-
1/1Views:397
-
The Old Kent County Jail Ghost Town Clairmont Texas
Transcription
Description
The ghost town lies just north of Interstate 10 at exit 176, 10 miles (16 km) west of the beginning of Interstate 20 and 4 miles (6.4 km) west of the Jeff Davis County line. It is sandwiched between the railroad, immediately to its north, and the Interstate. As of 2023, the store has closed and the gas pumps have been dismantled, and the houses abandoned. There is nothing now at Kent in the way of businesses, services or people.
History
As of 2005, its population was estimated at 60 residents, with three small businesses, a general store, a service station, and a post office, as well as ruins of a public school and other businesses that flourished until the 1960s.
As of 2014, only the general store remained in operation; the nearest service station is in Plateau, 18 miles (29 km) to the west along Interstate 10. It therefore has had no medical, pharmaceutical, public educational, legal, police, fire, or other governmental services beyond the post office within its boundaries; the nearest source of these is in Van Horn, 37 miles (60 km) west.
As of May 9, 2019, the post office closed and redirected customers to Van Horn.[3] No motels, hotels, trailer/RV parks, restaurants, or other tourist services are available. The surrounding county area contains semi-desert land supporting large cattle ranches.
Climate
According to the Köppen climate classification, Kent has a semiarid climate, BSk on climate maps.[4]
| Climate data for Kent, Texas, 1991–2020 normals, extremes 1988–present | |||||||||||||
|---|---|---|---|---|---|---|---|---|---|---|---|---|---|
| Month | Jan | Feb | Mar | Apr | May | Jun | Jul | Aug | Sep | Oct | Nov | Dec | Year |
| Record high °F (°C) | 81 (27) |
85 (29) |
90 (32) |
96 (36) |
101 (38) |
108 (42) |
105 (41) |
106 (41) |
99 (37) |
93 (34) |
88 (31) |
80 (27) |
108 (42) |
| Mean maximum °F (°C) | 72.9 (22.7) |
76.9 (24.9) |
83.7 (28.7) |
88.7 (31.5) |
95.9 (35.5) |
101.1 (38.4) |
98.8 (37.1) |
96.1 (35.6) |
92.9 (33.8) |
88.2 (31.2) |
80.1 (26.7) |
73.9 (23.3) |
102.2 (39.0) |
| Mean daily maximum °F (°C) | 57.7 (14.3) |
62.6 (17.0) |
69.6 (20.9) |
77.6 (25.3) |
85.5 (29.7) |
92.5 (33.6) |
90.7 (32.6) |
89.9 (32.2) |
83.6 (28.7) |
76.8 (24.9) |
66.6 (19.2) |
58.6 (14.8) |
76.0 (24.4) |
| Daily mean °F (°C) | 45.6 (7.6) |
50.0 (10.0) |
56.1 (13.4) |
63.5 (17.5) |
71.9 (22.2) |
79.1 (26.2) |
78.9 (26.1) |
77.7 (25.4) |
71.8 (22.1) |
64.1 (17.8) |
54.1 (12.3) |
46.8 (8.2) |
63.3 (17.4) |
| Mean daily minimum °F (°C) | 33.5 (0.8) |
37.3 (2.9) |
42.6 (5.9) |
49.4 (9.7) |
58.3 (14.6) |
65.7 (18.7) |
66.6 (19.2) |
65.6 (18.7) |
60.0 (15.6) |
51.4 (10.8) |
41.5 (5.3) |
35.0 (1.7) |
50.6 (10.3) |
| Mean minimum °F (°C) | 17.1 (−8.3) |
20.3 (−6.5) |
25.0 (−3.9) |
32.8 (0.4) |
42.8 (6.0) |
55.7 (13.2) |
59.5 (15.3) |
58.6 (14.8) |
47.6 (8.7) |
34.2 (1.2) |
22.9 (−5.1) |
17.2 (−8.2) |
13.5 (−10.3) |
| Record low °F (°C) | 6 (−14) |
0 (−18) |
11 (−12) |
23 (−5) |
32 (0) |
47 (8) |
52 (11) |
53 (12) |
34 (1) |
19 (−7) |
10 (−12) |
0 (−18) |
0 (−18) |
| Average precipitation inches (mm) | 0.66 (17) |
0.41 (10) |
0.42 (11) |
0.62 (16) |
0.93 (24) |
1.26 (32) |
2.70 (69) |
1.72 (44) |
2.01 (51) |
1.09 (28) |
0.58 (15) |
0.66 (17) |
13.06 (334) |
| Average snowfall inches (cm) | 1.5 (3.8) |
0.2 (0.51) |
0.1 (0.25) |
0.0 (0.0) |
0.0 (0.0) |
0.0 (0.0) |
0.0 (0.0) |
0.0 (0.0) |
0.0 (0.0) |
0.0 (0.0) |
0.2 (0.51) |
1.9 (4.8) |
3.9 (9.87) |
| Average precipitation days (≥ 0.01 in) | 2.6 | 2.0 | 2.2 | 1.9 | 3.5 | 4.6 | 7.4 | 5.8 | 5.3 | 4.1 | 1.9 | 2.5 | 43.8 |
| Average snowy days (≥ 0.1 in) | 0.4 | 0.1 | 0.0 | 0.0 | 0.0 | 0.0 | 0.0 | 0.0 | 0.0 | 0.0 | 0.1 | 0.5 | 1.1 |
| Source 1: NOAA[5] | |||||||||||||
| Source 2: National Weather Service[6] | |||||||||||||
See also
References
- ^ "Kent". Geographic Names Information System. United States Geological Survey, United States Department of the Interior.
- ^ Kent at TSHA
- ^ American Decay - The Modern Frontiersman. "Exploring The Erie Ghost Town of Kent, TX". Youtube. Archived from the original on December 21, 2021. Retrieved July 11, 2021.
- ^ Climate Summary for Kent, Texas
- ^ "U.S. Climate Normals Quick Access – Station: Kent 8SE, TX". National Oceanic and Atmospheric Administration. Retrieved August 10, 2023.
- ^ "NOAA Online Weather Data – NWS Midland". National Weather Service. Retrieved August 10, 2023.
External links
Municipalities and communities of Culberson County, Texas, United States | ||
|---|---|---|
| Town | 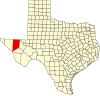 | |
| Unincorporated communities | ||
| Ghost town | ||
| This article about a location in Culberson County, Texas is a stub. You can help Wikipedia by expanding it. |