
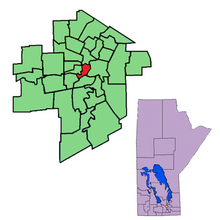
 Location in Winnipeg | |||
| Provincial electoral district | |||
| Legislature | Legislative Assembly of Manitoba | ||
| MLA |
New Democratic | ||
| District created | 1957 | ||
| First contested | 1958 | ||
| Last contested | 2023 | ||
Fort Rouge is a provincial electoral division in the Canadian province of Manitoba. It was created by redistribution in 1957, and formally came into existence in the general election of 1958. The riding was eliminated in 1989, and re-established in 1999. It is located in the central section of the City of Winnipeg.
Fort Rouge is bordered on the east by St. Boniface, to the south by Fort Garry-Riverview, to the north by Logan, and to the west by River Heights. The actual Legislative Assembly of Manitoba building is located across the river from Fort Rouge.
The riding's population in 1996 was 20,364. In 1999, the average family income was $49,361, and the unemployment rate was 8.70%. 39.6% of Fort Rouge's residents are listed as low-income, the sixth-highest rate in the province. Almost 80% of occupied dwelling are rentals, and over 20% of households are single-parent families. Almost 25% of Fort Rouge's residents have a university degree—one of the highest rates in the province.
Fort Rouge has an immigrant population of 20%. Eight per cent of the riding's residents are aboriginal. The service sector accounts for 21% of Fort Rouge's industry, with a further 11% in social services.
The seat was held by the Progressive Conservatives from 1958 to 1973, and was a rare bastion of Liberal strength in the province from 1973 to 1981. Lloyd Axworthy was the riding's representative from 1973 to 1979; for a time, he was the only Liberal in the legislature. Roland Penner's election for the New Democratic Party in 1981, however, foretold of future NDP successes in the riding. Though Jim Carr would win the riding back for the Liberals in 1988, the seat would be broken into Crescentwood, Broadway and Osborne for the 1990 election. By the time the seat was reestablished in 1999, Crescentwood, Broadway and Osborne would all have NDP representatives, with Crescentwood MLA Tim Sale becoming the first MLA of the reestablished Fort Rouge. It has been continuously represented by the NDP since the riding was reestablished in 1999.
In the 2007, 2011 and 2016 provincial elections the Liberals were the main challengers to the NDP, though the party would continue to hold the seat with Jennifer Howard. In 2016, Liberal leader Rana Bokhari ran in Fort Rouge, losing to the NDP star candidate Wab Kinew. At the 2015 federal election, according to Elections Canada data, Fort Rouge voted heavily Liberal.[1] In the 2019 and 2023 elections, the Progressive Conservatives finished second behind the NDP, with the Liberals falling behind Green candidate James Beddome in 2019.
The district is represented by NDP leader and Premier Wab Kinew.
YouTube Encyclopedic
-
1/1Views:458 962
-
Electoral college | American civics | US History | Khan Academy
Transcription
In the US, we don't directly vote for our president or vice president. Instead, we use something called the Electoral College. So when you show up to vote on Election Day-- and an election day will happen in November of an election year. And it could happen as early as November 2, and it could happen as late as November 8. And it's going to be the Tuesday after the first Monday in the month. So it'll be November 2 if the first Monday is November 1, and it'll be November 8 if the first Monday is November 7. And so you go on election day, and you will see a ballot that will have the presidential candidates. It'll have their parties there. It will have the vice presidential candidates, and you'll vote for one of them. But in actuality, when you are voting for Candidate A-- and let's say Candidate A is a Democrat-- you're not actually voting for Candidate A. You're actually voting for a slate of electors who promise to vote for that candidate. And it isn't in most states proportional based on what proportion of people vote for one candidate or another. In most of the states, except for Maine and Nebraska, it is a winner take all system. So what do I mean by that? So right here, you have the breakdown of the United States, by state, of how many electors words each state gets. And the number of electors is essentially the number of congressmen that that state has. For example, California has two senators. Every state has two senators. California has two senators and 53 congressmen. And those of you who aren't familiar with it, every state gets two senators, and the House of Representatives is dictated by population. California is a huge state, two senators, 53 representatives. You have Texas, two senators and it has 32 representatives. You go to Louisiana, you have two senators and you have seven representatives. So the electors per state is based on the total number of congressmen, so the number of senators plus the number of representatives. That's what gives us 55 in California, nine in Louisiana, 34 in Texas. But what's interesting here is it's a winner take all system in every state except for Nebraska and Maine. In every other state, if I get 51% of the vote in Texas, I get all 34 electoral votes in the Electoral College. If I get 51% or even if I get 50.1%, just a slight majority of the votes in California, I will get all of the votes for California in the Electoral College. And in general, or in actuality, the president is whoever gets the majority of the electoral votes in the United States. And right now, that threshold is, or that magic number-- you could think of it that way-- is 270 Electoral College votes. If no candidate is able to hit this threshold of 270 Electoral College votes, then it will go to the US Congress. And in the US Congress, it's interesting, because it isn't one congressman, one vote. Or actually, I should say the US House of Representatives. It'll go to the US House of Representatives. And it won't be one representative, one vote. What will happen is the representatives in each state will vote together, and each state will get only one vote. So in a tiebreaker, the big states really, really lose out, because in a tiebreaker, Texas will get only one vote. California will get one vote. And Alaska will get one vote, and Rhode Island will get one vote. So Rhode Island will have just as much say in a tiebreaker as California will over who will be president. Then they'll just keep voting until someone gets a simple majority of the votes by state. Now, there's one other twist here. It's that the District of Columbia-- Washington, DC right over here-- in Congress gets no representatives. They have no senators, and they have no representatives. But they do get three electoral votes when it comes to deciding who is going to be president. Now, you might already be getting a sense here that maybe this winner take all system might lead to some distortions, and the biggest distortion of all is you can imagine a candidate who wins the popular vote and loses the election or loses in the Electoral College. And you might think, well, gee, how can that happen? And the way to think about it is, imagine someone-- let's say someone gets-- with the states that they win, they get huge majorities. So let's say there's a conservative candidate, and he or she gets huge majorities in the states they win. 80% in Texas. They get 80% in Mississippi. They get 80% in Oklahoma. The get huge majorities in the states that they win. And the states that they lose, they barely lose. And they barely lose those really big states. So let's say in Florida, that candidate gets 49% of the vote. So they had a lot of votes in Florida, but not enough to win it. The other person, let's say, gets 51%. All 27 go to the other candidate. Let's say the same thing happens in California. That candidate got 49% of the vote. The opponent, let's say, gets 51% of the vote. All 55 go to California. You get no credit for that 49%. You get no credit for that 49% in Florida. So in this situation, this candidate might actually end up with the majority, barely losing the states they lose, and trouncing the other candidate in the states that they win, but despite that, actually getting fewer Electoral College votes. Now, there's a few clarifications I want to make, especially ones that have confused me in the past. One of them is because you have the same number of Electoral College votes as you have US representatives plus senators, there's kind of this feeling that maybe each district sends its own elector to the state capital to decide who the president is. And it doesn't quite work that way. So this right here is the panel of electors for Louisiana in 2008. And you can see right over here, each of the parties have their own slate of electors. And these are either decided by the party themselves, or they're decided by the candidates' teams. And even though you have someone here for each district and then you have these at-large candidates, it's not like-- let's take a situation. This actually happened in Louisiana, where John McCain got a majority of the state. So John McCain and Sarah Palin got a majority of the state. It's not the case that-- let's say in the second district, which is New Orleans, let's say that the second district, a majority of the people actually voted for Barack Obama. It is not the case that Kenneth Garrett in 2008 would have been the chosen elector. Even though they divide things by district and they have these at-large candidates, it is actually a state-wide election. So they don't look at who won each of the districts. They just say, look, John McCain and Sarah Palin won the entire state. So all of these electors are the ones that are going to go to the state capital in December and decide who they want to pledge their vote for. So even if Obama won just the Second Congressional District, that's not how it's thought about in the Electoral College. It's just a state-wide election. McCain got the majority of the state. All of the electors will be chosen from McCain's slate or from the Republican Party slate. And then they're going to go to the state capital. In the case of Louisiana, it would be Baton Rouge. And they will decide who they want to pledge their votes to. And all of the electors in all of the states go to their designated location, usually the state capital, on the same day. And usually that is some day in December. And they pick the president, although by that point, everyone knows who the president is, because the actual election was in early November. And people know which way the votes went and which way the actual Electoral College votes went. Now, I did mention that there are two states that don't do this winner take all, Nebraska and Maine. And in Nebraska and Maine, when you go vote, it really is by congressional district. Nebraska has three congressional districts. So in those three congressional districts, if one of them goes to the Democrat and two goes to the Republican, then they'll have one electoral vote for the Democrat and two for the Republican. And then they have two at-large votes that are decided the same way, in kind of the winner take all basis. If you get 51% of the vote on a statewide basis, you get the two at-large votes. Same thing for Maine, but Maine has two congressional districts. So two of the congressional districts could go either way. And then the at-large are based on a state-wide vote. Now, you could imagine the other kind of unfair thing here, other than the popular vote versus the Electoral College vote. You could imagine it makes some states better represented than others. So if you just divide population by the number of electors, you see the larger states, each elector is representing many, many more people. This is California right here. Each elector is representing over 600,000 people. And in the smaller states-- this is Wyoming right here-- each elector is representing under 200,000 people. So in Wyoming, people are getting kind of three times the representation as they would in California on a per capita vote. But what makes it even a little bit more skewed, because it's winner take all and the candidates aren't silly and they want to make sure that they spend their money and their visits and their time in the most leveragable way, it actually creates this weird scenario where candidates will often ignore huge parts of the population. And they ignore them because those huge parts of the population are unlikely to swing one way or the other. So for example, California is very reliably Democratic and Texas is very reliably Republican. So this right here-- this is a fascinating graph, at least in my mind-- it shows where George W. Bush and John Kerry spent the last five weeks of the 2004 election. Let me close that right there. This top graph shows where they actually spent their time, so each of these little hands here is a visit in those final five weeks. And each of these dollar signs is a million dollars spent on marketing and advertising, on ads and whatever else, in those states. And you can see, California and Texas, the two biggest states, they didn't spend enough money to the threshold to get dollar a sign written there. So they didn't even spend $1,000,000 on these huge states. They only had a few visits to California, and Texas had no visits in the final five weeks. So what happens is that candidates spend a disproportionate amount of attention and money in the states that are more likely to swing one way or another. So the people in Florida or in Ohio-- so this is Ohio and Florida-- got a ton more attention, especially on a per person basis, than the people in Texas did.
List of provincial representatives
| Name | Party | Took office | Left office |
|---|---|---|---|
| Gurney Evans | PC | 1958 | 1969 |
| Inez Trueman | PC | 1969 | 1973 |
| Lloyd Axworthy | Lib | 1973 | 1979 |
| June Westbury | Lib | 1979 | 1981 |
| Roland Penner | NDP | 1981 | 1988 |
| Jim Carr | Lib | 1988 | 1990 |
| See Broadway, Osborne, Crescentwood (1990-1999) | |||
| Tim Sale | NDP | 1999 | 2007 |
| Jennifer Howard | NDP | 2007 | 2016 |
| Wab Kinew | NDP | 2016 | present |
Opinion polls
| Polling firm | Last date of polling | Link | NDP | Liberal | PC | Green | Other |
|---|---|---|---|---|---|---|---|
| Mainstreet Research/Postmedia | March 22, 2016 | HTML | 29 | 32 | 30 | 8 |
Election results
1958
| 1958 Manitoba general election | ||||||||
|---|---|---|---|---|---|---|---|---|
| Party | Candidate | Votes | % | |||||
| Progressive Conservative | Gurney Evans | 3,647 | 54.83 | |||||
| Liberal–Progressive | James Edward "Jimmy" Wilson | 1,862 | 27.99 | |||||
| Co-operative Commonwealth | Ernest Draffin | 1,143 | 17.18 | |||||
| Total valid votes | 6,652 | – | ||||||
| Rejected | 26 | – | ||||||
| Eligible voters / Turnout | 12,010 | 55.60 | ||||||
Source(s)
Source: Manitoba. Chief Electoral Officer (1999). Statement of Votes for the 37th Provincial General Election, September 21, 1999 (PDF) (Report). Winnipeg: Elections Manitoba. | ||||||||
1959
| 1959 Manitoba general election | ||||||||
|---|---|---|---|---|---|---|---|---|
| Party | Candidate | Votes | % | ±% | ||||
| Progressive Conservative | Gurney Evans | 4,352 | 56.34 | 1.52 | ||||
| Liberal–Progressive | Jerry Marrin | 1,947 | 25.21 | -2.78 | ||||
| Co-operative Commonwealth | Robert C. Murdoch | 1,425 | 18.45 | 1.27 | ||||
| Total valid votes | 7,724 | – | – | |||||
| Rejected | 55 | – | ||||||
| Eligible voters / Turnout | 12,183 | 63.85 | 8.25 | |||||
Source(s)
Source: Manitoba. Chief Electoral Officer (1999). Statement of Votes for the 37th Provincial General Election, September 21, 1999 (PDF) (Report). Winnipeg: Elections Manitoba. | ||||||||
1962
| 1962 Manitoba general election | ||||||||
|---|---|---|---|---|---|---|---|---|
| Party | Candidate | Votes | % | ±% | ||||
| Progressive Conservative | Gurney Evans | 3,507 | 52.94 | -3.41 | ||||
| Liberal | Brock McArthur | 2,128 | 32.12 | 6.91 | ||||
| New Democratic | William R. Reid | 990 | 14.94 | -3.51 | ||||
| Total valid votes | 6,625 | – | – | |||||
| Rejected | 76 | – | ||||||
| Eligible voters / Turnout | 11,989 | 55.89 | -7.96 | |||||
Source(s)
Source: Manitoba. Chief Electoral Officer (1999). Statement of Votes for the 37th Provincial General Election, September 21, 1999 (PDF) (Report). Winnipeg: Elections Manitoba. | ||||||||
1966
| 1966 Manitoba general election | ||||||||
|---|---|---|---|---|---|---|---|---|
| Party | Candidate | Votes | % | ±% | ||||
| Progressive Conservative | Gurney Evans | 3,767 | 46.72 | -6.22 | ||||
| Liberal | Francis C. Muldoon | 2,451 | 30.40 | -1.72 | ||||
| New Democratic | Len Green | 1,845 | 22.88 | 7.94 | ||||
| Total valid votes | 8,063 | – | – | |||||
| Rejected | 22 | – | ||||||
| Eligible voters / Turnout | 13,105 | 61.69 | 5.80 | |||||
Source(s)
Source: Manitoba. Chief Electoral Officer (1999). Statement of Votes for the 37th Provincial General Election, September 21, 1999 (PDF) (Report). Winnipeg: Elections Manitoba. | ||||||||
1969
| 1969 Manitoba general election | ||||||||
|---|---|---|---|---|---|---|---|---|
| Party | Candidate | Votes | % | ±% | ||||
| Progressive Conservative | Inez Trueman | 2,750 | 38.53 | -8.19 | ||||
| New Democratic | Una Decter | 2,446 | 34.27 | 11.39 | ||||
| Liberal | Jane Sayler Heffelfinger | 1,941 | 27.20 | -3.20 | ||||
| Total valid votes | 7,137 | – | – | |||||
| Rejected | 51 | – | ||||||
| Eligible voters / Turnout | 12,328 | 58.31 | -3.39 | |||||
Source(s)
Source: Manitoba. Chief Electoral Officer (1999). Statement of Votes for the 37th Provincial General Election, September 21, 1999 (PDF) (Report). Winnipeg: Elections Manitoba. | ||||||||
1973
| 1973 Manitoba general election | ||||||||
|---|---|---|---|---|---|---|---|---|
| Party | Candidate | Votes | % | ±% | ||||
| Liberal | Lloyd Axworthy | 4,181 | 36.49 | 9.30 | ||||
| New Democratic | Samia Friesen | 3,614 | 31.54 | -2.73 | ||||
| Progressive Conservative | Inez Trueman | 3,531 | 30.82 | -7.71 | ||||
| Independent | Lane McDonald | 131 | 1.14 | – | ||||
| Total valid votes | 11,457 | – | – | |||||
| Rejected | 79 | – | ||||||
| Eligible voters / Turnout | 14,340 | 80.45 | 22.14 | |||||
Source(s)
Source: Manitoba. Chief Electoral Officer (1999). Statement of Votes for the 37th Provincial General Election, September 21, 1999 (PDF) (Report). Winnipeg: Elections Manitoba. | ||||||||
1977
| 1977 Manitoba general election | ||||||||
|---|---|---|---|---|---|---|---|---|
| Party | Candidate | Votes | % | ±% | ||||
| Liberal | Lloyd Axworthy | 4,153 | 39.54 | 3.05 | ||||
| Progressive Conservative | Julian Hugh McDonald | 3,486 | 33.19 | 2.37 | ||||
| New Democratic | Ermano Barone | 2,863 | 27.26 | -4.28 | ||||
| Total valid votes | 10,502 | – | – | |||||
| Rejected | 55 | – | ||||||
| Eligible voters / Turnout | 14,272 | 73.97 | -6.48 | |||||
Source(s)
Source: Manitoba. Chief Electoral Officer (1999). Statement of Votes for the 37th Provincial General Election, September 21, 1999 (PDF) (Report). Winnipeg: Elections Manitoba. | ||||||||
1979 by-election
| Manitoba provincial by-election, October 16, 1979 | ||||||||
|---|---|---|---|---|---|---|---|---|
| Party | Candidate | Votes | % | ±% | ||||
| Liberal | June Westbury | 2,659 | 39.22 | -0.33 | ||||
| New Democratic | Victor Steven "Vic" Savino | 2,291 | 33.79 | 6.53 | ||||
| Progressive Conservative | Julian Hugh McDonald | 1,830 | 26.99 | -6.20 | ||||
| Total valid votes | 6,780 | – | – | |||||
| Rejected | N/A | – | ||||||
| Eligible voters / Turnout | N/A | – | – | |||||
Source(s)
Source: Manitoba. Chief Electoral Officer (1999). Statement of Votes for the 37th Provincial General Election, September 21, 1999 (PDF) (Report). Winnipeg: Elections Manitoba. | ||||||||
1981
| 1981 Manitoba general election | ||||||||
|---|---|---|---|---|---|---|---|---|
| Party | Candidate | Votes | % | ±% | ||||
| New Democratic | Roland Penner | 4,342 | 44.57 | 10.77 | ||||
| Progressive Conservative | Perry Schulman | 2,843 | 29.18 | 2.19 | ||||
| Liberal | June Westbury | 2,415 | 24.79 | -14.43 | ||||
| Progressive | Bud Boyce | 143 | 1.47 | – | ||||
| Total valid votes | 9,743 | – | – | |||||
| Rejected | 77 | – | ||||||
| Eligible voters / Turnout | 13,671 | 71.83 | – | |||||
Source(s)
Source: Manitoba. Chief Electoral Officer (1999). Statement of Votes for the 37th Provincial General Election, September 21, 1999 (PDF) (Report). Winnipeg: Elections Manitoba. | ||||||||
1986
| 1986 Manitoba general election | ||||||||
|---|---|---|---|---|---|---|---|---|
| Party | Candidate | Votes | % | ±% | ||||
| New Democratic | Roland Penner | 4,223 | 48.86 | 4.30 | ||||
| Progressive Conservative | Robert P. Haier | 2,590 | 29.97 | 0.79 | ||||
| Liberal | Lionel Ditz | 1,683 | 19.47 | -5.31 | ||||
| Libertarian | Clancy Smith | 101 | 1.17 | – | ||||
| Communist | Nigel Hanrahan | 46 | 0.53 | – | ||||
| Total valid votes | 8,643 | – | – | |||||
| Rejected | 53 | – | ||||||
| Eligible voters / Turnout | 13,517 | 64.33 | -7.50 | |||||
Source(s)
Source: Manitoba. Chief Electoral Officer (1999). Statement of Votes for the 37th Provincial General Election, September 21, 1999 (PDF) (Report). Winnipeg: Elections Manitoba. | ||||||||
1988
| 1988 Manitoba general election | ||||||||
|---|---|---|---|---|---|---|---|---|
| Party | Candidate | Votes | % | ±% | ||||
| Liberal | Jim Carr | 5,127 | 48.91 | 29.44 | ||||
| New Democratic | Roland Penner | 2,912 | 27.78 | -21.08 | ||||
| Progressive Conservative | Robert Haier | 2,303 | 21.97 | -8.00 | ||||
| Progressive | Gordon Pratt | 75 | 0.72 | – | ||||
| Libertarian | Dennis Owens | 66 | 0.63 | -0.54 | ||||
| Total valid votes | 10,483 | – | – | |||||
| Rejected | 50 | – | ||||||
| Eligible voters / turnout | 15,057 | 69.95 | 5.62 | |||||
| Liberal gain from New Democratic | Swing | +25.22 | ||||||
Source(s)
Source: Manitoba. Chief Electoral Officer (1999). Statement of Votes for the 37th Provincial General Election, September 21, 1999 (PDF) (Report). Winnipeg: Elections Manitoba. | ||||||||
1999
| 1999 Manitoba general election | ||||||||
|---|---|---|---|---|---|---|---|---|
| Party | Candidate | Votes | % | Expenditures | ||||
| New Democratic | Tim Sale | 4,759 | 48.68 | $25,152.00 | ||||
| Progressive Conservative | Ron Paley | 2,971 | 30.39 | $26,322.65 | ||||
| Liberal | John Shanski | 1,870 | 19.13 | $24,461.96 | ||||
| Green | Alex Reid | 176 | 1.80 | $256.65 | ||||
| Total valid votes | 9,776 | – | ||||||
| Rejected | 52 | – | ||||||
| Eligible voters / turnout | 14,064 | 69.88 | ||||||
Source(s)
Source: Manitoba. Chief Electoral Officer (1999). Statement of Votes for the 37th Provincial General Election, September 21, 1999 (PDF) (Report). Winnipeg: Elections Manitoba. | ||||||||
2003
| 2003 Manitoba general election | ||||||||
|---|---|---|---|---|---|---|---|---|
| Party | Candidate | Votes | % | ±% | Expenditures | |||
| New Democratic | Tim Sale | 4,118 | 57.63 | 8.95 | $16,724.33 | |||
| Progressive Conservative | Mark Francis | 1,409 | 19.72 | -10.67 | $8,860.98 | |||
| Liberal | David Henteleff | 1,212 | 16.96 | -2.17 | $4,299.83 | |||
| Green | Mikel Magnusson | 355 | 4.97 | 3.17 | $48.24 | |||
| Libertarian | Jim Weidman | 51 | 0.71 | – | $0.00 | |||
| Total valid votes | 7,145 | – | – | |||||
| Rejected | 59 | – | ||||||
| Eligible voters / turnout | 13,182 | 54.65 | -15.23 | |||||
Source(s)
Source: Manitoba. Chief Electoral Officer (2003). Statement of Votes for the 38th Provincial General Election, June 3, 2003 (PDF) (Report). Winnipeg: Elections Manitoba. | ||||||||
2007
| 2007 Manitoba general election | ||||||||
|---|---|---|---|---|---|---|---|---|
| Party | Candidate | Votes | % | ±% | Expenditures | |||
| New Democratic | Jennifer Howard | 3,828 | 46.97 | -10.67 | $25.968.04 | |||
| Liberal | Paul Hesse | 2,488 | 30.53 | 13.56 | $23,866.84 | |||
| Progressive Conservative | Christine Waddell | 1,202 | 14.75 | -4.97 | $11,369.89 | |||
| Green | Gerald H. Enns | 511 | 6.27 | 1.30 | $905.51 | |||
| Independent | Ron Nash | 92 | 1.13 | – | $261.98 | |||
| Communist | Frank Komarniski | 29 | 0.36 | – | ||||
| Total valid votes | 8,150 | – | – | |||||
| Rejected | 53 | – | ||||||
| Eligible voters / turnout | 13,169 | 62.29 | 7.64 | |||||
Source(s)
Source: Manitoba. Chief Electoral Officer (2007). Statement of Votes for the 39th Provincial General Election, May 22, 2007 (PDF) (Report). Winnipeg: Elections Manitoba. | ||||||||
2011
| 2011 Manitoba general election | ||||||||
|---|---|---|---|---|---|---|---|---|
| Party | Candidate | Votes | % | ±% | Expenditures | |||
| New Democratic | Jennifer Howard | 4,501 | 51.26 | 4.29 | $28,361.23 | |||
| Liberal | Paul Hesse | 2,031 | 23.13 | -7.40 | $31,673.03 | |||
| Progressive Conservative | Sonny Dominique | 1,770 | 20.16 | 5.41 | $17,369.18 | |||
| Green | Stephen Weedon | 478 | 5.44 | -0.83 | $24.14 | |||
| Total valid votes | 8,780 | – | – | |||||
| Rejected | 54 | – | ||||||
| Eligible voters / turnout | 14,429 | 61.22 | -1.07 | |||||
Source(s)
Source: Manitoba. Chief Electoral Officer (2011). Statement of Votes for the 40th Provincial General Election, October 4, 2011 (PDF) (Report). Winnipeg: Elections Manitoba. "Election Returns: 40th General Election". Elections Manitoba. 2011. Retrieved September 12, 2018. | ||||||||
2016
| 2016 Manitoba general election | ||||||||
|---|---|---|---|---|---|---|---|---|
| Party | Candidate | Votes | % | ±% | Expenditures | |||
| New Democratic | Wab Kinew | 3,360 | 37.63 | -13.63 | $39,199.49 | |||
| Progressive Conservative | Audrey Gordon | 2,571 | 28.80 | 8.64 | $42,245.54 | |||
| Liberal | Rana Bokhari | 1,792 | 20.07 | -3.06 | $30,238.82 | |||
| Green | Grant Sharp | 983 | 11.01 | 5.57 | $322.90 | |||
| Manitoba | Matthew Ostrove | 175 | 1.96 | – | $945.26 | |||
| Communist | Paula Ducharme | 47 | 0.53 | – | $33.67 | |||
| Total valid votes / expense limit | 8,928 | – | – | $44,855.00 | ||||
| Rejected | 125 | – | ||||||
| Eligible voters / Turnout | 13,896 | 65.15 | 3.92 | |||||
| New Democratic hold | Swing | –11.04 | ||||||
Source(s)
Source: Manitoba. Chief Electoral Officer (2016). Statement of Votes for the 41st Provincial General Election, April 19, 2016 (PDF) (Report). Winnipeg: Elections Manitoba. "Election Returns: 41st General Election". Elections Manitoba. 2016. Retrieved September 10, 2018. | ||||||||
2019
| 2019 Manitoba general election | ||||||||
|---|---|---|---|---|---|---|---|---|
| Party | Candidate | Votes | % | ±% | Expenditures | |||
| New Democratic | Wab Kinew | 5,055 | 51.24 | 13.60 | $23,922.64 | |||
| Progressive Conservative | Edna Nabess | 1,857 | 18.82 | -9.97 | $7,290.07 | |||
| Green | James Beddome | 1,580 | 16.01 | 5.00 | $8,974.33 | |||
| Liberal | Cyndy Friesen | 1,290 | 13.08 | -7.00 | $8,223.63 | |||
| Manitoba First | Michael McCracken | 54 | 0.55 | -1.41 | $582.58 | |||
| Manitoba Forward | Bradley Hebert | 30 | 0.30 | – | $0.00 | |||
| Total valid votes | 9,866 | – | – | |||||
| Rejected | 47 | – | ||||||
| Eligible voters / Turnout | 16,870 | 58.76 | -6.39 | |||||
Source(s)
Source: Manitoba. Chief Electoral Officer (2019). Statement of Votes for the 42nd Provincial General Election, September 10, 2019 (PDF) (Report). Winnipeg: Elections Manitoba. "Candidate Election Returns". Elections Manitoba. Elections Manitoba. Retrieved March 2, 2020. | ||||||||
2023
| 2023 Manitoba general election | ||||||||
|---|---|---|---|---|---|---|---|---|
| ** Preliminary results — Not yet official ** | ||||||||
| Party | Candidate | Votes | % | ±% | Expenditures | |||
| New Democratic | Wab Kinew | 6,759 | 70.62 | +19.38 | ||||
| Progressive Conservative | Rejeanne Caron | 1,562 | 16.32 | -2.50 | ||||
| Liberal | Katherine Johnson | 1,149 | 12.01 | -1.07 | ||||
| Communist | Robert Crooks | 101 | 1.06 | – | ||||
| Total valid votes/Expense limit | 9,571 | 99.49 | ||||||
| Total rejected, unmarked and declined ballots | 49 | 0.51 | ||||||
| Turnout | 9,620 | 58.65 | -0.11 | |||||
| Eligible voters | 16,401 | |||||||
| New Democratic hold | Swing | +10.94 | ||||||
Source(s)
Source: "2023 Election Results Map". Elections Manitoba. October 3, 2023. Retrieved October 6, 2023. | ||||||||
Previous boundaries
References
- ^ CBC "2015 federal election: How did your Manitoba neighbours vote?" 2 March 2016
49°52′23″N 97°08′49″W / 49.873°N 97.147°W