
| Year | Results | |||||||
|---|---|---|---|---|---|---|---|---|
| 2021 | ||||||||
| 2019 | ||||||||
| 2015 | ||||||||
| 2011 | ||||||||
| 2008 | ||||||||
| 2006 | ||||||||
| 2004 | ||||||||
| 2000 | ||||||||
| 1997 | ||||||||
| 1993 | ||||||||
| 1988 | ||||||||
| 1984 | ||||||||
| 1980 | ||||||||
| 1979 | ||||||||
| 1974 | ||||||||
| 1972 | ||||||||
| 1968 | ||||||||
| 1965 | ||||||||
| 1963 | ||||||||
| 1962 | ||||||||
| 1958 | ||||||||
| 1957 | ||||||||
| 1953 | ||||||||
| 1949 | ||||||||
| 1945 | ||||||||
| 1940 | ||||||||
| 1935 | ||||||||
| 1930 | ||||||||
| 1926 | ||||||||
| 1925 |
Canadian federal elections have provided the following results in Eastern Montreal.
Regional profile
The eastern end of the Island of Montreal was the birthplace of the sovereigntist movement, and remained a sovereigntist stronghold for four decades. During this time, whenever the Parti Québécois won provincially, the entire eastern half of the island was coated light blue. Federally, it was the Bloc Québécois's power base from 1993 to 2011, partly due to its leftist bent. With the exception of ethnic areas that protrude from Northern Montreal into the East Island's Honoré-Mercier riding, where Liberal support is strong, the area is relatively homogeneously Francophone and lower-income, a recipe for Bloc dominance. Prior to the rise of the Bloc, the region voted solidly Liberal for decades before being swept up in the Brian Mulroney tide, electing Quebec nationalists under the Progressive Conservative banner. The Conservative Party of Canada has never approached this level of support, and eastern Montreal is currently the weakest region in Canada for the Tories. In 2011, the federalist NDP swept every seat in this region amid the surge of popular support in the province and the concurrent Bloc meltdown, in all but one case by well over 6,000 votes. The NDP surge even cost longtime Bloc leader Gilles Duceppe his seat in Laurier-Sainte-Marie.
The NDP largely held its gains in 2015, losing Honoré-Mercier to the Liberals and La Pointe-de-l'Île—long reckoned as the most strongly sovereigntist riding in Quebec—to the Bloc. However, Duceppe came up well short in his bid to retake his old riding. In 2019, however, the NDP was cut down to just one riding in eastern Montreal, with the Bloc holding onto La Pointe-de-l'Île and the Liberals taking the other three.
Votes by party throughout time
| Election | Liberal | Conservative | New Democratic | Bloc Québécois | Green | PC | Reform / Alliance |
Others |
|---|---|---|---|---|---|---|---|---|
| 1979 | 143,504 63.6% |
— | 12,062 5.3% |
— | No candidate | 26,108 11.6% |
— | 44,015 19.5% |
| 1980 | 139,703 71.5% |
— | 19,492 10.0% |
— | No candidate | 15,791 8.1% |
— | 20,352 10.4% |
| 1984 | 101,692 40.1% |
— | 28,336 11.2% |
— | 720 0.3% |
108,910 42.9% |
— | 14,220 5.6% |
| 1988 | 73,696 31.1% |
— | 43,512 18.4% |
— | 4,838 2.0% |
103,741 43.8% |
— | 11,218 4.7% |
| 1993 | 70,938 28.6% |
— | 4,917 2.0% |
139,534 56.3% |
1,050 0.4% |
18,013 7.3% |
No candidate | 13,344 5.4% |
| 1997 | 81,664 33.3% |
— | 6,166 2.5% |
113,000 46.1% |
1,167 0.5% |
39,023 15.9% |
No candidate | 4,202 1.7% |
| 2000 | 87,196 37.8% |
— | 5,409 2.3% |
107,547 46.6% |
5,457 2.5% |
9,352 4.1% |
7,115 3.9% |
8,143 3.5% |
| 2004 | 64,554 27.1% |
9,504 4.0% |
15,889 6.7% |
137,602 57.7% |
8,456 3.5% |
Merged into Conservative Party |
2,445 1.0% | |
| 2006 | 48,763 19.7% |
29,968 12.1% |
24,915 10.1% |
128,926 52.1% |
12,802 5.2% |
1,886 0.8% | ||
| 2008 | 56,936 23.5% |
23,126 9.6% |
34,340 14.2% |
113,999 47.1% |
10,791 4.5% |
2,647 1.1% | ||
| 2011 | 33,970 13.8% |
16,874 6.9% |
113,749 46.2% |
67,596 30.3% |
4,689 1.9% |
2,375 1.0% | ||
| 2015 | 85,528 31.6% |
18,941 7.0% |
88,890 32.9% |
67,596 25.0% |
7,285 2.7% |
2,260 0.8% | ||
| 2019 | 101,331 37.2% |
14,082 5.2% |
60,666 22.3% |
80,163 29.4% |
12,665 4.6% |
3,642 1.3% | ||
| 2021 | 93,437 37.9% |
14,433 5.8% |
59,602 24.1% |
67,697 27.4% |
3,999 1.6% |
7,691 3.1% | ||

Detailed results
2021
Seats won/lost by party
All incumbents MP were reelected.
Party rankings
No change in position for the four main parties. The People's Party arrives before the Green Party in 2 of the 3 ridings where both parties had candidates.
| Parties | 1st | 2nd | 3rd | 4th | 5th | 6th | |
|---|---|---|---|---|---|---|---|
| Liberal | 3 | 2 | 0 | 0 | 0 | 0 | |
| Bloc Québécois | 1 | 2 | 2 | 0 | 0 | 0 | |
| New Democratic | 1 | 1 | 2 | 1 | 0 | 0 | |
| Conservative | 0 | 0 | 1 | 4 | 0 | 0 | |
| People's | 0 | 0 | 0 | 0 | 3 | 1 | |
| Green | 0 | 0 | 0 | 0 | 2 | 2 | |
Results by riding
| Electoral district | Candidates | Incumbent | ||||||||||||||||
|---|---|---|---|---|---|---|---|---|---|---|---|---|---|---|---|---|---|---|
| Liberal | Conservative | BQ | NDP | Green | PPC | Marxist-Leninist | Other | |||||||||||
| Hochelaga | Soraya Martinez Ferrada 18,197 38.14% |
Aime Calle Cabrera 2,221 4.66% |
Simon Marchand 15,089 31.63% |
Catheryn Roy-Goyette 9,723 20.38% |
Zachary Lavarenne 965 2.02% |
Marc-André Doucet-Beauchamp 1,081 2.27% |
Christine Dandenault 84 0.18% |
Michelle Paquette (Comm.) 108 0.23% |
Soraya Martinez Ferrada | |||||||||
| Alan Smithee (Rhino.) 238 0.50% | ||||||||||||||||||
| Honoré-Mercier | Pablo Rodriguez 29,033 59.97% |
Guy Croteau 5,086 10.51% |
Charlotte Lévesque-Marin 7,908 16.34% |
Paulina Ayala 3,537 7.31% |
Bianca Deltorto-Russell 734 1.52% |
Lucilia Miranda 2,023 4.18% |
Yves Le Seigle 88 0.18% |
Pablo Rodríguez | ||||||||||
| La Pointe-de-l'Île | Jonas Fadeu 16,508 32.32% |
Massimo Anania 3,427 6.71% |
Mario Beaulieu 23,835 46.66% |
Alexandre Vallerand 4,954 9.70% |
Jonathan Desclin 1,399 2.74% |
Genevieve Royer 159 0.31% |
Agnès Falquet (FPC) 577 1.13% |
Mario Beaulieu | ||||||||||
| Charles Phillippe Gervais (PIQ) 221 0.43% | ||||||||||||||||||
| Laurier—Sainte-Marie | Steven Guilbeault 16,961 37.96% |
Ronan Reich 1,500 3.36% |
Marie-Eve-Lyne Michel 9,114 20.40% |
Nimâ Machouf 14,680 32.86% |
Jean-Michel Lavarenne 992 2.22% |
Daniel Tanguay 758 1.70% |
Serge Lachapelle 70 0.16% |
Cyril Julien (Ind.) 74 0.17% |
Steven Guilbeault | |||||||||
| Kimberly Lamontagne (Animal) 199 0.45% | ||||||||||||||||||
| Julie Morin (FPC) 233 0.52% | ||||||||||||||||||
| Adrien Welsh (Comm.) 95 0.21% | ||||||||||||||||||
| Rosemont—La Petite-Patrie | Nancy Drolet 12,738 23.17% |
Surelys Perez Hernandez 2,199 4.00% |
Shophika Vaithyanathasarma 11,751 21.37% |
Alexandre Boulerice 26,708 48.57% |
Franco Fiori 1,308 2.38% |
Gisèle Desrochers 284 0.52% |
Alexandre Boulerice | |||||||||||
2019
Seats won/lost by party
| Party | 2015 | Gain from (loss to) | 2019 | ||||||
|---|---|---|---|---|---|---|---|---|---|
| Lib. | Bloc | NDP | |||||||
| New Democratic | 3 | 0 | –2 | 0 | 0 | — | 1 | ||
| Bloc Québécois | 1 | 0 | 0 | — | 0 | 0 | 1 | ||
| Liberal | 1 | — | 0 | 0 | +2 | 0 | 3 | ||
Party rankings
The Liberal improve their position, winning a majority of the ridings for the first time since 1980. The Bloc overtakes the NDP as the second main party in the region with more second place. The Conservatives obtain a 3rd place in Honoré-Mercier ahead of the NDP who obtains its first 4th place since 2008.
| Parties | 1st | 2nd | 3rd | 4th | 5th | |
|---|---|---|---|---|---|---|
| Liberal | 3 | 2 | 0 | 0 | 0 | |
| Bloc Québécois | 1 | 2 | 2 | 0 | 0 | |
| New Democratic | 1 | 1 | 2 | 1 | 0 | |
| Conservative | 0 | 0 | 1 | 4 | 0 | |
| Green | 0 | 0 | 0 | 0 | 4 | |
Results by riding
| Electoral district | Candidates | Incumbent | ||||||||||||||||
|---|---|---|---|---|---|---|---|---|---|---|---|---|---|---|---|---|---|---|
| Liberal | Conservative | BQ | NDP | Green | PPC | Marxist-Leninist | Other | |||||||||||
| Hochelaga | Soraya Martinez Ferrada 18,008 33.95% |
Christine Marcoux 2,381 4.49% |
Simon Marchand 17,680 33.34% |
Catheryn Roy-Goyette 11,451 21.59% |
Robert D. Morais 2,618 4.94% |
Stepan Balatsko 377 0.71% |
Christine Dandenault 101 0.19% |
Chinook Blais-Leduc (Rhino.) 314 0.59% JP Fortin (Comm.) 107 0.20% |
Marjolaine Boutin-Sweet | |||||||||
| Honoré-Mercier | Pablo Rodriguez 29,543 58.66% |
Guy Croteau 4,808 9.55% |
Jacques Binette 9,979 19.81% |
Chu Anh Pham 4,130 8.20% |
Domenico Cusmano 1,373 2.73% |
Patrick St-Onge 459 0.91% |
Yves Le Seigle 71 0.14% |
Pablo Rodríguez | ||||||||||
| La Pointe-de-l'Île | Jonathan Plamondon 16,898 30.4% |
Robert Coutu 3,984 7.2% |
Mario Beaulieu 26,010 46.8% |
Ève Péclet 6,057 10.9% |
Franco Fiori 1,910 3.4% |
Randy Manseau 388 0.7% |
Geneviève Royer 88 0.2% |
Jacinthe Lafrenaye (PIQ) 199 0.4% |
Mario Beaulieu | |||||||||
| Laurier—Sainte-Marie | Steven Guilbeault 22,306 41.77% |
Lise des Greniers 1,504 2.82% |
Michel Duchesne 12,188 22.82% |
Nimâ Machouf 13,453 25.19% |
Jamil Azzaoui 3,225 6.04% |
Christine Bui 320 0.60% |
Serge Lachapelle 98 0.18% |
Archie Morals (Rhino.) 208 0.39% Adrien Welsh (Comm.) 67 0.13% Dimitri Mourkes (Ind.) 42 0.08% |
Hélène Laverdière | |||||||||
| Rosemont—La Petite-Patrie | Geneviève Hinse 14,576 24.21% |
Johanna Sarfati 1,405 2.33% |
Claude André 14,306 23.76% |
Alexandre Boulerice 25,575 42.48% |
Jean Désy 3,539 5.88% |
Bobby Pellerin 293 0.49% |
Gisèle Desrochers 80 0.13% |
Jos Guitare Lavoie (Rhino.) 346 0.57% Normand Raymond (Comm.) 86 0.14% |
Alexandre Boulerice | |||||||||
2015
Seats won/lost by party
| Party | 2011 | Gain from (loss to) | 2015 | ||||||
|---|---|---|---|---|---|---|---|---|---|
| Lib. | Bloc | NDP | |||||||
| New Democratic | 5 | 0 | –1 | 0 | –1 | — | 3 | ||
| Bloc Québécois | 0 | 0 | 0 | — | +1 | 0 | 1 | ||
| Liberal | 0 | — | 0 | 0 | +1 | 0 | 1 | ||
Party rankings
The election is much more competitive than previously, with multiple 2nd and 3rd place ranking for both the NDP, the Liberals and the Bloc. The Conservatives are 4th in all 5 ridings as they did in 2011.
| Parties | 1st | 2nd | 3rd | 4th | 5th | |
|---|---|---|---|---|---|---|
| New Democratic | 3 | 1 | 1 | 0 | 0 | |
| Liberal | 1 | 2 | 2 | 0 | 0 | |
| Bloc Québécois | 1 | 2 | 2 | 0 | 0 | |
| Conservative | 0 | 0 | 0 | 5 | 0 | |
| Green | 0 | 0 | 0 | 0 | 5 | |
Results by riding
| Electoral district | Candidates | Incumbent | ||||||||||||||||
|---|---|---|---|---|---|---|---|---|---|---|---|---|---|---|---|---|---|---|
| Conservative | NDP | Liberal | BQ | Green | Marxist-Leninist | Rhinoceros | Other | |||||||||||
| Hochelaga (judicial recount) |
Alexandre Dang 3,555 6.85% |
Marjolaine Boutin-Sweet 16,034 30.89% |
Marwah Rizqy 15,534 29.93% |
Simon Marchand 14,389 27.72% |
Anne-Marie Saint-Cerny 1,654 3.19% |
Christine Dandenault 148 0.29% |
Nicolas Lemay 411 0.79% |
Marianne Breton Fontaine (Comm.) 179 0.34% |
Marjolaine Boutin-Sweet | |||||||||
| Honoré-Mercier | Guy Croteau 6,226 12.05% |
Paulina Ayala 8,478 16.41% |
Pablo Rodriguez 29,211 56.55% |
Audrey Beauséjour 6,680 12.93% |
Angela Budilean 814 1.58% |
Yves Le Seigle 81 0.16% |
Dayana Dejean (SD) 168 0.33% |
Paulina Ayala | ||||||||||
| La Pointe-de-l'Île | Guy Morissette 4,408 7.98% |
Ève Péclet 14,777 26.76% |
Marie-Chantale Simard 15,777 28.57% |
Mario Beaulieu 18,545 33.58% |
David J. Cox 1,130 2.05% |
Geneviève Royer 96 0.17% |
Ben 97 Benoit 358 0.65% |
Jean-François Larose (SD) 135 0.24% |
Ève Péclet | |||||||||
| Laurier—Sainte-Marie | Daniel Gaudreau 2,242 4.10% |
Hélène Laverdière 20,929 38.27% |
Christine Poirier 12,938 23.66% |
Gilles Duceppe 15,699 28.71% |
Cyrille Giraud 1,904 3.48% |
Serge Lachapelle 103 0.19% |
Stéphane Beaulieu (Libert.) 604 1.10% |
Hélène Laverdière | ||||||||||
| Julien Bernatchez (Ind.) 160 0.29% | ||||||||||||||||||
| Pierre Fontaine (Comm.) 102 0.19% | ||||||||||||||||||
| Rosemont—La Petite-Patrie | Jeremy Dohan 2,510 4.30% |
Alexandre Boulerice 28,672 49.15% |
Nadine Medawar 12,068 20.69% |
Claude André 12,283 21.06% |
Sameer Muldeen 1,783 3.06% |
Stéphane Chénier 171 0.29% |
Laurent Aglat 495 0.85% |
Peter d'Entremont (Libert.) 353 0.61% |
Alexandre Boulerice | |||||||||
2011
Seats won/lost by party
| Party | 2008 | Gain from (loss to) | 2011 | ||||||
|---|---|---|---|---|---|---|---|---|---|
| Lib. | Bloc | NDP | |||||||
| Bloc Québécois | 4 | 0 | 0 | — | 0 | –4 | 0 | ||
| Liberal | 1 | — | 0 | 0 | 0 | –1 | 0 | ||
| New Democratic | 0 | +1 | 0 | +3 | 0 | — | 5 | ||
Party rankings
The NDP surge results in a sweep of the region, with the Bloc and Liberals arriving in 2nd place in their former ridings.
| Parties | 1st | 2nd | 3rd | 4th | 5th | |
|---|---|---|---|---|---|---|
| New Democratic | 5 | 0 | 0 | 0 | 0 | |
| Bloc Québécois | 0 | 4 | 1 | 0 | 0 | |
| Liberal | 0 | 1 | 4 | 0 | 0 | |
| Conservative | 0 | 0 | 0 | 5 | 0 | |
| Green | 0 | 0 | 0 | 0 | 5 | |
Results by riding
| Electoral district | Candidates | Incumbent | ||||||||||||||||
|---|---|---|---|---|---|---|---|---|---|---|---|---|---|---|---|---|---|---|
| BQ | Conservative | Liberal | NDP | Green | Marxist-Leninist | Rhinoceros | Other | |||||||||||
| Hochelaga | Daniel Paillé 14,451 31.20% |
Audrey Castonguay 3,126 6.75% |
Gilbert Thibodeau 5,064 10.93% |
Marjolaine Boutin-Sweet 22,314 48.17% |
Yaneisy Delgado Dihigo 798 1.72% |
Christine Dandenault 143 0.31% |
Hugo Samson Veillette (Rhino) 246 0.53% |
Marianne Breton Fontaine (Comm.) 180 0.39% |
Daniel Paillé | |||||||||
| Honoré-Mercier | Martin Laroche 8,935 18.52% |
Gérard Labelle 5,992 12.42% |
Pablo Rodriguez 14,641 30.35% |
Paulina Ayala 17,545 36.37% |
Gaëtan Bérard 770 1.60% |
Jean-Paul Bédard 170 0.35% |
Valery Chevrefils-Latulippe 181 0.38% |
Pablo Rodriguez | ||||||||||
| La Pointe-de-l'Île | Ginette Beaudry 15,475 32.48% |
Mathieu Drolet 3,664 7.69% |
Olivier L. Coulombe 4,369 9.17% |
Ève Péclet 23,033 48.34% |
David J. Cox 898 1.88% |
Claude Brunelle 213 0.45% |
Francine Lalonde† | |||||||||||
| Laurier—Sainte-Marie | Gilles Duceppe 17,991 35.90% |
Charles K. Langford 1,764 3.52% |
Philippe Allard 4,976 9.93% |
Hélène Laverdière 23,373 46.64% |
Olivier Adam 1,324 2.64% |
Serge Lachapelle 77 0.15% |
François Yo Gourd 398 0.79% |
Sylvain Archambault (Comm.) 137 0.27% |
Gilles Duceppe | |||||||||
| Dimitri Mourkes (Ind.) 73 0.15% | ||||||||||||||||||
| Rosemont—La Petite-Patrie | Bernard Bigras 17,702 32.85% |
Sébastien Forté 2,328 4.32% |
Kettly Beauregard 4,920 9.13% |
Alexandre Boulerice 27,484 51.00% |
Sameer Muldeen 899 1.67% |
Stéphane Chénier 140 0.26% |
Jean-Patrick Berthiaume 417 0.77% |
Bernard Bigras | ||||||||||
2008
Seats won/lost by party
| Party | 2006 | Gain from (loss to) | 2008 | ||||
|---|---|---|---|---|---|---|---|
| Lib. | Bloc | ||||||
| Bloc Québécois | 4 | 0 | 0 | — | 4 | ||
| Liberal | 1 | — | 0 | 0 | 1 | ||
Party rankings
The Liberal vote strengthened since the 2006 election with a 2nd place achieved in all 4 ridings where the Bloc won (very much like in 2000 and 2004). The NDP overtakes the Conservatives for the main third party whereas the Green again arrives in 4th place, ahead of the Conservatives, in Laurier—Sainte-Marie.
| Parties | 1st | 2nd | 3rd | 4th | 5th | |
|---|---|---|---|---|---|---|
| Bloc Québécois | 4 | 1 | 0 | 0 | 0 | |
| Liberal | 1 | 4 | 0 | 0 | 0 | |
| New Democratic | 0 | 0 | 4 | 1 | 0 | |
| Conservative | 0 | 0 | 1 | 3 | 1 | |
| Green | 0 | 0 | 0 | 1 | 4 | |
Results by riding
| Electoral district | Candidates | Incumbent | ||||||||||||||||
|---|---|---|---|---|---|---|---|---|---|---|---|---|---|---|---|---|---|---|
| BQ | Conservative | Liberal | NDP | Green | Marxist-Leninist | Rhinoceros | Other | |||||||||||
| Hochelaga | Réal Ménard 22,720 49.73% |
Luc Labbé 4,201 9.20% |
Diane Dicaire 9,442 20.67% |
Jean-Claude Rocheleau 6,600 14.45% |
Philippe Larochelle 1,946 4.26% |
Christine Dandenault 177 0.39% |
Simon Landry 230 0.50% |
Marianne Breton-Fontaine (Comm.) 184 0.40% |
Réal Ménard | |||||||||
| Blair T. Longley (Mar.) 183 0.40% | ||||||||||||||||||
| Honoré-Mercier | Gérard Labelle 13,871 28.12% |
Rodrigo Alfaro 7,549 15.30% |
Pablo Rodriguez 21,544 43.67% |
François Pilon 4,986 10.11% |
Gaëtan Bérard 1,380 2.80% |
Pablo Rodriguez | ||||||||||||
| La Pointe-de-l'Île | Francine Lalonde 25,976 56.09% |
Hubert Pichet 5,179 11.18% |
Oumy Sarr 7,403 15.99% |
Isabelle Maguire 5,975 12.90% |
Domita Cundari 1,340 2.89% |
Claude Brunelle 177 0.38% |
Ben 97 Benoit 261 0.56% |
Francine Lalonde | ||||||||||
| Laurier—Sainte-Marie | Gilles Duceppe 24,103 50.24% |
Charles K. Langford 2,320 4.84% |
Sébastien Caron 8,798 18.34% |
François Grégoire 8,209 17.11% |
Dylan Perceval-Maxwell 3,801 7.92% |
Serge Lachapelle 118 0.25% |
François Yo Gourd 447 0.93% |
Daniel "F4J" Laforest (Ind.) 93 0.19% |
Gilles Duceppe | |||||||||
| Samie Pagé-Quirion (Comm.) 86 0.18% | ||||||||||||||||||
| Rosemont—La Petite-Patrie | Bernard Bigras 27,260 52.00% |
Sylvie Boulianne 3,876 7.39% |
Marjorie Théodore 9,785 18.67% |
Alexandre Boulerice 8,522 16.26% |
Vincent Larochelle 2,406 4.59% |
Stéphane Chénier 170 0.32% |
Jean-Patrick Berthiaume 319 0.61% |
Michel Dugré (NA) 83 0.16% |
Bernard Bigras | |||||||||
2006
Seats won/lost by party
| Party | 2004 | Gain from (loss to) | 2006 | ||||
|---|---|---|---|---|---|---|---|
| Lib. | Bloc | ||||||
| Bloc Québécois | 4 | 0 | 0 | — | 4 | ||
| Liberal | 1 | — | 0 | 0 | 1 | ||
Party rankings
Both the NDP and the Conservatives improves their results with a second place for both, achieved respectively in Laurier—Sainte-Marie in La Pointe-de-l'Île, albeit well behind the Bloc in both cases. They were able to overtake the Liberal Party who arrived third in both ridings. The Green Party arrived fourth, ahead of the Conservatives, in Laurier—Sainte-Marie.
| Parties | 1st | 2nd | 3rd | 4th | 5th | |
|---|---|---|---|---|---|---|
| Bloc Québécois | 4 | 1 | 0 | 0 | 0 | |
| Liberal | 1 | 2 | 2 | 0 | 0 | |
| Conservative | 0 | 1 | 2 | 1 | 1 | |
| New Democratic | 0 | 1 | 1 | 3 | 0 | |
| Green | 0 | 0 | 0 | 1 | 4 | |
Results by riding
| Electoral district | Candidates | Incumbent | ||||||||||||||||
|---|---|---|---|---|---|---|---|---|---|---|---|---|---|---|---|---|---|---|
| BQ | Liberal | Conservative | NDP | Green | Marijuana | Marxist-Leninist | Other | |||||||||||
| Hochelaga | Réal Ménard 25,570 55.58% |
Vicky Harvey 7,932 17.24% |
Audrey Castonguay 5,617 12.21% |
David-Roger Gagnon 4,101 8.91% |
Rolf Bramann 2,235 4.86% |
Blair T. Longley 332 0.72% |
Christine Dandenault 220 0.48% |
Réal Ménard | ||||||||||
| Honoré-Mercier | Gérard Labelle 17,879 34.83% |
Pablo Rodriguez 19,622 38.23% |
Angelo M. Marino 8,952 17.44% |
François Pilon 3,191 6.22% |
Sylvain Castonguay 1,502 2.93% |
Hélène Héroux 183 0.36% |
Pablo Rodriguez | |||||||||||
| La Pointe-de-l'Île | Francine Lalonde 29,368 60.46% |
Marie-Migniaud Dominique 6,855 14.11% |
Christian Prévost 7,402 15.24% |
Nicolas Tremblay 3,407 7.01% |
Benjamin Rankin 1,544 3.18% |
Francine Lalonde | ||||||||||||
| Laurier—Sainte-Marie | Gilles Duceppe 26,773 54.69% |
Soeung Tang 6,095 12.45% |
Carlos De Sousa 3,124 6.38% |
François Grégoire 8,165 16.68% |
Dylan Perceval-Maxwell 4,064 8.30% |
Nicky Tanguay 338 0.69% |
Ginette Boutet 137 0.28% |
Jocelyne Leduc (Ind.) 157 0.32% |
Gilles Duceppe Laurier | |||||||||
| Evelyn Elizabeth Ruiz (Comm.) 100 0.20% | ||||||||||||||||||
| Rosemont—La Petite-Patrie | Bernard Bigras 29,336 55.99% |
Suzanne Harvey 8,259 15.76% |
Michel Sauvé 4,873 9.30% |
Chantal Reeves 6,051 11.55% |
Marc-André Gadoury 3,457 6.60% |
Hugô St-Onge 419 0.80% |
Bernard Bigras | |||||||||||
2004
Seats won/lost by party
| Party | 2000 | Gain from (loss to) | 2004 | ||||
|---|---|---|---|---|---|---|---|
| Lib. | Bloc | ||||||
| Bloc Québécois | 4 | 0 | 0 | — | 4 | ||
| Liberal | 1 | — | 0 | 0 | 1 | ||
Party rankings
The NDP greatly improves its results with three 3rd places, being the main third party in the region, behind the Bloc and the Liberals. The Green overtakes the Conservatives in two ridings (Laurier and Rosemont—La Petite-Patrie).
| Parties | 1st | 2nd | 3rd | 4th | 5th | |
|---|---|---|---|---|---|---|
| Bloc Québécois | 4 | 1 | 0 | 0 | 0 | |
| Liberal | 1 | 4 | 0 | 0 | 0 | |
| New Democratic | 0 | 0 | 3 | 2 | 0 | |
| Conservative | 0 | 0 | 2 | 1 | 2 | |
| Green | 0 | 0 | 0 | 2 | 3 | |
Results by riding
| Electoral district | Candidates | Incumbent | ||||||||||||||||
|---|---|---|---|---|---|---|---|---|---|---|---|---|---|---|---|---|---|---|
| Liberal | BQ | Conservative | NDP | Green | Marijuana | Marxist-Leninist | Communist | |||||||||||
| Hochelaga | Benoit Bouvier 11,712 25.63% |
Réal Ménard 27,476 60.12% |
Mario Bernier 1,856 4.06% |
David Gagnon 2,510 5.49% |
Rolf Bramann 1,361 2.98% |
Antoine Théorêt-Poupart 482 1.05% |
Christine Dandenault 112 0.25% |
Pierre Bibeau 190 0.42% |
Réal Ménard Hochelaga—Maisonneuve | |||||||||
| Honoré-Mercier | Pablo Rodriguez 22,223 46.10% |
Éric St-Hilaire 19,461 40.37% |
Gianni Chiazzese 2,902 6.02% |
François Pilon 1,973 4.09% |
Richard Lahaie 852 1.77% |
Steve Boudrias 626 1.30% |
Hélène Héroux 164 0.34% |
Yvon Charbonneau† Anjou—Rivières-des-Prairies | ||||||||||
| La Pointe-de-l'Île | Jean-Claude Gobé 10,593 22.93% |
Francine Lalonde 30,713 66.47% |
Christian Prevost 1,961 4.24% |
André Langevin 1,751 3.79% |
Andre Levert 1,186 2.57% |
Francine Lalonde Mercier | ||||||||||||
| Laurier | Jean-François Thibault 8,454 17.68% |
Gilles Duceppe 28,728 60.07% |
Pierre Albert 1,224 2.56% |
François Gregoire 5,779 12.08% |
Dylan Perceval-Maxwell 2,912 6.09% |
Nicky Tanguay 572 1.20% |
Ginette Boutet 154 0.32% |
Gilles Duceppe Laurier—Sainte-Marie | ||||||||||
| Rosemont—La Petite-Patrie | Christian Bolduc 11,572 22.90% |
Bernard Bigras 31,224 61.80% |
Michel Sauvé 1,561 3.09% |
Benoît Beauchamp 3,876 7.67% |
François Chevalier 2,145 4.25% |
Kenneth Higham 145 0.29% |
Bernard Bigras Rosemont—Petite-Patrie | |||||||||||
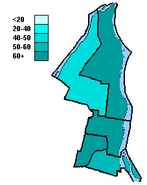
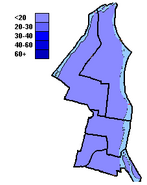
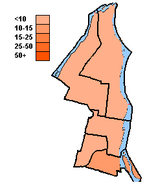
Maps
|
|


2000
Seats won/lost by party
| Party | 1997 | Gain from (loss to) | 2000 | ||||
|---|---|---|---|---|---|---|---|
| Lib. | Bloc | ||||||
| Bloc Québécois | 4 | 0 | 0 | — | 4 | ||
| Liberal | 1 | — | 0 | 0 | 1 | ||
Party rankings
The NDP reaches a low point in the region with only a 5th place in Laurier—Sainte-Marie, its best results. It obtains a 7th place in Mercier, behind all the other major federal parties and the Green and Marijuana parties. The Green Party fares quite well and scores two 3rd places despite only running in 3 of the 5 ridings in the region.
| Parties | 1st | 2nd | 3rd | 4th | 5th | 6th | 7th | |
|---|---|---|---|---|---|---|---|---|
| Bloc Québécois | 4 | 1 | 0 | 0 | 0 | 0 | 0 | |
| Liberal | 1 | 4 | 0 | 0 | 0 | 0 | 0 | |
| Progressive Conservative | 0 | 0 | 3 | 0 | 1 | 1 | 0 | |
| Green | 0 | 0 | 2 | 0 | 1 | 0 | 0 | |
| Alliance | 0 | 0 | 0 | 3 | 0 | 0 | 2 | |
| Marijuana | 0 | 0 | 0 | 2 | 2 | 1 | 0 | |
| New Democratic | 0 | 0 | 0 | 0 | 1 | 3 | 1 | |
Results by riding
| Electoral district | Candidates | Incumbent | ||||||||||||||||
|---|---|---|---|---|---|---|---|---|---|---|---|---|---|---|---|---|---|---|
| BQ | Liberal | Canadian Alliance | NDP | PC | Green | Marijuana | Other | |||||||||||
| Anjou—Rivière-des-Prairies | Jacques Dagenais 14,755 30.35% |
Yvon Charbonneau 28,134 57.86% |
Gianni Chiazzese 2,005 4.12% |
Bruce Whelan 624 1.28% |
Michel Tanguay 2,034 4.18% |
Normand Néron 918 1.89% |
Hélène Héroux (M-L) 151 0.31% |
Yvon Charbonneau | ||||||||||
| Hochelaga—Maisonneuve | Réal Ménard 21,250 49.20% |
Louis Morena 16,143 37.38% |
Stephanie Morency 1,502 3.48% |
Milan Mirich 767 1.78% |
Benoit Harbec 1,751 4.05% |
Alex Néron 1,227 2.84% |
Pierre Bibeau (Comm.) 274 0.63% Christine Dandenault (M-L) 275 0.64% |
Réal Ménard | ||||||||||
| Laurier—Sainte-Marie | Gilles Duceppe 23,473 52.79% |
Jean Philippe Côté 11,451 25.75% |
Stéphane Prud'homme 960 2.16% |
Richard Chartier 2,111 4.75% |
Jean François Tessier 1,879 4.23% |
Dylan Perceval-Maxwell 2,169 4.88% |
Marc-Boris St-Maurice 2,156 4.85% |
Ginette Boutet (M-L) 269 0.60% |
Gilles Duceppe | |||||||||
| Mercier | Francine Lalonde 24,755 52.87% |
Normand Biron 15,416 32.93% |
J. Marc-Antoine Delsoin 1,684 3.60% |
Nicholas Vikander 480 1.03% |
Martin Gelgoot 1,629 3.48% |
Richard Savignac 1,813 3.87% |
Eric Duquette 937 2.00% |
Geneviève Royer (M-L) 104 0.22% |
Francine Lalonde | |||||||||
| Rosemont—Petite-Patrie | Bernard Bigras 23,315 49.13% |
Claude Vigneault 16,052 33.83% |
Etienne Morin 1,354 2.85% |
Noémi Lo Pinto 1,417 2.99% |
Marc Bissonnette 2,006 4.23% |
Sébastien Chagnon-Jean 1,475 3.11% |
Claude Messier (Mar.) 1,486 3.13% |
Joanne Pritchard (NA) 114 0.24% Dorothy Sauras (Comm.) 233 0.49% |
Bernard Bigras Rosemont | |||||||||
1997
Seats won/lost by party
| Party | 1993 | Gain from (loss to) | 1997 | ||||
|---|---|---|---|---|---|---|---|
| Lib. | Bloc | ||||||
| Bloc Québécois | 5 | 0 | –1 | — | 4 | ||
| Liberal | 0 | — | +1 | 0 | 1 | ||
Results by riding
| Electoral district | Candidates | Incumbent | ||||||||||||
|---|---|---|---|---|---|---|---|---|---|---|---|---|---|---|
| BQ | Liberal | NDP | PC | Marxist-Leninist | Other | |||||||||
| Anjou—Rivière-des-Prairies | Roger Pomerleau 16,558 |
Yvon Charbonneau 24,189 |
Elizabeth Lemay Amabili 752 |
Jean Corbeil 9,405 |
Yves Le Seigle 227 |
Roger Pomerleau | ||||||||
| Hochelaga—Maisonneuve | Réal Ménard 21,938 |
Denise Malo 16,308 |
Milan Mirich 825 |
Charles Boudreault 7,583 |
Christine Dandenault 444 |
Richard Lauzon (NLP) 577 |
Réal Ménard | |||||||
| Laurier—Sainte-Marie | Gilles Duceppe 26,542 |
David Ly 11,154 |
François Degardin 2,180 |
Yanick Deschênes 5,808 |
Serge Lachapelle 338 |
François Gourd (Ind.) 1,255 Dylan Perceval-Maxwell (Green) 1,167 Mathieu Ravignat (Ind.) 123 |
Gilles Duceppe | |||||||
| Mercier | Francine Lalonde 24,649 |
René Bourgeault 14,061 |
Cathy Milner 772 |
Eric Champagne 8,500 |
Hélène Héroux 297 |
Francine Lalonde | ||||||||
| Rosemont | Bernard Bigras 23,313 |
Françoise Guidi 15,952 |
Fidel Fuentes 1,637 |
Marc Bissonnette 7,727 |
Claude Brunelle 447 |
Vicky Mercier (Ind.) 494 |
Benoît Tremblay† | |||||||
1993
Seats won/lost by party
| Party | 1988 | Gain from (loss to) | 1993 | ||||||
|---|---|---|---|---|---|---|---|---|---|
| PC | Lib. | Bloc | |||||||
| Progressive Conservative | 4 | — | 0 | 0 | 0 | –4 | 0 | ||
| Liberal | 1 | 0 | 0 | — | 0 | –1 | 0 | ||
| Bloc Québécois | 0 | +4 | 0 | +1 | 0 | — | 5 | ||
Results by riding
| Electoral district | Candidates | Incumbent | ||||||||||||||
|---|---|---|---|---|---|---|---|---|---|---|---|---|---|---|---|---|
| PC | Liberal | NDP | BQ | Commonwealth of Canada | Natural Law | Other | ||||||||||
| Anjou—Rivière-des-Prairies | Jean Corbeil 7,066 |
Normand Biron 25,621 |
Zamba Mandala 956 |
Roger Pomerleau 26,179 |
Frantz-Albert Mitton 139 |
Gilles Raymond 764 |
Jean Corbeil | |||||||||
| Hochelaga—Maisonneuve | Allan Koury 3,838 |
Jules Léger 10,760 |
Paul Vachon 955 |
Réal Ménard 26,052 |
Steve Bélanger 184 |
Richard Lauzon 576 |
Christine Dandenault (M-L) 259 |
Allan Koury | ||||||||
| Laurier—Sainte-Marie | Yvan Routhier 2,136 |
Robert Desbiens 9,854 |
Alain Gravel 1,227 |
Gilles Duceppe 24,755 |
Sophie Brassard 124 |
Pierre Bergeron 643 |
John Tromp (Green) 1,050 Normand Chouinard (M-L) 210 Michel Dugré (Ind.) 130 |
Gilles Duceppe[a] | ||||||||
| Mercier | Gérald Lacoste 2,720 |
Magda Tadros 11,700 |
Guy D'Amours 789 |
Francine Lalonde 34,139 |
Pierre Aylwin 128 |
Carole Jacques (Ind.) 8,992 William-John Apostol (Abol.) 207 |
Carole Jacques[b] | |||||||||
| Rosemont | Pauline Vincent 2,343 |
Pierre Bourque 13,003 |
Roger Lamarr 990 |
Benoît Tremblay 28,409 |
Stéphane Levesque 83 |
Marc Roy 717 |
Hélène Héroux (M-L) 188 |
Benoît Tremblay[c] | ||||||||
1988
Seats won/lost by party
| Party | 1984 | Gain from (loss to) | 1988 | ||||
|---|---|---|---|---|---|---|---|
| PC | Lib. | ||||||
| Progressive Conservative | 4 | — | 0 | 0 | 4 | ||
| Liberal | 2 | 0 | 0 | — | 1[d] | ||
Results by riding
| Electoral district | Candidates | Incumbent | ||||||||||||||||
|---|---|---|---|---|---|---|---|---|---|---|---|---|---|---|---|---|---|---|
| PC | Liberal | NDP | Green | Communist | Rhinoceros | Commonwealth of Canada | Other | |||||||||||
| Anjou—Rivière-des-Prairies | Jean Corbeil 27,451 |
Vincent Arciresi 17,421 |
Vincent Marchione 6,687 |
Mario Paul 1,217 |
Catherine Commandeur (Ind.) 483 |
Michel Gravel Gamelin | ||||||||||||
| Hochelaga—Maisonneuve | Allan Koury 16,246 |
Serge Laprade 14,168 |
Gaétan Nadeau 8,583 |
Marius Henry 800 |
Montserrat Escola 114 |
Marie Chou Chou Chouinard 1,196 |
Sylvain Labelle 122 |
Christiane Robidoux (Ind.) 159 |
Édouard Desrosiers | |||||||||
| Laurier—Sainte-Marie | Charles-André Hamelin 12,113 |
Jean-Claude Malépart 15,956 |
François Beaulne 8,828 |
Philippe Champagne 1,438 |
Marianne Roy 175 |
Sonia Chatouille Coté 2,121 |
Daniel Gonzales 79 |
Hélène Héroux (Ind.) 130 |
David Berger Laurier | |||||||||
| Merged districts | ||||||||||||||||||
| Jean-Claude Malépart Montreal—Sainte-Marie | ||||||||||||||||||
| Mercier | Carole Jacques 30,804 |
Luc Chouinard 12,942 |
André Cordeau 10,251 |
André Cloutier 309 |
Jean-Claude Stardust Gouin 1,617 |
Denise Saint-Louis 137 |
Jean-Pierre Ginchereau (Ind.) 197 |
Carole Jacques Montreal—Mercier | ||||||||||
| Rosemont | Benoît Tremblay 17,127 |
Jacques Guilbault 13,209 |
Giuseppe Sciortino 9,163 |
Sylvain Auclair 1,383 |
Gaétan Trudel 151 |
Christian Nettoyeur Jolicoeur 1,656 |
Christiane Deland-Gervais 120 |
Suzanne Blais-Grenier (Ind.) 2,060 Dollard Desjardins (Social Credit) 148 Arnold August (Ind.) 122 Léo Larocque (Ind.) 122 |
Suzanne Blais-Grenier | |||||||||
1984
Seats won/lost by party
| Party | 1980 | Gain from (loss to) | 1984 | ||||
|---|---|---|---|---|---|---|---|
| PC | Lib. | ||||||
| Liberal | 6 | 0 | –4 | — | 2 | ||
| Progressive Conservative | 0 | — | +4 | 0 | 4 | ||
Results by riding
| Electoral district | Candidates | Incumbent | ||||||||||||||
|---|---|---|---|---|---|---|---|---|---|---|---|---|---|---|---|---|
| PC | Liberal | NDP | Rhinoceros | Parti nationaliste | Commonwealth of Canada | Other | ||||||||||
| Gamelin | Michel Gravel 20,870 |
Lise Thibault 17,491 |
Carl Cyr 4,730 |
Jean-Claude Stardust Gouin 1,659 |
Henriette Martin 1,313 |
Roger Leclerc 96 |
Rolf Bramann (Green) 720 |
Arthur Portelance | ||||||||
| Hochelaga—Maisonneuve | Édouard Desrosiers 13,244 |
Serge Joyal 12,201 |
Marie-Ange Gagnon-Sirois 3,596 |
Richard A. Sirois 1,847 |
Réal Ménard 1,089 |
Daniel Gonzales 63 |
Gaetan Trudel (Comm.) 99 |
Serge Joyal | ||||||||
| Laurier | Roland Gagné 7,720 |
David Berger 9,302 |
Jean-Pierre Juneau 4,595 |
François Yo Gourd 3,247 |
Jean Saint-Amour 906 |
Brian O'Keefe 130 |
Robert Silverman (Green) 751 Gilles Côté (Social Credit) 194 Jean Langevin (PCC) 53 |
David Berger | ||||||||
| Montreal—Mercier | Carole Jacques 25,071 |
Céline Hervieux-Payette 19,335 |
Robert Ferland 4,925 |
Raymond les oreilles Pollender 2,038 |
Gérald Giguère 2,557 |
Michel Destroismaisons 154 |
Céline Hervieux-Payette | |||||||||
| Montreal—Sainte-Marie | François Richard 10,668 |
Jean-Claude Malépart 13,668 |
Lauraine Vaillancourt 3,525 |
André Vaillancourt 990 |
Ghislain Coté 69 |
Jean-Claude Malépart Sainte-Marie | ||||||||||
| Rosemont | Suzanne Blais-Grenier 15,782 |
Antonio Sciascia 14,477 |
Roger J.W.D. Lamarre 4,054 |
Francine Rose Lime Lacasse 1,587 |
Denis Castonguay 1,008 |
André Malboeuf 64 |
Claude Demers (Comm.) 161 Lucien Lapointe (Social Credit) 143 Dollard Desjardins (Ind.) 101 |
Claude-André Lachance | ||||||||
Notes
- ^ Elected as independent candidate in the 1990 by-election. The seat was previously held by Liberal Jean-Claude Malépart who died in office in November 1989. Duceppe sat with the Bloc québécois for the remaining of the Parliament.
- ^ Did not seek reelection.
- ^ Elected as Progressive Conservative in 1988. Left the PC caucus in 1990 and joined the Bloc later that year.
- ^ The riding of Saint-Léonard—Anjou was dissolved into Saint-Léonard, presented in Northern Montreal results