
| Year | Results | ||||||||||||
|---|---|---|---|---|---|---|---|---|---|---|---|---|---|
| 2021 | |||||||||||||
| 2019 | |||||||||||||
| 2015 | |||||||||||||
| 2011 | |||||||||||||
| 2008 | |||||||||||||
| 2006 | |||||||||||||
| 2004 | |||||||||||||
| 2000 | |||||||||||||
| 1997 | |||||||||||||
| 1993 | |||||||||||||
| 1988 | |||||||||||||
| 1984 | |||||||||||||
| 1980 | |||||||||||||
| 1979 | |||||||||||||
| 1974 | |||||||||||||
| 1972 | |||||||||||||
| 1968 | |||||||||||||
| 1965 | |||||||||||||
| 1963 | |||||||||||||
| 1962 | |||||||||||||
| 1958 | |||||||||||||
| 1957 | |||||||||||||
| 1953 | |||||||||||||
| 1949 | |||||||||||||
| 1945 | |||||||||||||
| 1940 | |||||||||||||
| 1935 | |||||||||||||
| 1930 | |||||||||||||
| 1926 | |||||||||||||
| 1925 | |||||||||||||
| 1921 | |||||||||||||
| 1917 | |||||||||||||
| 1911 | |||||||||||||
| 1908 | |||||||||||||
| 1904 |
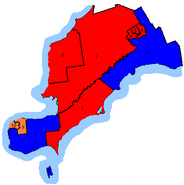
This page lists results of Canadian federal elections in Southwestern Ontario.
YouTube Encyclopedic
-
1/1Views:307
-
Federal Results and the Ontario Campaign
Transcription
Regional profile
Beginning at the start of the 1960s, Southwestern Ontario has traditionally given more support to the Liberals, aside from 1984, although there has always been a pronounced urban-rural split: the New Democrats (NDP) and Liberals are both stronger in Windsor and London, while the rural areas and Sarnia have leaned more towards the Conservatives due to their social conservative bent. The Liberals swept all the ridings in the region in 1993, 1997 and 2000, save one NDP win in 2000.
However, in the 2004, 2006, 2008 and 2011 elections, the entire region, incrementally swung away from the Liberals to support the Conservatives, including in London, where three-way vote-splitting resulted in two ridings switching from Liberal to Conservative. The loss of the second one, London North Centre, in the 2011 election, left the Liberals without any seats in Southwestern Ontario for the first time since Confederation. The exception to Conservative swing was in one London riding, London-Fanshawe, and in Windsor's two ridings, which remained with the NDP from 2006 right through the 2015 election.
In 2015, Southwestern Ontario's election results did not at all mirror the overall federal election results. The Liberals managed to take back two seats in the entire Region, both in London, but the NDP added a seat adjacent to Windsor, Essex, and the Conservatives retained four seats, three rural and also Sarnia-Lambton. The 2019 election saw the NDP lose two of the three Windsor area seats it held before the election, with one of each going to the Conservatives and the Liberals. This election also saw increased regional polarization, with all seats in urban London and Windsor being won by the Liberals or the NDP, and all other seats being won by the Conservatives.
Votes by party throughout time
| Election | Liberal | Conservative | New Democratic | Green | People's | PC | Reform / Alliance |
Others |
|---|---|---|---|---|---|---|---|---|
| 1979 | 174,830 40.0% |
— | 101,849 23.3% |
— | — | 159,609 36.5% |
— | 933 0.2% |
| 1980 | 203,740 46.7% |
— | 98,687 22.6% |
— | — | 132,159 30.3% |
— | 953 0.2% |
| 1984 | 136,208 29.9% |
— | 104,223 22.9% |
— | — | 214,843 47.1% |
— | 141 0.0% |
| 1988 | 198,455 40.2% |
— | 121,679 24.6% |
— | — | 164,980 33.4% |
— | 7,994 1.6% |
| 1993 | 266,349 54.6% |
— | 42,763 8.8% |
1,918 0.4% |
— | 81,334 16.7% |
83,538 17.1% |
12,129 2.5% |
| 1997 | 209,513 47.6% |
— | 68,895 15.6% |
3,434 0.8% |
— | 65,717 14.9% |
84,454 19.2% |
8,343 1.9% |
| 2000 | 201,859 48.3% |
— | 50,285 12.0% |
3,686 0.9% |
— | 47,883 11.5% |
110,620 26.5% |
3,190 0.8% |
| 2004 | 182,852 38.4% |
149,902 31.5% |
116,361 24.4% |
20,020 4.2% |
— | — | — | 5,974 1.3% |
| 2006 | 170,565 32.1% |
189,968 35.8% |
143,392 27.0% |
21,076 4.0% |
— | — | — | 4,217 0.8% |
| 2008 | 125,074 26.6% |
183,406 39.0% |
124,325 26.5% |
33,665 7.2% |
— | — | — | 2,811 0.6% |
| 2011 | 85,083 17.4% |
222,451 45.4% |
164,202 33.5% |
14,774 3.0% |
— | — | — | 2,656 0.5% |
| 2015 | 188,904 33.1% |
205,474 36.0% |
158,586 27.8% |
15,734 2.8% |
— | — | — | 2,245 0.4% |
| 2019 | 181,782 30.3% |
216,455 36.1% |
156,845 26.1% |
28,903 4.8% |
12,731 2.1% |
— | — | 2,481 0.4% |
| 2021 | 154,118 26.1% |
213,039 36.1% |
157,279 26.7% |
6,981 1.2% |
56,188 9.5% |
— | — | 2,207 0.4% |

2021
| Electoral district | Candidates | Incumbent | ||||||||||||
|---|---|---|---|---|---|---|---|---|---|---|---|---|---|---|
| Liberal | Conservative | NDP | Green | PPC | Other | |||||||||
| Chatham-Kent—Leamington | Greg Hetherington 15,683 28.59% |
Dave Epp 22,435 40.90% |
Dan Gelinas 8,007 14.60% |
Mark Vercouteren 837 1.53% |
Liz Vallee 7,892 14.39% |
Dave Epp | ||||||||
| Elgin—Middlesex—London | Afeez Ajibowu 12,326 19.55% |
Karen Vecchio 31,472 49.91% |
Katelyn Cody 10,086 15.99% |
Amanda Stark 1,417 2.25% |
Chelsea Hillier 7,429 11.78% |
Michael Hopkins (CHP) 328 0.52% |
Karen Vecchio | |||||||
| Essex | Audrey Festeryga 10,813 15.45% |
Chris Lewis 28,741 41.07% |
Tracey Ramsey 22,278 31.84% |
Nancy Pancheshan 865 1.24% |
Beth Charron-Rowberry 6,925 9.90% |
Andrew George (Ind.) 172 0.25% |
Chris Lewis | |||||||
| Jeremy Palko (CHP) 182 0.26% | ||||||||||||||
| Lambton—Kent—Middlesex | Sudit Ranade 12,552 20.68% |
Lianne Rood 29,431 48.49% |
Jason Henry 11,107 18.30% |
Jeremy Hull 1,035 1.71% |
Kevin Mitchell 6,567 10.82% |
Lianne Rood | ||||||||
| London—Fanshawe | Mohamed Hammoud 11,882 23.11% |
Mattias Vanderley 12,486 24.28% |
Lindsay Mathyssen 22,336 43.44% |
Kyle Free 4,718 9.18% |
Lindsay Mathyssen | |||||||||
| London North Centre | Peter Fragiskatos 22,921 39.10% |
Stephen Gallant 15,889 27.11% |
Dirka Prout 15,611 26.63% |
Mary Ann Hodge 1,297 2.21% |
Marc Emery 2,902 4.95% |
Peter Fragiskatos | ||||||||
| London West | Arielle Kayabaga 25,308 36.88% |
Rob Flack 22,273 32.46% |
Shawna Lewkowitz 16,858 24.57% |
Mike McMullen 3,409 4.97% |
Jacques Y. Boudreau (Libert.) 773 1.13% |
Kate Young | ||||||||
| Sarnia—Lambton | Lois Nantais 10,975 19.29% |
Marilyn Gladu 26,292 46.21% |
Adam Kilner 11,990 21.07% |
Stefanie Bunko 848 1.49% |
Brian Everaert 6,359 11.18% |
Tom Laird (CHP) 435 0.76% |
Marilyn Gladu | |||||||
| Windsor—Tecumseh | Irek Kusmierczyk 18,134 31.83% |
Kathy Borrelli 14,605 25.63% |
Cheryl Hardcastle 17,465 30.65% |
Henry Oulevey 682 1.20% |
Victor Green 5,927 10.40% |
Laura Chesnik (M-L) 164 0.29% |
Irek Kusmierczyk | |||||||
| Windsor West | Sandra Pupatello 13,524 27.77% |
Anthony Orlando 9,415 19.34% |
Brian Masse 21,541 44.24% |
Matthew Giancola 4,060 8.34% |
Margaret Villamizar (M-L) 153 0.31% |
Brian Masse | ||||||||
2019
| Electoral district | Candidates | Incumbent | ||||||||||||
|---|---|---|---|---|---|---|---|---|---|---|---|---|---|---|
| Liberal | Conservative | NDP | Green | PPC | Other | |||||||||
| Chatham-Kent—Leamington | Katie Omstead 16,899 31.24% |
Dave Epp 25,359 46.88% |
Tony Walsh 8,229 15.21% |
Mark Vercouteren 2,233 4.13% |
John Balagtas 1,061 1.96% |
Paul Coulbeck (Mar.) 307 0.57% |
Dave Van Kesteren† | |||||||
| Elgin—Middlesex—London | Pam Armstrong 14,324 23.20% |
Karen Vecchio 31,026 50.24% |
Bob Hargreaves 11,019 17.84% |
Ericha Hendel 3,562 5.77% |
Donald Helkaa 956 1.55% |
Peter Redecop (CHP) 618 1.00% Richard Styve (Libert.) 249 0.40% |
Karen Vecchio | |||||||
| Essex | Audrey Festeryga 12,987 19.02% |
Chris Lewis 28,274 41.40% |
Tracey Ramsey 23,603 34.56% |
Jennifer Alderson 2,173 3.18% |
Bill Capes 1,251 1.83% |
Tracey Ramsey | ||||||||
| Lambton—Kent—Middlesex | Jesse McCormick 14,814 25.36% |
Lianne Rood 28,651 49.05% |
Dylan Mclay 9,355 16.02% |
Anthony Li 3,463 5.93% |
Bria Atkins 1,804 3.09% |
Rob Lalande (VCP) 325 0.56% |
Bev Shipley† | |||||||
| London—Fanshawe | Mohamed Hammoud 14,924 26.85% |
Michael van Holst 13,770 24.78% |
Lindsay Mathyssen 22,671 40.79% |
Tom Cull 2,781 5.00% |
Bela Kosoian 1,132 2.04% |
Stephen Campbell (Ind.) 297 0.53% |
Irene Mathyssen† | |||||||
| London North Centre | Peter Fragiskatos 27,247 42.75% |
Sarah Bokhari 15,066 23.64% |
Dirka Prout 14,887 23.36% |
Carol Dyck 4,872 7.64% |
Salim Mansur 1,532 2.40% |
Clara Sorrenti (Comm.) 137 0.21% |
Peter Fragiskatos | |||||||
| London West | Kate Young 30,622 42.96% |
Liz Snelgrove 19,910 27.93% |
Shawna Lewkowitz 15,220 21.35% |
Mary Ann Hodge 3,827 5.37% |
Mike Mcmullen 1,171 1.64% |
Jacques Boudreau (Libert.) 523 0.73% |
Kate Young | |||||||
| Sarnia—Lambton | Carmen Lemieux 12,041 20.79% |
Marilyn Gladu 28,623 49.42% |
Adam Kilner 12,644 21.83% |
Peter Robert Smith 2,490 4.30% |
Brian Everaert 1,587 2.74% |
Thomas Laird (CHP) 531 0.92% |
Marilyn Gladu | |||||||
| Windsor—Tecumseh | Irek Kusmierczyk 19,046 33.44% |
Leo Demarce 15,851 27.83% |
Cheryl Hardcastle 18,417 32.33% |
Giovanni Abati 2,177 3.82% |
Dan Burr 1,279 2.25% |
Laura Chesnik (M-L) 187 0.33% |
Cheryl Hardcastle | |||||||
| Windsor West | Sandra Pupatello 18,878 36.33% |
Henry Lau 9,925 19.10% |
Brian Masse 20,800 40.03% |
Quinn Hunt 1,325 2.55% |
Darryl Burrell 958 1.84% |
Margaret Villamizar (M-L) 76 0.15% |
Brian Masse | |||||||
2015
| Electoral district | Candidates | Incumbent | ||||||||||
|---|---|---|---|---|---|---|---|---|---|---|---|---|
| Conservative | NDP | Liberal | Green | Other | ||||||||
| Chatham-Kent—Leamington | Dave Van Kesteren 21,677 41.71% |
Tony Walsh 9,549 18.37% |
Katie Omstead 19,351 37.23% |
Mark Vercouteren 1,394 2.68% |
Dave Van Kesteren Chatham-Kent—Essex | |||||||
| Elgin—Middlesex—London | Karen Louise Vecchio 28,023 49.22% |
Fred Sinclair 8,771 15.41% |
Lori Baldwin-Sands 17,642 30.99% |
Bronagh Joyce Morgan 1,783 3.13% |
Lou Bernardi (Rhino.) 185 0.32% |
Joe Preston† | ||||||
| Michael Hopkins (CHP) 529 0.93% | ||||||||||||
| Essex | Jeff Watson 21,602 35.69% |
Tracey Ramsey 25,072 41.42% |
Audrey Festeryga 12,639 20.88% |
Jennifer Alderson 1,141 1.88% |
Enver Villamizar (M-L) 77 0.13% |
Jeff Watson | ||||||
| Lambton—Kent—Middlesex | Bev Shipley 28,300 50.21% |
Rex Isaac 9,598 17.03% |
Ken Filson 16,592 29.44% |
Jim Johnston 1,873 3.32% |
Bev Shipley | |||||||
| London—Fanshawe | Suzanna Dieleman 14,891 27.20% |
Irene Mathyssen 20,684 37.78% |
Khalil Ramal 17,214 31.44% |
Matthew Peloza 1,604 2.93% |
Ali Hamada (Ind.) 352 0.64% |
Irene Mathyssen | ||||||
| London North Centre | Susan Truppe 19,990 31.10% |
German Gutierrez 9,423 14.66% |
Peter Fragiskatos 32,427 50.45% |
Carol Dyck 2,286 3.56% |
Marvin Roman (M-L) 145 0.23% |
Susan Truppe | ||||||
| London West | Ed Holder 24,036 35.33% |
Matthew Rowlinson 10,087 14.83% |
Kate Young 31,167 45.82% |
Dimitri Lascaris 1,918 2.82% |
Jacques Y. Boudreau (Libert.) 732 1.08% |
Ed Holder | ||||||
| Michael Lewis (Comm.) 87 0.13% | ||||||||||||
| Sarnia—Lambton | Marilyn Gladu 22,565 38.82% |
Jason Wayne McMichael 18,102 31.14% |
Dave McPhail 15,853 27.27% |
Peter Smith 1,605 2.76% |
Patricia Davidson† | |||||||
| Windsor—Tecumseh | Jo-Anne Gignac 14,656 27.47% |
Cheryl Hardcastle 23,215 43.52% |
Frank Schiller 14,177 26.58% |
David Momotiuk 1,047 1.96% |
Laura Chesnik (M-L) 249 0.47% |
Joe Comartin† | ||||||
| Windsor West | Henry Lau 9,734 20.75% |
Brian Masse 24,085 51.35% |
David Sundin 11,842 25.25% |
Cora LaRussa 1,083 2.31% |
Margaret Villamizar (M-L) 161 0.34% |
Brian Masse | ||||||
2011
| Electoral district | Candidates | Incumbent | ||||||||||
|---|---|---|---|---|---|---|---|---|---|---|---|---|
| Conservative | Liberal | NDP | Green | Other | ||||||||
| Chatham-Kent—Essex | Dave Van Kesteren 23,360 53.76% |
Matt Daudlin 7,172 16.51% |
Ron Franko 11,449 26.35% |
Robert Hodgson 1,470 3.38% |
Dave Van Kesteren | |||||||
| Elgin—Middlesex—London | Joe Preston 29,147 57.55% |
Graham Warwick 6,812 13.45% |
Fred Sinclair 12,439 24.56% |
John Fisher 1,529 3.02% |
Will Arlow (CAP) 140 0.28% |
Joe Preston | ||||||
| Carl Hiemstra (CHP) 582 1.15% | ||||||||||||
| Essex | Jeff Watson 25,327 48.06% |
Nelson Santos 7,465 14.17% |
Taras Natyshak 18,538 35.18% |
Cora Carriveau 1,290 2.45% |
Enver Villamizar (M-L) 77 0.15% |
Jeff Watson | ||||||
| Lambton—Kent—Middlesex | Bev Shipley 29,546 57.68% |
Gayle Stucke 7,264 14.18% |
Joe Hill 12,299 24.01% |
Jim Johnston 1,701 3.32% |
Mike Janssens (CHP) 413 0.81% |
Bev Shipley | ||||||
| London—Fanshawe | Jim Chahbar 14,294 33.54% |
Roger Caranci 4,893 11.48% |
Irene Mathyssen 21,689 50.90% |
Matthew Peloza 1,202 2.82% |
G.J. Rancourt (CHP) 535 1.26% |
Irene Mathyssen | ||||||
| London North Centre | Susan Truppe 19,468 36.96% |
Glen Pearson 17,803 33.80% |
German Gutierrez 12,996 24.67% |
Mary Ann Hodge 2,177 4.13% |
AnnaMaria Valastro (AAEVP) 229 0.43% |
Glen Pearson | ||||||
| London West | Ed Holder 27,675 44.49% |
Doug Ferguson 16,652 26.77% |
Peter Ferguson 16,109 25.90% |
Brad Arthur Corbett 1,703 2.74% |
Rod Morley (United) 65 0.10% |
Ed Holder | ||||||
| Sarnia—Lambton | Pat Davidson 26,112 52.58% |
Tim Fugard 6,931 13.96% |
Brian White 14,856 29.91% |
Tim van Bodegom 1,252 2.52% |
Christopher Desomeaux-Malm (CHP) 514 1.03% |
Patricia Davidson | ||||||
| Windsor—Tecumseh | Denise Ghanam 14,945 33.55% |
Irek Kusmierczyk 5,764 12.94% |
Joe Comartin 22,235 49.92% |
Kyle Prestanski 1,354 3.04% |
Laura Chesnik (M-L) 242 0.54% |
Joe Comartin | ||||||
| Windsor West | Lisa Lumley 12,577 31.64% |
Melanie Deveau 4,327 10.89% |
Brian Masse 21,592 54.33% |
Alishia Fox 1,096 2.76% |
Margaret Villamzir (M-L) 153 0.38% |
Brian Masse | ||||||
2008
| Electoral district | Candidates | Incumbent | ||||||||||
|---|---|---|---|---|---|---|---|---|---|---|---|---|
| Conservative | Liberal | NDP | Green | Other | ||||||||
| Chatham-Kent— Essex |
Dave Van Kesteren 19,960 47.92% |
Matt Daudlin 12,127 29.12% |
Ron Cadotte 6,850 16.45% |
Alina Abbott 2,712 6.51% |
Dave Van Kesteren | |||||||
| Elgin— Middlesex— London |
Joe Preston 22,970 48.39% |
Suzanne van Bommel 11,169 23.53% |
Ryan Dolby 9,135 19.24% |
Noel Burgon 3,241 6.83% |
Will Arlow (CAP) 96 0.20% |
Joe Preston | ||||||
| Carl Hiemstra (CHP) 619 1.30% | ||||||||||||
| Michael van Holst (Ind.) 243 0.51% | ||||||||||||
| Essex | Jeff Watson 20,608 40.00% |
Susan Whelan 14,973 29.06% |
Taras Natyshak 13,703 26.60% |
Richard Bachynsky 2,234 4.34% |
Jeff Watson | |||||||
| Lambton— Kent— Middlesex |
Bev Shipley 24,516 51.28% |
Jeff Wesley 11,812 24.71% |
Joe Hill 7,427 15.54% |
Jim Johnston 3,386 7.08% |
Micheal Janssens (CHP) 663 1.39% |
Bev Shipley | ||||||
| London—Fanshawe | Mary Lou Ambrogio 12,659 30.85% |
Jacquie Gauthier 7,774 18.94% |
Irene Mathyssen 17,672 43.06% |
Daniel O'Neail 2,656 6.47% |
Leonard Vanderhoeven (CHP) 276 0.67% |
Irene Mathyssen | ||||||
| London North Centre | Paul Van Meerbergen 17,712 32.97% |
Glen Pearson 21,018 39.13% |
Steve Holmes 9,387 17.47% |
Mary Ann Hodge 5,603 10.43% |
Glen Pearson | |||||||
| London West | Ed Holder 22,556 39.09% |
Sue Barnes 20,435 35.42% |
Peter Ferguson 8,409 14.57% |
Monica Jarabek 5,630 9.76% |
Leslie Bartley (CHP) 253 0.44% |
Sue Barnes | ||||||
| Steve Hunter (PC) 414 0.72% | ||||||||||||
| Sarnia—Lambton | Pat Davidson 23,195 50.01% |
Tim Fugard 9,404 20.28% |
Andy Bruziewicz 10,037 21.64% |
Alan McKeown 3,201 6.90% |
Christopher Desormeaux-Malm (CHP) 545 1.18% |
Patricia Davidson | ||||||
| Windsor—Tecumseh | Denise Ghanam 10,276 23.93% |
Steve Mastroianni 9,005 20.97% |
Joe Comartin 20,914 48.70% |
Kyle Prestanski 2,749 6.40% |
Joe Comartin | |||||||
| Windsor West | Lisa Lumley 8,954 22.61% |
Larry Horwitz 7,357 18.58% |
Brian Masse 20,791 52.51% |
John Esposito 2,253 5.69% |
Elizabeth Rowley (Comm.) 125 0.32% |
Brian Masse | ||||||
| Margaret Villamizar (M-L) 116 0.29% | ||||||||||||
2006
| Electoral district | Candidates | Incumbent | ||||||||||||
|---|---|---|---|---|---|---|---|---|---|---|---|---|---|---|
| Liberal | Conservative | NDP | Green | Marxist-Leninist | Other | |||||||||
| Chatham-Kent—Essex | Jim Comiskey 15,204 31.26% |
Dave Van Kesteren 20,820 42.81% |
Kathleen Kevany 10,875 22.36% |
Ken Bell 1,737 3.57% |
Jerry Pickard† | |||||||||
| Elgin—Middlesex—London | Crispin Colvin 13,517 26.34% |
Joe Preston 23,416 45.62% |
Tim McCallum 9,873 19.24% |
Jonathan Martyn 2,873 5.60% |
Will Arlow (CAP) 105 0.20% |
Joe Preston | ||||||||
| Phill Borm (PC) 504 0.98% | ||||||||||||||
| Ken DeVries (CHP) 1,039 2.02% | ||||||||||||||
| Essex | Susan Whelan 19,510 34.08% |
Jeff Watson 23,125 40.40% |
Taras Natyshak 12,993 22.70% |
James McVeity 1,507 2.63% |
Bob Cruise 108 0.19% |
Jeff Watson | ||||||||
| Lambton—Kent—Middlesex | Jeff Wesley 16,835 31.01% |
Bev Shipley 25,170 46.36% |
Kevin Blake 9,330 17.19% |
Jim Johnston 2,156 3.97% |
Mike Janssens (CHP) 797 1.47% |
Rose-Marie Ur† | ||||||||
| London—Fanshawe | Glen Douglas Pearson 15,199 32.64% |
Dan Mailer 13,495 28.98% |
Irene Mathyssen 16,067 34.51% |
David McLaughlin 1,803 3.87% |
Pat O'Brien† | |||||||||
| London North Centre | Joe Fontana 24,109 40.12% |
John Mazzilli 17,968 29.90% |
Stephen Maynard 14,271 23.75% |
Stuart Smith 3,300 5.49% |
Margaret Mondaca 160 0.27% |
Rod Morley (PC) 283 0.47% |
Joe Fontana | |||||||
| London West | Sue Barnes 23,019 37.70% |
Al Gretzky 21,690 35.53% |
Gina Barber 13,056 21.39% |
Monica Jarabek 2,900 4.75% |
Margaret Villamizar 59 0.10% |
Steve Hunter (PC) 328 0.54% |
Sue Barnes | |||||||
| Sarnia—Lambton | Roger Gallaway 17,649 33.11% |
Pat Davidson 21,841 40.98% |
Greg Agar 10,673 20.02% |
Mike Jacobs 1,712 3.21% |
Gary De Boer (CHP) 1,108 2.08% |
Roger Gallaway | ||||||||
| John Elliott (Ind.) 316 0.59% | ||||||||||||||
| Windsor—Tecumseh | Bruck Easton 13,413 26.43% |
Rick Fuschi 12,851 25.32% |
Joe Comartin 22,646 44.63% |
Catherine Pluard 1,644 3.24% |
Laura Chesnik 193 0.38% |
Joe Comartin | ||||||||
| Windsor West | Werner Keller 12,110 25.39% |
Al Teshuba 9,592 20.11% |
Brian Masse 23,608 49.49% |
Jillana Bishop 1,444 3.03% |
Enver Villamizar 108 0.23% |
Chris Schnurr (PC) 614 1.29% |
Brian Masse | |||||||
| Habib Zaidi (Ind.) 224 0.47% | ||||||||||||||
2004
| Electoral district | Candidates | Incumbent | ||||||||||
|---|---|---|---|---|---|---|---|---|---|---|---|---|
| Liberal | Conservative | NDP | Green | Other | ||||||||
| Chatham-Kent—Essex | Jerry Pickard 17,435 |
Dave Van Kesteren 17,028 |
Kathleen Kevany 7,538 |
Rod Hetherington 1,845 |
150 | Jerry Pickard | ||||||
| Elgin—Middlesex—London | Gar Knutson 15,860 |
Joe Preston 20,333 |
Tim Mccallum 6,763 |
Julie-Ann Stodolny 2,033 |
1,392 | Gar Knutson | ||||||
| Essex | Susan Whelan 17,926 |
Jeff Watson 18,755 |
David Tremblay 12,519 |
Paul Forman 1,981 |
105 | Susan Whelan | ||||||
| London North Centre | Joe Fontana 21,472 |
Tim Gatten 13,677 |
Joe Swan 12,034 |
Bronagh Joyce Morgan 2,376 |
287 | Joe Fontana | ||||||
| London West | Sue Barnes 25,061 |
Mike Menear 17,335 |
Gina Barber 9,522 |
Rebecca Bromwich 2,611 |
578 | Sue Barnes | ||||||
| London—Fanshawe | Pat O'Brien 15,664 |
John Mazzilli 10,811 |
Irene Mathyssen 12,511 |
Ed Moore 1,634 |
518 | Pat O'Brien | ||||||
| Middlesex—Kent—Lambton | Rose-Marie Ur 19,452 |
Bev Shipley 19,288 |
Kevin Blake 7,376 |
Allan Mckeown 1,834 |
1,015 | Rose-Marie Ur Lambton—Kent—Middlesex | ||||||
| Sarnia—Lambton | Roger Gallaway 19,932 |
Marcel Beaubien 14,500 |
Greg Agar 7,764 |
Anthony Cramer 2,548 |
2,797 | Roger Gallaway | ||||||
| Windsor West | Richard Pollock 13,831 |
Jordan Katz 8,348 |
Brian Masse 20,297 |
Rob Spring 1,545 |
134 | Brian Masse[a] | ||||||
| Windsor—Tecumseh | Richard G.J. Limoges 16,219 |
Rick Fuschi 9,827 |
Joe Comartin 20,037 |
Elizabeth Powles 1,613 |
182 | Joe Comartin Windsor—St. Clair | ||||||
Maps
|
|

2000
| Electoral district | Candidates | Incumbent | ||||||||||
|---|---|---|---|---|---|---|---|---|---|---|---|---|
| Liberal | Canadian Alliance | NDP | PC | Other | ||||||||
| Chatham-Kent—Essex | Jerry Pickard 20,085 |
Sean Smart 12,957 |
Susan Mackay 2,209 |
Ryan Bailey 4,156 |
1,001 | Jerry Pickard Kent—Essex | ||||||
| Elgin—Middlesex—London | Gar Knutson 17,202 |
Bill Walters 15,496 |
Tim Mccallum 2,319 |
Delia Reiche 6,080 |
838 | Gar Knutson | ||||||
| Essex | Susan Whelan 20,524 |
Scott Cowan 16,019 |
Marion Overholt 6,431 |
Merrill Baker 3,175 |
152 | Susan Whelan | ||||||
| Lambton—Kent—Middlesex | Rose-Marie Ur 21,124 |
Ron Young 13,302 |
Joyce Jolliffe 1,871 |
John Phair 5,918 |
938 | Rose-Marie Ur | ||||||
| London North Centre | Joe Fontana 22,795 |
Nancy Branscombe 9,062 |
Colleen Redmond 3,936 |
Lorie Johnson 7,305 |
1,199 | Joe Fontana London—Adelaide | ||||||
| London West | Sue Barnes 23,794 |
Salim Mansur 10,162 |
George Goodlet 3,596 |
Jeff Lang 9,788 |
855 | Sue Barnes | ||||||
| London—Fanshawe | Pat O'Brien 19,677 |
Robert Vaughan 7,998 |
Andrew Sadler 4,107 |
Derrall Bellaire 4,119 |
Pat O'Brien | |||||||
| Sarnia—Lambton | Roger Gallaway 19,329 |
Dave Christie 11,208 |
Glenn Sonier 2,735 |
Paul Bailey 3,320 |
1,328 | Roger Gallaway | ||||||
| Windsor West | Herb Gray 20,729 |
Jeff Watson 8,777 |
John Mcginlay 6,080 |
Ian West 2,116 |
533 | Herb Gray | ||||||
| Windsor—St. Clair | Rick Limoges 16,600 |
Phillip Pettinato 5,639 |
Joe Comartin 17,001 |
Bruck Easton 1,906 |
485 | Rick Limoges[b] | ||||||
Notes
- ^ Elected in 2002 by-election following the resignation of the Liberal MP Herb Gray.
- ^ Elected in a 1999 by-election following the resignation of Liberal MP Shaughnessy Cohen.