
| |||||||||||||||||||||||||||||||||||||||||||||||||||||||||||||||||
All 57 council seats on Merton London Borough Council | |||||||||||||||||||||||||||||||||||||||||||||||||||||||||||||||||
|---|---|---|---|---|---|---|---|---|---|---|---|---|---|---|---|---|---|---|---|---|---|---|---|---|---|---|---|---|---|---|---|---|---|---|---|---|---|---|---|---|---|---|---|---|---|---|---|---|---|---|---|---|---|---|---|---|---|---|---|---|---|---|---|---|---|
| |||||||||||||||||||||||||||||||||||||||||||||||||||||||||||||||||
| |||||||||||||||||||||||||||||||||||||||||||||||||||||||||||||||||
Elections for the London Borough of Merton were held on 5 May 2022 to elect all 57 members of Merton London Borough Council in England. The elections took place alongside local elections in the other London boroughs and elections to local authorities across the United Kingdom.
The 2022 election took place under new election boundaries, which reduced the number of councillors from 60 to 57. Labour remained the largest party following the election, winning 31 seats. For the first time in the council's history, the Liberal Democrats became the largest opposition party, winning 17 seats. The Conservatives, previously the largest opposition party, won seven seats.
Background
Since its formation, Merton has variously been under Labour control, Conservative control and no overall control. In the previous council election in 2018, Labour and the Conservatives lost seats to the Liberal Democrats. Labour won 34 seats with 46.9% of the vote across the borough, while the Conservatives won 17 seats with 31.5% of the vote. The Liberal Democrats rose to six seats with 14.6% of the vote and the Merton Park Ward Independent Residents continued to hold three seats with 3.3% of the vote across the borough.[1][2]
Council term
In May 2019, Mark Kenny, a Labour councillor for Cannon Hill, resigned citing health reasons.[3] A by-election to fill the seat was held in June 2019, which was won by the Liberal Democrat candidate Jenifer Gould.[4] One of the Liberal Democrat councillors for West Barnes, Carl Quilliam who had previously lost the contest to become the Liberal Democrat Parliamentary Candidate for Wimbledon in 2019, defected to the Labour Party in June 2020 citing the national leadership of Keir Starmer.[5] In March 2021, Kelly Braund, a Labour councillor for St Helier, resigned because she was moving to Scotland.[6] At the subsequent by-election, the seat was held for Labour by Helen Dollimore.[7]
The Labour councillor Mark Allison succeeded Stephen Alambritis as leader of the council in November 2020.[8]
Along with most other London boroughs, Merton was subject to a boundary review ahead of the 2022 election. The Local Government Boundary Commission for England concluded that the council should have 57 seats, falling from the previous 60 seats, and produced new election boundaries following a period of consultation.[9]
Electoral process
Merton, like other London borough councils, elects all of its councillors at once every four years. The election took place by multi-member first-past-the-post voting, with each ward being represented by two or three councillors. Electors had as many votes as there are councillors to be elected in their ward, with the top two or three being elected.
All registered electors (British, Irish, Commonwealth and European Union citizens) living in London aged 18 or over were entitled to vote in the election. People who lived at two addresses in different councils, such as university students with different term-time and holiday addresses, were entitled to be registered for and vote in elections in both local authorities.[10] Voting in-person at polling stations took place from 7:00 to 22:00 on election day, and voters will be able to apply for postal votes or proxy votes in advance of the election.[10]
Results
| Party | Seats | Gains | Losses | Net gain/loss | Seats % | Votes % | Votes | +/− | |
|---|---|---|---|---|---|---|---|---|---|
| Labour | 31 | 54.4 | 42.3 | 70,423 | -4.6 | ||||
| Liberal Democrats | 17 | 29.8 | 25.0 | 41,655 | +10.4 | ||||
| Conservative | 7 | 12.3 | 26.1 | 43,382 | -5.4 | ||||
| Merton Park Residents | 2 | 3.5 | 2.1 | 3,576 | -1.2 | ||||
| Green | 0 | 0 | 0 | 0.0 | 4.3 | 7,161 | +1.5 | ||
| TUSC | 0 | 0 | 0 | 0.0 | 0.1 | 154 | +0.1 | ||
Due to the boundary changes, which reduced the number of seats from 60 to 57, reporting the gains/losses by party is not straightforward. The BBC used a calculation which takes into account the changes relative to the expected previous result under the new boundaries. These give: Labour -4, Liberal Democrats +12, Conservatives -8, Merton Park Independents: no change.[11]
Council composition
-
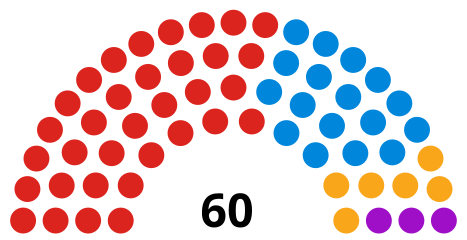 Council composition after the 2018 election and before the 2022 election
 -
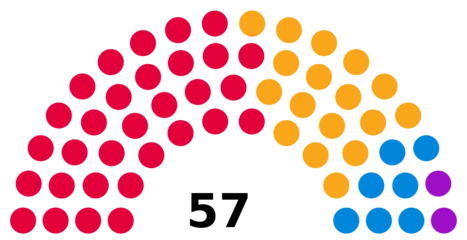 Council composition after the 2022 election


| After 2018 election | Before 2022 election | After 2022 election | ||||||
|---|---|---|---|---|---|---|---|---|
| Party | Seats | Party | Seats | Party | Seats | |||
| Labour | 34 | Labour | 34 | Labour | 31 | |||
| Conservative | 17 | Conservative | 17 | Liberal Democrats | 17 | |||
| Liberal Democrats | 6 | Liberal Democrats | 6 | Conservative | 7 | |||
| Merton Park Residents | 3 | Merton Park Residents | 3 | Merton Park Residents | 2 | |||
Ward results
Abbey
| Party | Candidate | Votes | % | ±% | |
|---|---|---|---|---|---|
| Liberal Democrats | John Braithwaite | 1,294 | 37.6 | N/A | |
| Labour | Mike Brunt | 1,169 | 34.0 | N/A | |
| Liberal Democrats | Klaar Dresselaers | 1,160 | 33.7 | N/A | |
| Liberal Democrats | Barry Smith | 1,151 | 33.5 | N/A | |
| Labour | Karen Peck | 1,133 | 32.9 | N/A | |
| Labour | Zak Dada | 1,089 | 31.7 | N/A | |
| Conservative | Nigel Benbow* | 927 | 27.0 | N/A | |
| Conservative | Hayley Ormrod* | 858 | 24.9 | N/A | |
| Conservative | Sivas Ranjan | 796 | 23.1 | N/A | |
| Green | Peter Garrett | 391 | 11.4 | N/A | |
| Turnout | 3,439 | 46.5 | |||
| Liberal Democrats gain from Labour | |||||
| Labour hold | |||||
| Liberal Democrats gain from Conservative | |||||
Cannon Hill
| Party | Candidate | Votes | % | ±% | |
|---|---|---|---|---|---|
| Liberal Democrats | Jennifer Gould* | 1,329 | 36.7 | N/A | |
| Conservative | Nicholas McLean* | 1,263 | 34.9 | N/A | |
| Conservative | Michael Paterson | 1,193 | 32.9 | N/A | |
| Liberal Democrats | Asif Ashraf | 1,168 | 32.3 | N/A | |
| Conservative | Frank Pocock | 1,140 | 31.5 | N/A | |
| Liberal Democrats | Richard Poole | 1,129 | 31.2 | N/A | |
| Labour | Dave Barnes | 1,049 | 29.0 | N/A | |
| Labour | Pauline Cowper | 984 | 27.2 | N/A | |
| Labour | Ryan Barnett | 977 | 27.0 | N/A | |
| Green | Jae Henderson | 299 | 8.3 | N/A | |
| Turnout | 3,621 | 49.9 | |||
| Liberal Democrats gain from Labour | |||||
| Conservative hold | |||||
| Conservative gain from Labour | |||||
Colliers Wood
| Party | Candidate | Votes | % | ±% | |
|---|---|---|---|---|---|
| Labour | Caroline Cooper-Marbiah* | 1,907 | 61.9 | N/A | |
| Labour | Laxmi Attawar* | 1,809 | 58.7 | N/A | |
| Labour | Stuart Neaverson | 1,563 | 50.7 | N/A | |
| Green | Philip Geraghty | 855 | 27.7 | N/A | |
| Green | Thomas Walsh | 696 | 22.6 | N/A | |
| Conservative | Harry Todd | 400 | 13.0 | N/A | |
| Conservative | Dylan White | 369 | 12.0 | N/A | |
| Conservative | Katarzyna Markham | 359 | 11.6 | N/A | |
| Liberal Democrats | Emily Robertson | 276 | 9.0 | N/A | |
| Liberal Democrats | Shipra Gupta | 265 | 8.6 | N/A | |
| Liberal Democrats | John Kenny | 230 | 7.5 | N/A | |
| Turnout | 3,083 | 37.2 | |||
| Labour hold | |||||
| Labour hold | |||||
| Labour hold | |||||
Cricket Green
| Party | Candidate | Votes | % | ±% | |
|---|---|---|---|---|---|
| Labour | Gill Manly | 1,816 | 70.7 | N/A | |
| Labour | Michael Butcher | 1,788 | 69.6 | N/A | |
| Labour | Usaama Kaweesa | 1,774 | 69.0 | N/A | |
| Conservative | Barbara Mansfield | 433 | 16.8 | N/A | |
| Conservative | Gary Watkinson | 351 | 13.7 | N/A | |
| Conservative | Peter Ludvigsen | 348 | 13.5 | N/A | |
| Green | Christopher Stanton | 274 | 10.7 | N/A | |
| Liberal Democrats | Vincent Bolt | 196 | 7.6 | N/A | |
| Liberal Democrats | Gail Morrison | 182 | 7.1 | N/A | |
| Liberal Democrats | William Woodward | 121 | 4.7 | N/A | |
| TUSC | Alex Forbes | 80 | 3.1 | N/A | |
| Turnout | 2,570 | 31.7 | |||
| Labour hold | |||||
| Labour hold | |||||
| Labour hold | |||||
Figge's Marsh
| Party | Candidate | Votes | % | ±% | |
|---|---|---|---|---|---|
| Labour | Agatha Akyigyina* | 1,962 | 78.6 | N/A | |
| Labour | Natasha Irons* | 1,882 | 75.4 | N/A | |
| Labour | Daniel Johnston | 1,753 | 70.2 | N/A | |
| Conservative | Linda Taylor | 293 | 11.7 | N/A | |
| Conservative | Alice Hammond | 267 | 10.7 | N/A | |
| Conservative | Tim Williamson | 257 | 10.3 | N/A | |
| Green | Sally Pannifex | 221 | 8.9 | N/A | |
| Liberal Democrats | Eloise Bailey* | 152 | 6.1 | N/A | |
| Liberal Democrats | John Raymond | 115 | 4.6 | N/A | |
| Liberal Democrats | Nicholas Thomas | 103 | 4.1 | N/A | |
| TUSC | April Ashley | 84 | 3.4 | N/A | |
| Turnout | 2,496 | 32.9 | |||
| Labour hold | |||||
| Labour hold | |||||
| Labour hold | |||||
Graveney
| Party | Candidate | Votes | % | ±% | |
|---|---|---|---|---|---|
| Labour | Linda Kirby* | 2,182 | 75.4 | N/A | |
| Labour | Sheri Ann Bhim | 2,097 | 72.5 | N/A | |
| Labour | Billy Hayes | 2,009 | 69.5 | N/A | |
| Green | Rupert Stevens | 422 | 14.6 | N/A | |
| Conservative | Louis Altman | 385 | 13.3 | N/A | |
| Conservative | Sally Hammond | 363 | 12.6 | N/A | |
| Conservative | Ricky Osei | 323 | 11.2 | N/A | |
| Liberal Democrats | Christine Peace | 199 | 6.9 | N/A | |
| Liberal Democrats | Yue Hang Ho | 166 | 5.7 | N/A | |
| Liberal Democrats | Quresh Mukadam | 142 | 4.9 | N/A | |
| Turnout | 2,892 | 35.2 | |||
| Labour hold | |||||
| Labour hold | |||||
| Labour hold | |||||
Hillside
| Party | Candidate | Votes | % | ±% | |
|---|---|---|---|---|---|
| Liberal Democrats | Susan Hicks | 1,105 | 42.4 | N/A | |
| Conservative | Dan Holden* | 1,059 | 40.6 | N/A | |
| Conservative | Rob Cossins | 1,015 | 38.9 | N/A | |
| Liberal Democrats | Ursula Faulkner | 1,005 | 38.5 | N/A | |
| Labour | Rebecca Bottriell | 515 | 19.7 | N/A | |
| Labour | Steven Hirsch | 464 | 17.8 | N/A | |
| Turnout | 2,608 | 43.4 | |||
| Liberal Democrats gain from Conservative | |||||
| Conservative hold | |||||
Lavender Fields
| Party | Candidate | Votes | % | ±% | |
|---|---|---|---|---|---|
| Labour | Edith Macauley* | 1,608 | 67.8 | N/A | |
| Labour | Billy Christie* | 1,580 | 66.6 | N/A | |
| Labour | Slawek Szczepanski | 1,390 | 58.6 | N/A | |
| Conservative | Rathy Alagaratnam | 420 | 17.7 | N/A | |
| Conservative | Angela Cahill | 395 | 16.7 | N/A | |
| Green | George Burridge | 365 | 15.4 | N/A | |
| Conservative | Fred Rushton | 322 | 13.6 | N/A | |
| Liberal Democrats | Elizabeth Barker | 271 | 11.4 | N/A | |
| Liberal Democrats | Simon Parritt | 166 | 7.0 | N/A | |
| Liberal Democrats | Benedict Fletcher | 117 | 4.9 | N/A | |
| Turnout | 2,371 | 29.6 | |||
| Labour hold | |||||
| Labour hold | |||||
| Labour hold | |||||
Longthornton
| Party | Candidate | Votes | % | ±% | |
|---|---|---|---|---|---|
| Labour | Brenda Fraser* | 1,869 | 72.2 | N/A | |
| Labour | Ross Garrod | 1,662 | 64.2 | N/A | |
| Labour | Marsie Skeete* | 1,584 | 61.2 | N/A | |
| Conservative | Brian Lewis-Lavender | 453 | 17.5 | N/A | |
| Conservative | Delvalee Willie | 425 | 16.4 | N/A | |
| Conservative | Michael Ormrod | 417 | 16.1 | N/A | |
| Green | Leila Boyd | 332 | 12.8 | N/A | |
| Liberal Democrats | Simon Jones | 217 | 8.4 | N/A | |
| Liberal Democrats | Nicholas Harris | 198 | 7.6 | N/A | |
| Liberal Democrats | Kaweh Beheshtizadeh | 191 | 7.4 | N/A | |
| Turnout | 2,590 | 32.1 | |||
| Labour hold | |||||
| Labour hold | |||||
| Labour hold | |||||
Lower Morden
| Party | Candidate | Votes | % | ±% | |
|---|---|---|---|---|---|
| Labour | Sally Kenny* | 1,778 | 49.1 | N/A | |
| Labour | James Williscroft | 1,599 | 44.1 | N/A | |
| Conservative | Eleanor Cox | 1,536 | 42.4 | N/A | |
| Labour | Miran Hassan | 1,531 | 42.3 | N/A | |
| Conservative | Andrew Cunningham | 1,490 | 41.1 | N/A | |
| Conservative | James Bogle | 1,469 | 40.5 | N/A | |
| Green | Martin Astrand | 384 | 10.6 | N/A | |
| Liberal Democrats | Gabriel Luck | 271 | 7.5 | N/A | |
| Liberal Democrats | Nicholas Miles | 216 | 6.0 | N/A | |
| Liberal Democrats | Jean-Bernard Tanqueray | 187 | 5.2 | N/A | |
| Turnout | 3,623 | 43.1 | |||
| Labour hold | |||||
| Labour hold | |||||
| Conservative gain from Labour | |||||
Merton Park
| Party | Candidate | Votes | % | ±% | |
|---|---|---|---|---|---|
| Merton Park Residents | Edward Foley* | 1,853 | 61.1 | N/A | |
| Merton Park Residents | Stephen Mercer | 1,723 | 56.8 | N/A | |
| Labour | Deborah Chadwick | 575 | 19.0 | N/A | |
| Labour | Alex Harris | 498 | 16.4 | N/A | |
| Conservative | Abdul Latif | 346 | 11.4 | N/A | |
| Conservative | Najeeb Latif* | 333 | 11.0 | N/A | |
| Liberal Democrats | Emma Maddison | 293 | 9.7 | N/A | |
| Liberal Democrats | Christopher Oxford | 177 | 5.8 | N/A | |
| Green | Keiren O'Brien | 173 | 5.7 | N/A | |
| Turnout | 3,031 | 50.2 | |||
| Merton Park Residents hold | |||||
| Merton Park Residents hold | |||||
Pollards Hill
| Party | Candidate | Votes | % | ±% | |
|---|---|---|---|---|---|
| Labour | Joan Henry* | 1,930 | 78.1 | N/A | |
| Labour | Martin Whelton* | 1,786 | 72.2 | N/A | |
| Labour | Aidan Mundy* | 1,785 | 72.2 | N/A | |
| Conservative | Daniel Amona | 366 | 14.8 | N/A | |
| Conservative | Anthony Cole | 351 | 14.2 | N/A | |
| Conservative | Beth Mitchell | 343 | 13.9 | N/A | |
| Green | Margaret Rogers | 174 | 7.0 | N/A | |
| Liberal Democrats | Toni Borrow | 125 | 5.1 | N/A | |
| Liberal Democrats | Mary-Jane Jeanes | 122 | 4.9 | N/A | |
| Liberal Democrats | Matthew Payne | 89 | 3.6 | N/A | |
| Turnout | 2,472 | 30.4 | |||
| Labour hold | |||||
| Labour hold | |||||
| Labour hold | |||||
Ravensbury
| Party | Candidate | Votes | % | ±% | |
|---|---|---|---|---|---|
| Labour | Caroline Charles | 1,504 | 68.4 | N/A | |
| Labour | Stephen Alambritis* | 1,497 | 68.1 | N/A | |
| Labour | Peter McCabe* | 1,346 | 61.2 | N/A | |
| Conservative | Sarah Holmes | 385 | 17.5 | N/A | |
| Conservative | Rory Holdt | 355 | 16.1 | N/A | |
| Conservative | Thomas Moulton | 337 | 15.3 | N/A | |
| Green | Karen Ohara | 294 | 13.4 | N/A | |
| Liberal Democrats | Sarah Weber | 192 | 8.7 | N/A | |
| Liberal Democrats | Stephen Harbron | 173 | 7.9 | N/A | |
| Liberal Democrats | Hamish Norbrook | 153 | 7.0 | N/A | |
| Turnout | 2,199 | 32.8 | |||
| Labour hold | |||||
| Labour hold | |||||
| Labour hold | |||||
Raynes Park
| Party | Candidate | Votes | % | ±% | |
|---|---|---|---|---|---|
| Liberal Democrats | Victoria Wilson | 1,819 | 44.9 | N/A | |
| Liberal Democrats | Chessie Flack | 1,796 | 44.3 | N/A | |
| Liberal Democrats | Matthew Willis | 1,753 | 43.2 | N/A | |
| Conservative | David Dean* | 1,287 | 31.7 | N/A | |
| Conservative | Adam Bush* | 1,264 | 31.2 | N/A | |
| Conservative | Omar Bush* | 1,223 | 30.2 | N/A | |
| Labour | Becky Hooper | 767 | 18.9 | N/A | |
| Labour | Wayne Busbridge | 707 | 17.4 | N/A | |
| Labour | Harry Platts | 662 | 16.3 | N/A | |
| Green | Peter Gay | 421 | 10.4 | N/A | |
| Turnout | 4,054 | 46.9 | |||
| Liberal Democrats gain from Conservative | |||||
| Liberal Democrats gain from Conservative | |||||
| Liberal Democrats gain from Conservative | |||||
St Helier
| Party | Candidate | Votes | % | ±% | |
|---|---|---|---|---|---|
| Labour | Helena Dollimore* | 1,393 | 60.8 | N/A | |
| Labour | Andrew Judge | 1,262 | 55.1 | N/A | |
| Labour | Dennis Pearce* | 1,258 | 54.9 | N/A | |
| Conservative | Olivia Barlow | 475 | 20.7 | N/A | |
| Conservative | Stephen Crowe* | 415 | 18.1 | N/A | |
| Green | Pippa Maslin | 386 | 16.8 | N/A | |
| Conservative | Inam Bokth | 380 | 16.6 | N/A | |
| Green | Rachel Brooks | 340 | 14.8 | N/A | |
| Green | James Rae | 227 | 9.9 | N/A | |
| Liberal Democrats | Vivian Vella | 151 | 6.6 | N/A | |
| Liberal Democrats | Richard Shillito | 149 | 6.5 | N/A | |
| Liberal Democrats | Guy Weston | 117 | 5.1 | N/A | |
| Turnout | 2,291 | 30.3 | |||
| Labour hold | |||||
| Labour hold | |||||
| Labour hold | |||||
Village
| Party | Candidate | Votes | % | ±% | |
|---|---|---|---|---|---|
| Conservative | Thomas Barlow* | 1,931 | 50.6 | N/A | |
| Conservative | Max Austin | 1,909 | 50.0 | N/A | |
| Conservative | Andrew Howard* | 1,850 | 48.5 | N/A | |
| Liberal Democrats | Fergus Kirman | 1,254 | 32.9 | N/A | |
| Liberal Democrats | Alexander Gallagher | 1,223 | 32.1 | N/A | |
| Liberal Democrats | Tom Williams | 1,166 | 30.6 | N/A | |
| Labour | Shirley Pritchard | 495 | 13.0 | N/A | |
| Labour | Franca Ofeimu | 465 | 12.2 | N/A | |
| Labour | Geoffrey Thomas | 445 | 11.7 | N/A | |
| Green | Sonja Timpson | 433 | 11.3 | N/A | |
| Turnout | 3,815 | 44.6 | |||
| Conservative hold | |||||
| Conservative hold | |||||
| Conservative hold | |||||
Wandle
| Party | Candidate | Votes | % | ±% | |
|---|---|---|---|---|---|
| Liberal Democrats | Kirsten Galea | 755 | 34.5 | N/A | |
| Labour | Eleanor Stringer* | 740 | 33.8 | N/A | |
| Labour | Mark Allison* | 727 | 33.2 | N/A | |
| Liberal Democrats | Philip Ling | 673 | 30.7 | N/A | |
| Conservative | Guy Lockwood | 513 | 23.4 | N/A | |
| Conservative | Calum McGrath | 472 | 21.6 | N/A | |
| Green | Mehmood Naqshbandi | 253 | 11.6 | N/A | |
| Green | Benjamin Smith | 166 | 7.6 | N/A | |
| Turnout | 2,189 | 46.6 | |||
| Liberal Democrats win (new seat) | |||||
| Labour win (new seat) | |||||
West Barnes
| Party | Candidate | Votes | % | ±% | |
|---|---|---|---|---|---|
| Liberal Democrats | Hina Bokhari* | 1,655 | 46.2 | N/A | |
| Liberal Democrats | John Oliver | 1,612 | 45.0 | N/A | |
| Liberal Democrats | Robert Page | 1,348 | 37.7 | N/A | |
| Conservative | Gilli Lewis-Lavender | 1,114 | 31.1 | N/A | |
| Conservative | Lily Alimi | 1,038 | 29.0 | N/A | |
| Conservative | Joseph Hackett | 1,034 | 28.9 | N/A | |
| Labour | Tessa Tyler Todd | 711 | 19.9 | N/A | |
| Labour | Rob Newbery | 701 | 19.6 | N/A | |
| Labour | Ben Butler* | 691 | 19.3 | N/A | |
| Green | John Barraball | 441 | 12.3 | N/A | |
| Turnout | 3,580 | 47.3 | |||
| Liberal Democrats hold | |||||
| Liberal Democrats hold | |||||
| Liberal Democrats hold | |||||
Wimbledon Park
| Party | Candidate | Votes | % | ±% | |
|---|---|---|---|---|---|
| Liberal Democrats | Jil Hall | 1,451 | 42.1 | N/A | |
| Liberal Democrats | Samantha MacArthur | 1,377 | 39.9 | N/A | |
| Liberal Democrats | Tony Reiss | 1,358 | 39.4 | N/A | |
| Conservative | Ed Gretton* | 1,056 | 30.6 | N/A | |
| Conservative | Oonagh Moulton* | 1,053 | 30.5 | N/A | |
| Conservative | Janice Howard* | 988 | 28.6 | N/A | |
| Labour | Hugh Constant | 783 | 22.7 | N/A | |
| Labour | Pam Treanor | 711 | 20.6 | N/A | |
| Labour | Motiur Rahman | 621 | 18.0 | N/A | |
| Green | Juliet Boyd | 593 | 17.2 | N/A | |
| Turnout | 3,449 | 44.6 | |||
| Liberal Democrats gain from Conservative | |||||
| Liberal Democrats gain from Conservative | |||||
| Liberal Democrats gain from Conservative | |||||
Wimbledon Town & Dundonald
| Party | Candidate | Votes | % | ±% | |
|---|---|---|---|---|---|
| Liberal Democrats | Paul Kohler* | 2,637 | 58.8 | N/A | |
| Liberal Democrats | Anthony Fairclough* | 2,463 | 54.9 | N/A | |
| Liberal Democrats | Simon McGrath* | 2,252 | 50.2 | N/A | |
| Conservative | Suzanne Grocott | 1,144 | 25.5 | N/A | |
| Conservative | James Holmes* | 1,053 | 23.5 | N/A | |
| Conservative | Michael Bull | 1,041 | 23.2 | N/A | |
| Labour | Abigail Jones | 704 | 15.7 | N/A | |
| Labour | Terry Daniels | 583 | 13.0 | N/A | |
| Green | Laura Collins | 572 | 12.8 | N/A | |
| Labour | Devina Paul | 553 | 12.3 | N/A | |
| Turnout | 4,485 | 51.0 | |||
| Liberal Democrats win (new seat) | |||||
| Liberal Democrats win (new seat) | |||||
| Liberal Democrats win (new seat) | |||||
References
- ^ Grafton-Green, Chloe Chaplain, Patrick (5 May 2018). "The full list of results for London's local elections". www.standard.co.uk. Retrieved 20 October 2021.
{{cite web}}: CS1 maint: multiple names: authors list (link) - ^ Holder, Josh. "Local council elections 2018 – results in full". the Guardian. Retrieved 20 October 2021.
- ^ "Cannon Hill councillor quits citing health concerns as opposition call out 'division in Wimbledon Labour'". Wimbledon Times. Retrieved 20 October 2021.
- ^ Baston, Lewis (21 June 2019). "Merton: Lib Dem gain in Cannon Hill by-election is blow for Labour and worrying for local Tory MP". OnLondon. Retrieved 20 October 2021.
- ^ O'Connor, Tara (16 June 2020). "Merton Lib Dem councillor joins Labour". MyLondon. Retrieved 20 October 2021.
- ^ O'Connor, Tara (11 March 2021). "A Merton councillor has resigned prompting a by-election". MyLondon. Retrieved 20 October 2021.
- ^ "London Elections 2021 Day Two: By-election round-up". South West Londoner. 8 May 2021. Retrieved 20 October 2021.
- ^ "Mark Allison is named new leader of Merton council – and his cabinet is most diverse in borough's history". South London News. 20 November 2020. Retrieved 20 October 2021.
- ^ "LGBCE | Merton | LGBCE Site". www.lgbce.org.uk. Retrieved 20 October 2021.
- ^ a b "How the elections work | London Councils". www.londoncouncils.gov.uk. Retrieved 14 September 2021.
- ^ "Merton result - Local Elections 2022". BBC News.
- ^ "Election results for Abbey". Merton Borough Council. 5 May 2022. Retrieved 7 May 2022.
- ^ "Election results for Cannon Hill". Merton Borough Council. 5 May 2022. Retrieved 7 May 2022.
- ^ "Election results for Colliers Wood". Merton Borough Council. 5 May 2022. Retrieved 7 May 2022.
- ^ "Election results for Cricket Green". Merton Borough Council. 5 May 2022. Retrieved 7 May 2022.
- ^ "Election results for Figge's Marsh". Merton Borough Council. 5 May 2022. Retrieved 7 May 2022.
- ^ "Election results for Graveney". Merton Borough Council. 5 May 2022. Retrieved 7 May 2022.
- ^ "Election results for Hillside". Merton Borough Council. 5 May 2022. Retrieved 7 May 2022.
- ^ "Election results for Lavender Fields". Merton Borough Council. 5 May 2022. Retrieved 7 May 2022.
- ^ "Election results for Longthornton". Merton Borough Council. 5 May 2022. Retrieved 7 May 2022.
- ^ "Election results for Lower Morden". Merton Borough Council. 5 May 2022. Retrieved 7 May 2022.