
| |||||||||||||||||||||||||||||||||||||
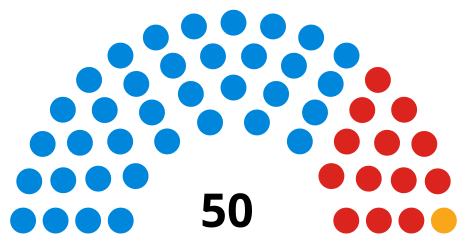
All 50 council seats | |||||||||||||||||||||||||||||||||||||
|---|---|---|---|---|---|---|---|---|---|---|---|---|---|---|---|---|---|---|---|---|---|---|---|---|---|---|---|---|---|---|---|---|---|---|---|---|---|
| |||||||||||||||||||||||||||||||||||||
 Results of the 2022 Kensington and Chelsea London Borough council election. Conservatives in blue, Labour in red and Liberal Democrats in yellow. | |||||||||||||||||||||||||||||||||||||
| |||||||||||||||||||||||||||||||||||||
The 2022 Kensington and Chelsea London Borough Council election was held on 5 May 2022. All 50 members of Kensington and Chelsea London Borough Council were elected. The elections took place alongside local elections in the other London boroughs and elections to local authorities across the United Kingdom.
The Conservative party lost one seat to the Liberal Democrats, but maintained their majority on the council.
Background
History

The thirty-two London boroughs were established in 1965 by the London Government Act 1963. They are the principal authorities in Greater London and have responsibilities including education, housing, planning, highways, social services, libraries, recreation, waste, environmental health and revenue collection. Some of the powers are shared with the Greater London Authority, which also manages passenger transport, police, and fire.[1]
Kensington and Chelsea has been under Conservative control since its establishment. In the most recent election in 2018, the Conservatives won 36 seats with 51.4% of the vote across the borough; Labour won 13 seats with 33.0% of the vote and the Liberal Democrats won a single seat with 12.4% of the vote.[2] The council had been a target for the Labour Party, who had been expected to perform better following the 2017 Grenfell Tower fire.[2]
Council term
A Labour councillor for Dalgarno ward, Robert Thomson, resigned in early 2019 because his job required him to relocate. A by-election was held to fill his seat on 21 March 2019, which was won by the Labour candidate Kasim Ali with the Conservatives coming in second place.[3]
Unlike most London boroughs, Kensington and Chelsea continued with the same ward boundaries it elected councillors under in 2018 as it had been subject to a recent boundary review.
Electoral process
Kensington and Chelsea, as with all other London borough councils, elects all of its councillors at once every four years, with the previous election having taken place in 2018. The election took place by multi-member plurality block voting, with each ward being represented by two or three councillors. Electors had as many votes as there are councillors to be elected in their ward, with the top two or three being elected.
All registered electors (British, Irish, Commonwealth and European Union citizens) living in London aged 18 or over were entitled to vote in the election. People who lived at two addresses in different councils, such as university students with different term-time and holiday addresses, were entitled to be registered for and vote in elections in both local authorities.[4] Voting in-person at polling stations took place from 7:00 to 22:00 on election day, and voters were able to apply for postal votes or proxy votes in advance of the election.[4]
Previous council composition
-
 Councillors after the 2018 election

| After 2018 election | Before 2022 election | ||||
|---|---|---|---|---|---|
| Party | Seats | Party | Seats | ||
| Conservative | 36 | Conservative | 35 | ||
| Labour | 13 | Labour | 13 | ||
| Liberal Democrats | 1 | Liberal Democrats | 2 | ||
Overall Results
| Party | Seats | Gains | Losses | Net gain/loss | Seats % | Votes % | Votes | +/− | |
|---|---|---|---|---|---|---|---|---|---|
| Conservative | 35 | 0 | 1 | -1 | 70.0 | 48.7 | 40,363 | -2.7 | |
| Labour | 13 | 0 | 0 | 0 | 26.0 | 33.6 | 27,811 | +0.6 | |
| Liberal Democrats | 2 | 1 | 0 | +1 | 4.0 | 15.9 | 13,134 | +2.5 | |
| Green | 0 | 0 | 0 | 0 | 0.0 | 1.4 | 1,140 | +1.0 | |
| Independent | 0 | 0 | 0 | 0 | 0.0 | 0.5 | 388 | +0.4 | |
Results by ward
Abingdon
[6]| Party | Candidate | Votes | % | ±% | |
|---|---|---|---|---|---|
| Conservative | Sarah Addenbrooke | 1,019 | 60.0 | -6.2 | |
| Conservative | Anne Cyron | 964 | 56.5 | -5.9 | |
| Conservative | James Husband | 915 | 53.6 | -8.1 | |
| Labour | Manju Gregory | 374 | 21.9 | +4.4 | |
| Labour | Nasrin Lari | 342 | 20.0 | +3.0 | |
| Liberal Democrats | Jeremy Good | 335 | 19.6 | +5.0 | |
| Labour | Bora Ristic | 335 | 19.6 | +4.4 | |
| Liberal Democrats | Jonathan Owen | 330 | 19.3 | +5.1 | |
| Liberal Democrats | Peter Kosta | 279 | 16.3 | +0.2 | |
| Turnout | 32.2 | ||||
| Conservative hold | Swing | ||||
| Conservative hold | Swing | ||||
| Conservative hold | Swing | ||||
Brompton and Hans Town
[7]| Party | Candidate | Votes | % | ±% | |
|---|---|---|---|---|---|
| Conservative | Walaa Idris | 1,044 | 64.2 | -6.3 | |
| Conservative | Sof McVeigh | 1,040 | 63.9 | -5.6 | |
| Conservative | Mary Weale | 1,032 | 63.4 | -6.2 | |
| Labour | Marian Kearney | 279 | 17.1 | +1.9 | |
| Labour | Monica Preston | 267 | 16.4 | +1.4 | |
| Liberal Democrats | Maurizio Campolo | 266 | 16.3 | +4.1 | |
| Labour | Karl-Eric Cheron | 266 | 16.3 | +1.6 | |
| Liberal Democrats | Ewen Cameron | 261 | 16.0 | +7.4 | |
| Liberal Democrats | Robert Woodthorpe Browne | 225 | 13.8 | +5.5 | |
| Turnout | 28.9 | ||||
| Conservative hold | Swing | ||||
| Conservative hold | Swing | ||||
| Conservative hold | Swing | ||||
Campden
[8]| Party | Candidate | Votes | % | ±% | |
|---|---|---|---|---|---|
| Conservative | Catherine Faulks | 1,122 | 58.6 | -4.9 | |
| Conservative | Preety Hudd | 1,026 | 53.6 | -9.8 | |
| Conservative | Lloyd North | 995 | 52.0 | -7.8 | |
| Labour | Margaret McDonald | 417 | 21.8 | +8.6 | |
| Labour | Heathcote Ruthann | 365 | 19.1 | +6.1 | |
| Liberal Democrats | Juan Carrizosa | 343 | 17.9 | +2.8 | |
| Liberal Democrats | Elizabeth Wade | 341 | 17.8 | +4.8 | |
| Labour | Tabatha Vaughan | 333 | 17.4 | +2.6 | |
| Green | Luke Douglas-Home | 294 | 15.4 | N/A | |
| Liberal Democrats | Christopher Coplans | 292 | 15.3 | +4.2 | |
| Turnout | 35.6 | ||||
| Conservative hold | Swing | ||||
| Conservative hold | Swing | ||||
| Conservative hold | Swing | ||||
Chelsea Riverside
[9]| Party | Candidate | Votes | % | ±% | |
|---|---|---|---|---|---|
| Conservative | Laura Burns | 1,007 | 46.8 | -1.6 | |
| Conservative | Gerard Hargreaves | 941 | 43.7 | -3.4 | |
| Conservative | Sonia Zvedeniuk | 923 | 42.9 | -4.4 | |
| Labour | Jake Thomas | 819 | 38.0 | +1.1 | |
| Labour | Mike Coelho | 805 | 36.7 | -0.1 | |
| Labour | Cihan Cheron | 722 | 32.9 | -3.6 | |
| Liberal Democrats | Margo Schwartz | 643 | 29.3 | +19.6 | |
| Turnout | 35.9 | ||||
| Conservative hold | Swing | ||||
| Conservative hold | Swing | ||||
| Conservative hold | Swing | ||||
Colville
[10]| Party | Candidate | Votes | % | ±% | |
|---|---|---|---|---|---|
| Labour | Toby Benton | 1,108 | 59.8 | +5.1 | |
| Labour | Mohammed Bakhtiar | 1,091 | 58.9 | +7.2 | |
| Labour | Dahabo Isse | 1,014 | 54.8 | +4.4 | |
| Conservative | Ellie Lines | 458 | 24.7 | -3.1 | |
| Conservative | Roni Greenfield | 453 | 24.4 | -0.9 | |
| Conservative | Becky Walsh | 441 | 23.8 | -0.2 | |
| Liberal Democrats | Josie Mayers | 298 | 16.1 | +3.7 | |
| Liberal Democrats | Jules Lipton | 257 | 13.9 | +2.3 | |
| Liberal Democrats | Alex Nowak | 226 | 12.2 | +2.7 | |
| Turnout | 29.6 | ||||
| Labour hold | Swing | ||||
| Labour hold | Swing | ||||
| Labour hold | Swing | ||||
Courtfield
[11]| Party | Candidate | Votes | % | ±% | |
|---|---|---|---|---|---|
| Conservative | Janet Evans | 1,068 | 59.6 | -9.4 | |
| Conservative | Greg Hammond | 1,037 | 57.8 | -10.3 | |
| Conservative | Quentin Marshall | 947 | 52.8 | -13.8 | |
| Liberal Democrats | Marc Goldfinger | 740 | 41.3 | +27.1 | |
| Labour | Fatima Kara | 282 | 15.7 | +4.0 | |
| Labour | Marius Brill | 270 | 15.1 | +4.4 | |
| Labour | Rene Gimpel | 270 | 15.1 | +2.4 | |
| Turnout | 32.8 | ||||
| Conservative hold | Swing | ||||
| Conservative hold | Swing | ||||
| Conservative hold | Swing | ||||
Dalgarno
[12]| Party | Candidate | Votes | % | ±% | |
|---|---|---|---|---|---|
| Labour | Kasim Ali | 867 | 60.2 | -13.5 | |
| Labour | Eva Jedut | 837 | 58.1 | -7.4 | |
| Conservative | Theodore Karpinksi | 316 | 21.9 | -1.1 | |
| Conservative | Anjulika Vatish | 276 | 19.2 | +0.8 | |
| Liberal Democrats | Alexandra Tatton-Brown | 159 | 11.0 | +3.0 | |
| Independent | Delores Patterson | 156 | 10.8 | N/A | |
| Independent | Philip Williams | 155 | 10.8 | N/A | |
| Turnout | 31.7 | ||||
| Labour hold | Swing | ||||
| Labour hold | Swing | ||||
Earl's Court
[13]| Party | Candidate | Votes | % | ±% | |
|---|---|---|---|---|---|
| Liberal Democrats | Linda Wade | 1,048 | 51.1 | +5.8 | |
| Liberal Democrats | Tim Verboven | 757 | 36.9 | +11.2 | |
| Conservative | Hamish Adourian | 705 | 34.4 | +2.1 | |
| Liberal Democrats | Christophe Noblet | 699 | 34.1 | +10.1 | |
| Conservative | Stéphanie Petit | 674 | 32.8 | -5.8 | |
| Conservative | Max Chauhan | 608 | 29.6 | -2.3 | |
| Labour | Bruno Diantantou | 415 | 20.2 | -5.6 | |
| Labour | Sharda Rowena | 398 | 19.4 | -5.9 | |
| Labour | John Winter | 286 | 13.9 | -6.5 | |
| Green | Erwin Schaeffer | 209 | 10.2 | +0.8 | |
| Turnout | 34.2 | ||||
| Liberal Democrats hold | Swing | ||||
| Liberal Democrats gain from Conservative | Swing | ||||
| Conservative hold | Swing | ||||
Golborne
[14]| Party | Candidate | Votes | % | ±% | |
|---|---|---|---|---|---|
| Labour | Mona Adam | 1,036 | 69.1 | -8.4 | |
| Labour | Sina Lari | 1,005 | 67.0 | -1.9 | |
| Labour | Abdullahi Nur | 950 | 63.4 | -10.1 | |
| Conservative | Elizabeth Acka | 297 | 19.8 | +5.7 | |
| Conservative | Margaret Parker | 278 | 18.5 | +5.5 | |
| Conservative | Michael Walsh | 259 | 17.3 | +5.4 | |
| Liberal Democrats | Sheila McGuirk | 160 | 10.7 | +2.8 | |
| Liberal Democrats | William Somers | 133 | 8.9 | +2.8 | |
| Turnout | 25.2 | ||||
| Labour hold | Swing | ||||
| Labour hold | Swing | ||||
| Labour hold | Swing | ||||
Holland
[15]| Party | Candidate | Votes | % | ±% | |
|---|---|---|---|---|---|
| Conservative | Lucinda Knight | 1,049 | 52.1 | -0.2 | |
| Conservative | Johnny Thalassites | 1,019 | 50.6 | +0.5 | |
| Conservative | Aarien Areti | 993 | 49.3 | -3.5 | |
| Labour | Samantha Batra | 731 | 36.3 | +2.9 | |
| Labour | Nathaniel McBride | 654 | 32.5 | +2.4 | |
| Labour | Axel Landin | 650 | 32.3 | +0.4 | |
| Liberal Democrats | Hugh Lalor | 241 | 12.0 | +0.9 | |
| Liberal Democrats | Noel McNamara | 241 | 12.0 | -1.3 | |
| Liberal Democrats | Leopold Rupf | 189 | 9.4 | N/A | |
| Turnout | 35.9 | ||||
| Conservative hold | Swing | ||||
| Conservative hold | Swing | ||||
| Conservative hold | Swing | ||||
Norland
[16]| Party | Candidate | Votes | % | ±% | |
|---|---|---|---|---|---|
| Conservative | David Lindsay | 787 | 49.2 | -9.6 | |
| Conservative | Stuart Graham | 738 | 46.2 | -11.3 | |
| Labour | Sylvia Parnell | 355 | 22.2 | -1.6 | |
| Green | Fabien Frenzel | 338 | 21.1 | N/A | |
| Green | Angela Georgievski | 299 | 18.7 | N/A | |
| Labour | Bernard Shaw | 289 | 18.1 | -3.0 | |
| Liberal Democrats | Tom Fox | 162 | 10.1 | -1.8 | |
| Liberal Democrats | Blanche Girouard | 157 | 9.8 | -0.6 | |
| Turnout | 41.6 | ||||
| Conservative hold | Swing | ||||
| Conservative hold | Swing | ||||
Notting Dale
[17]| Party | Candidate | Votes | % | ±% | |
|---|---|---|---|---|---|
| Labour | Claire Simmons | 1,200 | 68.4 | -3.9 | |
| Labour | Mona Ahmed | 1,180 | 67.3 | -0.8 | |
| Labour | Marwan Elnaghi | 1,162 | 66.2 | -1.1 | |
| Conservative | Filippo Salamone | 329 | 18.8 | +1.5 | |
| Conservative | Mehreen Malik | 314 | 17.9 | +1.0 | |
| Conservative | Sasi Kamaladasan | 300 | 17.1 | +0.8 | |
| Liberal Democrats | Rosemary Somers | 194 | 11.1 | +6.0 | |
| Liberal Democrats | Philip Chenery | 191 | 10.9 | +1.7 | |
| Liberal Democrats | Yury Kanavalau | 125 | 7.1 | N/A | |
| Turnout | 30.6 | ||||
| Labour hold | Swing | ||||
| Labour hold | Swing | ||||
| Labour hold | Swing | ||||
Pembridge
[18]| Party | Candidate | Votes | % | ±% | |
|---|---|---|---|---|---|
| Conservative | Joanna Gardner | 609 | 46.8 | -6.9 | |
| Conservative | Dori Schmetterling | 560 | 43.0 | -7.8 | |
| Liberal Democrats | Sam Dodgshon | 448 | 34.4 | +17.6 | |
| Labour | Lorna Kelly | 393 | 30.1 | +1.5 | |
| Labour | Jonathan Daniels | 386 | 29.6 | +4.7 | |
| Turnout | 36.5 | ||||
| Conservative hold | Swing | ||||
| Conservative hold | Swing | ||||
Queen's Gate
[19]| Party | Candidate | Votes | % | ±% | |
|---|---|---|---|---|---|
| Conservative | Roberto Weeden-Sanz | 966 | 59.0 | -8.7 | |
| Conservative | Will Lane | 955 | 58.3 | -8.4 | |
| Conservative | Sam Mackover | 942 | 57.5 | -8.9 | |
| Liberal Democrats | Blaise Baquiche | 548 | 33.5 | +15.6 | |
| Labour | Lenore Robinson | 331 | 20.2 | +6.1 | |
| Labour | Tim Thomas | 260 | 15.9 | +2.4 | |
| Labour | Hassan Muhammad | 252 | 15.4 | +2.8 | |
| Turnout | 34.7 | ||||
| Conservative hold | Swing | ||||
| Conservative hold | Swing | ||||
| Conservative hold | Swing | ||||
Redcliffe
[20]| Party | Candidate | Votes | % | ±% | |
|---|---|---|---|---|---|
| Conservative | Thomas Bennett | 1,038 | 55.5 | -6.9 | |
| Conservative | Marie-Therese Rossi | 973 | 52.1 | -8.7 | |
| Conservative | Sidney Yankson | 883 | 47.2 | -9.4 | |
| Liberal Democrats | Jean-Francois Burford | 634 | 33.9 | +18.5 | |
| Labour | Anne Corbett | 494 | 26.4 | +6.9 | |
| Labour | Otto Barrow | 407 | 21.8 | +5.3 | |
| Labour | Alfie Gee | 364 | 19.5 | +3.1 | |
| Turnout | 30.6 | ||||
| Conservative hold | Swing | ||||
| Conservative hold | Swing | ||||
| Conservative hold | Swing | ||||
Royal Hospital
[21]| Party | Candidate | Votes | % | ±% | |
|---|---|---|---|---|---|
| Conservative | Elizabeth Campbell | 1,387 | 69.0 | -5.8 | |
| Conservative | Emma Will | 1,309 | 65.1 | -6.2 | |
| Conservative | Cem Kemahli | 1,261 | 62.7 | -7.1 | |
| Liberal Democrats | Jean Goodliffe | 326 | 16.2 | +6.5 | |
| Liberal Democrats | Penny Pocock | 315 | 15.7 | +4.3 | |
| Labour | David Kear | 307 | 15.3 | +1.6 | |
| Labour | Pat Mason | 283 | 14.1 | +0.5 | |
| Labour | Soushian Samadi | 281 | 14.0 | +0.7 | |
| Liberal Democrats | Theodore Goodliffe | 265 | 13.2 | +3.7 | |
| Turnout | 32.7 | ||||
| Conservative hold | Swing | ||||
| Conservative hold | Swing | ||||
| Conservative hold | Swing | ||||
St Helen's
[22]| Party | Candidate | Votes | % | ±% | |
|---|---|---|---|---|---|
| Labour | Emma Dent Coad | 811 | 52.1 | -0.4 | |
| Labour | Portia Thaxter | 739 | 47.5 | -1.8 | |
| Conservative | Miloud Bouhaddou | 522 | 33.5 | +3.5 | |
| Conservative | Maxwell Woodger | 521 | 33.5 | -0.2 | |
| Liberal Democrats | Carmel McLoughlin | 167 | 10.7 | -3.2 | |
| Liberal Democrats | Jibril Al-Nabahani | 118 | 7.6 | -3.0 | |
| Independent | Eve Allison | 77 | 4.9 | -28.8 | |
| Turnout | 36.2 | ||||
| Labour hold | Swing | ||||
| Labour hold | Swing | ||||
Stanley
[23]| Party | Candidate | Votes | % | ±% | |
|---|---|---|---|---|---|
| Conservative | Kim Taylor-Smith | 1,031 | 55.9 | -4.3 | |
| Conservative | Josh Rendall | 1,027 | 55.7 | -5.2 | |
| Conservative | Will Pascall | 1,005 | 54.5 | -5.4 | |
| Labour | Leon Garner | 465 | 25.2 | +2.4 | |
| Liberal Democrats | Helena Marconell | 402 | 21.8 | +13.2 | |
| Labour | Abdulmajid Malin | 373 | 20.2 | -1.5 | |
| Liberal Democrats | Jose Buera Cienfuegos-Jovellanos | 312 | 16.9 | +9.2 | |
| Liberal Democrats | Carl Michel | 307 | 16.7 | +7.6 | |
| Labour | Peerzada Bukhari | 291 | 15.8 | -5.6 | |
| Turnout | 30.1 | ||||
| Conservative hold | Swing | ||||
| Conservative hold | Swing | ||||
| Conservative hold | Swing | ||||
References
- ^ "The essential guide to London local government | London Councils". www.londoncouncils.gov.uk. Retrieved 10 October 2021.
- ^ a b "Tories keep hold of Kensington and Chelsea council despite public outrage over Grenfell Tower tragedy". The Independent. 4 May 2018. Archived from the original on 12 May 2018. Retrieved 19 October 2021.
- ^ Gregory, Julia (22 March 2019). "Former advisor to Somalian president takes Labour seat in Kensington". MyLondon. Retrieved 19 October 2021.
- ^ a b "How the elections work | London Councils". www.londoncouncils.gov.uk. Retrieved 14 September 2021.
- ^ "Local council elections 2018 - Results | Royal Borough of Kensington and Chelsea".
- ^ "Abingdon ward results | Royal Borough of Kensington and Chelsea". www.rbkc.gov.uk. Retrieved 6 May 2022.
- ^ "Brompton and Hans Town ward results | Royal Borough of Kensington and Chelsea". www.rbkc.gov.uk. Retrieved 6 May 2022.
- ^ "Campden ward results | Royal Borough of Kensington and Chelsea". www.rbkc.gov.uk. Retrieved 6 May 2022.
- ^ "Chelsea Riverside ward results | Royal Borough of Kensington and Chelsea". www.rbkc.gov.uk. Retrieved 6 May 2022.
- ^ "Colville ward results | Royal Borough of Kensington and Chelsea". www.rbkc.gov.uk. Retrieved 6 May 2022.
- ^ "Courtfield ward results | Royal Borough of Kensington and Chelsea". www.rbkc.gov.uk. Retrieved 6 May 2022.
- ^ "Dalgarno ward results | Royal Borough of Kensington and Chelsea". www.rbkc.gov.uk. Retrieved 6 May 2022.
- ^ "Earl's Court ward results | Royal Borough of Kensington and Chelsea". www.rbkc.gov.uk. Retrieved 6 May 2022.
- ^ "Golborne ward results | Royal Borough of Kensington and Chelsea". www.rbkc.gov.uk. Retrieved 6 May 2022.
- ^ "Holland ward results | Royal Borough of Kensington and Chelsea". www.rbkc.gov.uk. Retrieved 6 May 2022.
- ^ "Norland ward results | Royal Borough of Kensington and Chelsea". www.rbkc.gov.uk. Retrieved 6 May 2022.
- ^ "Notting Dale ward results | Royal Borough of Kensington and Chelsea". www.rbkc.gov.uk. Retrieved 6 May 2022.
- ^ "Pembridge ward results | Royal Borough of Kensington and Chelsea". www.rbkc.gov.uk. Retrieved 6 May 2022.
- ^ "Queen's Gate ward results | Royal Borough of Kensington and Chelsea". www.rbkc.gov.uk. Retrieved 6 May 2022.
- ^ "Redcliffe ward results | Royal Borough of Kensington and Chelsea". www.rbkc.gov.uk. Retrieved 6 May 2022.
- ^ "Royal Hospital ward results | Royal Borough of Kensington and Chelsea". www.rbkc.gov.uk. Retrieved 6 May 2022.
- ^ "St Helen's ward results | Royal Borough of Kensington and Chelsea". www.rbkc.gov.uk. Retrieved 6 May 2022.
- ^ "Stanley ward results | Royal Borough of Kensington and Chelsea". www.rbkc.gov.uk. Retrieved 6 May 2022.