
| 1977 Pacific hurricane season | |
|---|---|
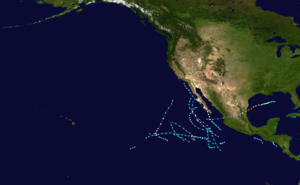 Season summary map | |
| Seasonal boundaries | |
| First system formed | May 26, 1977 |
| Last system dissipated | October 23, 1977 |
| Strongest storm | |
| Name | Florence |
| • Maximum winds | 105 mph (165 km/h) (1-minute sustained) |
| Seasonal statistics | |
| Total depressions | 17 |
| Total storms | 8 (record low, tied with 2010) |
| Hurricanes | 4 |
| Major hurricanes (Cat. 3+) | 0 (record low, tied with 2003) |
| Total fatalities | 8 total |
| Total damage | $39.6 million (1977 USD) |
| Related articles | |
The 1977 Pacific hurricane season stands alongside 2010 as the least active Pacific hurricane season since reliable records began in 1971.[1] Only eight tropical storms formed throughout the year; four further intensified into hurricanes, yet none strengthened into major hurricanes—a Category 3 or stronger on the Saffir–Simpson scale—an occurrence not seen again until 2003. Most tropical cyclones remained over the open eastern Pacific; however, the remnants of hurricanes Doreen and Heather led to heavy rainfall which damaged or destroyed structures and flooded roadways throughout the Southwest United States. Notably, Hurricane Anita which originally formed in the Gulf of Mexico made the rare trek across Mexico into the eastern Pacific, briefly existing as a tropical depression. Eight deaths were recorded while damage reached $39.6 million (1977 USD).
YouTube Encyclopedic
-
1/1Views:311
-
Atlantic Cyclone Tracks: 1925 Hurricane Season
Transcription
Seasonal summary

| Rank | Season | ACE value |
|---|---|---|
| 1 | 1977 | 22.3 |
| 2 | 2010 | 51.2 |
| 3 | 2007 | 51.6 |
| 4 | 1996 | 53.9 |
| 5 | 2003 | 56.6 |
| 6 | 1979 | 57.4 |
| 7 | 2004 | 71.1 |
| 8 | 1981 | 72.8 |
| 9 | 2013 | 74.8 |
| 10 | 2020 | 77.3 |
The 1977 Pacific hurricane season was an inactive season, with the first cyclone forming on May 26 and the final system dissipating on October 23. Only eight named storms were documented throughout the year. Of those eight, four intensified into hurricanes, and none became major hurricanes, defined as Category 3 storms or stronger on the Saffir–Simpson scale. The number of tropical storms and major hurricanes stood solely as record lows until tied by 2010 and 2003, respectively.
Additionally, the Accumulated Cyclone Energy (ACE) index for the season (Eastern Pacific and Central Pacific combined) as calculated by Colorado State University using data from the National Hurricane Center was 22.3 units.[nb 1][3] This ranked the season as the quietest Northeastern Pacific basin season on record.[4] The low activity seen in the East Pacific was a common occurrence around the globe in 1977, with the fewest tropical cyclones worldwide, at 69, until 2010 recorded one fewer.[5][6] May, June, July, and August all saw one named storm per month, with one hurricane each in the latter two months. September was more active with three named storms, of which one became a Category 2 hurricane. The season came to an end in October with one named storm which intensified into a hurricane. Despite the record low number of tropical storms, numerous short-lived tropical depressions existed throughout the eastern Pacific in 1977; like most of the other cyclones, however, these caused little or no impact to land.[7]
Systems
Tropical Storm Ava


An area of disturbed weather first formed within a larger thunderstorm complex well south-southwest of Acapulco, Mexico, early on May 24. It moved northwest and slowly organized,[7] becoming a tropical depression by 00:00 UTC on May 26 and further intensifying into Tropical Storm Ava approximately twelve hours later.[8] The system remained over warm waters as it moved west and then north, allowing Ava to reach a peak intensity of 65 mph (105 km/h) early on May 28. A series of subsequent reconnaissance aircraft missions documented an incomplete eye in association with the storm, although this organization soon began to fade amidst increasing wind shear and cooler ocean temperatures.[7] Ava weakened to a tropical depression around 18:00 UTC on May 29 and dissipated less than 24 hours later.[8]
Tropical Storm Bernice
| Tropical storm (SSHWS) | |
  | |
| Duration | June 25 – June 28 |
|---|---|
| Peak intensity | 40 mph (65 km/h) (1-min); |
A tropical disturbance was first identified early on June 25 well southwest of Acapulco, Mexico.[7] It quickly organized into a tropical depression twelve hours later while moving west-northwest. After strengthening into Tropical Storm Bernice around 12:00 UTC on June 26,[8] the cyclone was restricted from further development by the entrainment of low-level clouds from the north.[7] Instead, Bernice transitioned into an extratropical cyclone early on June 28.[8]
Hurricane Claudia
| Category 1 hurricane (SSHWS) | |
  | |
| Duration | July 3 – July 7 |
|---|---|
| Peak intensity | 90 mph (150 km/h) (1-min); |
A tropical disturbance, embedded within a larger area of convective activity, formed early on July 1 while well south of Acapulco, Mexico. On a westward heading,[7] the disturbance coalesced into a tropical depression by 00:00 UTC on June 3 and strengthened into Tropical Storm Claudia six hours later.[8] Rapid development ensued thereafter as an eye became evident on satellite imagery,[7] and Claudia attained its peak intensity as a strong Category 1 hurricane with winds of 90 mph (140 km/h) early on July 4. Progression over colder waters caused the system to weaken below hurricane strength by 00:00 UTC on July 5,[8] coincident with the eye becoming obscured on satellite.[7] The cyclone was downgraded to a tropical depression around 00:00 UTC on July 7, and it ultimately dissipated six hours later.[8]
Hurricane Doreen

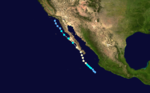
A tropical disturbance first formed early on August 11.[7] It drifted west and organized into a tropical depression around 00:00 UTC on August 13 before intensifying into Tropical Storm Doreen a little under a day later.[8] Data from a reconnaissance aircraft was used to upgrade the system to a Category 1 hurricane with winds of 75 mph (121 km/h) around 18:00 UTC on August 14;[8] this constituted the storm's peak strength. Doreen turned north-northwest thereafter, briefly drifting onshore the coastline of Baja California near San Carlos as a minimal hurricane.[7] It continued generally northwestward, weakening to a tropical storm around 06:00 UTC on August 16 before making a second landfall around Punta Eugenia, Baja California Sur six hours later.[8] Colder waters caused the system to fall to tropical depression intensity early on August 17 and dissipate around 00:00 UTC the next day while located just south of California.[7]
As Doreen moved parallel to the southwestern coastline of Mexico, it produced heavy rainfall there, with accumulations peaking at 14.80 inches (376 mm) near the Los Cabos Municipality.[9] Farther northwest, Mexicali, Baja California was particularly hard-hit, with more than 2,000 people left homeless after their shanty-style homes were demolished by the rain.[10] Despite dissipating as a tropical cyclone, the remnants of Doreen continued into the Southwest United States, resulting in maximum rainfall accumulations of 7.45 inches (189 mm) in the San Jacinto Mountains of California.[9] Approximately 325 homes and businesses throughout the desert Southwest were destroyed, and several roads were covered or washed out by floodwater across California and Arizona.[7] Throughout San Diego, California and nearby Imperial County, the storm accrued $25 million in crop damage.[10] Extensive damage to streets, washes, levees, and dikes occurred throughout the Mohave Valley, particularly in Bullhead City, Arizona, where more than 50 people were evacuated and over 12 homes and businesses were heavily damaged.[11] Strong thunderstorms, with winds reaching up to 60 mph (97 km/h), downed trees and caused intermittent power outages in Palm Springs, California.[12] Farther east in Las Vegas, Nevada, meanwhile, less than 2 inches (51 mm) of rain flooded major intersections and caused roofs to collapse. Throughout the region, eight people were reported dead.[10]
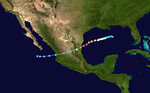
Tropical Depression Eleven
| Tropical depression (SSHWS) | |
  | |
| Duration | September 3 – September 4 |
|---|---|
| Peak intensity | 35 mph (55 km/h) (1-min); |
On August 29, a tropical depression formed over the Gulf of Mexico and tracked slowly west. It quickly strengthened, becoming named as Anita 18 hours later, and reaching hurricane strength within 30 hours of formation. It eventually achieved Category 5 status before striking northern Mexico on September 2. The mountainous terrain of Mexico nearly caused Anita to dissipate;[13] however, its circulation survived the crossing and emerged over the Pacific on September 3 as a tropical depression. The system featured a 300 miles (480 km) wide area of convection and traveled west in response to a ridge over Baja California. The depression traversed Islas Marías and soon moved over cooler waters, prompting weakening. Lacking thermal support, the depression degenerated into a remnant low on September 3 off the southern tip of Baja California Sur.[7]
Tropical Storm Emily
| Tropical storm (SSHWS) | |
 | |
| Duration | September 13 – September 14 |
|---|---|
| Peak intensity | 40 mph (65 km/h) (1-min); |
Emily first began as a disturbance early on September 12.[7] It moved west-northwest and developed into a tropical depression around 00:00 UTC on September 13.[8] Surface observations from nearby ships were used to upgrade the depression to a tropical storm twelve hours later. Despite persistent, deep convective activity, a trek over colder waters prevented Emily from further intensifying,[7] and the system instead transitioned into an extratropical cyclone around 12:00 UTC on September 14.[8]
Hurricane Florence
| Category 2 hurricane (SSHWS) | |
  | |
| Duration | September 20 – September 24 |
|---|---|
| Peak intensity | 105 mph (165 km/h) (1-min); |
The strongest cyclone of the 1977 season began as a tropical disturbance over the open eastern Pacific.[7] It developed into a tropical depression around 12:00 UTC on September 20 and strengthened into Tropical Storm Florence twelve hours later. The newly formed system moved west-northwest until reaching hurricane strength by 00:00 UTC on September 22,[8] at which point Florence sharply curved toward the north-northeast. With a well-defined eye on satellite imagery,[7] the storm reached peak winds of 105 mph (169 km/h) around 18:00 UTC on September 22,[8] a Category 2 hurricane. Florence accelerated over increasingly cool ocean temperatures, causing it to weaken to a tropical storm early on September 23, weaken to a tropical depression early on September 24,[7] and transition to an extratropical cyclone by 12:00 UTC that day.[8]
Tropical Storm Glenda
| Tropical storm (SSHWS) | |
 | |
| Duration | September 24 – September 27 |
|---|---|
| Peak intensity | 40 mph (65 km/h) (1-min); |
Tropical Storm Glenda formed around 00:00 UTC on September 24 from a previously established area of disturbed weather well southwest of Acapulco.[7] The storm did not intensify beyond minimal tropical storm strength and instead fell to tropical depression strength around 00:00 UTC on September 25.[8] A north to northwestward forward motion brought the cyclone over progressively cooler waters,[7] and it transitioned to an extratropical cyclone by 06:00 UTC on September 27 while located near Punta Eugenia, Baja California Sur.[8]
Hurricane Heather


The final named storm of the season began as a tropical disturbance late on October 3. It moved west-northwest,[7] organizing into a tropical depression around 00:00 UTC on October 4 and further intensifying into Tropical Storm Heather six hours thereafter.[8] A sprawling storm,[7] Heather reached hurricane strength early on October 5 and attained peak winds of 85 mph (137 km/h) by 12:00 UTC that day. A turn toward the north-northwest, however, brought the storm over increasingly cool waters, prompting a weakening trend. Heather fell to tropical storm strength late on October 6 and further to a tropical depression by 12:00 UTC as its low- and mid-level circulations became dislocated, marking an end to its time as a tropical cyclone.[7][8]
The remnants continued into Arizona, where measurable rainfall peaked at 8.30 in (211 mm), with unspecified reports of up to 14 inches (360 mm) in mountainous locales.[14] As a result, the Santa Cruz River near Tucson witnessed its highest discharge since at least 1892, and the San Pedro River saw its sixth-highest crest since 1913. At least 16,000 acres (6,500 hectares) of farmland were inundated, and about 90 homes were damaged mainly near Nogales, Arizona, though some property damage occurred throughout Amado, Green Valley, and Sahuarita as well. In addition, about 175 families were evacuated from Nogales; in the aftermath of the rains, residents were asked to conserve water after the city's wells were inundated with mud and rendered unusable.[15] Two bridges were destroyed while an additional twelve to fifteen were damaged, in addition to telephone lines and other utilities. Damage equated to about $14.6 million.[16]
Other systems
Despite the season featuring the lowest number of tropical storms on record at the time, there were numerous tropical depressions that failed to intensify into named storms. The first two tropical depressions existed from May 25–30 and from May 30–June 1, both west of the Honduras–Nicaragua border. Tropical depressions Six and Seven occurred in quick succession from July 8–9 and July 9–10, respectively. Tropical Depression Eight occurred solely on July 25, while Tropical Depression Nine existed from August 1–2. Yet another cyclone existed from September 3–4, while the seventeenth and final unnamed system formed on October 22 and dissipated on the next day.[7]
Storm names
The following list of names was used for named storms that formed in the North Pacific Ocean east of 140°W in 1977.[17] This was the same list used for the 1973 season.[18] No names were retired following the season; however, an overhaul of the naming system in 1978 to include male names resulted in this list being discarded.[19]
|
|
|
Had a named storm formed in the North Pacific between 140°W and the International Date Line in 1973 it would have been assigned a name from the west Pacific's typhoon name list by the Joint Typhoon Warning Center on Guam.[17][20]
See also
- List of Pacific hurricanes
- Pacific hurricane season
- 1977 Atlantic hurricane season
- 1977 Pacific typhoon season
- 1977 North Indian Ocean cyclone season
- Australian cyclone seasons: 1976–77, 1977–78
- South Pacific cyclone seasons: 1976–77, 1977–78
- South-West Indian Ocean cyclone seasons: 1976–77, 1977–78
Notes
- ^ The total represents the sum of the squares of the maximum sustained wind speed (knots) for every (sub)tropical storm's intensity of over 33 knots (38 mph; 61 km/h), divided by 10,000 while they are above that threshold; therefore, tropical depressions are not included.
References
- ^ Eric S. Blake; Ethan J. Gibney; Daniel P. Brown; Michelle Mainelli; James L. Franklin; Todd B. Kimberlain; Gregory R. Hammer (June 2009). Tropical Cyclones of the Eastern North Pacific Basin, 1949-2006 (PDF) (Report). National Hurricane Center. Retrieved April 28, 2019.
- ^ "Basin Archives: Northeast Pacific Ocean Historical Tropical Cyclone Statistics". Fort Collins, Colorado: Colorado State University. Retrieved July 8, 2022.
- ^ "Basin Archives: Northeast Pacific Ocean Historical Tropical Cyclone Statistics". Fort Collins, Colorado: Colorado State University. Retrieved July 8, 2022.
- ^ Stacy R. Stewart; John P. Cangialosi (September 2012). "Eastern North Pacific Hurricane Season of 2010". Monthly Weather Review (PDF). American Meteorological Society. 140 (9): 2,769. Bibcode:2012MWRv..140.2769S. doi:10.1175/MWR-D-11-00152.1.
- ^ Dr. Jeff Masters (April 3, 2011). "The global tropical cyclone season of 2010: record inactivity". Weather Underground. Retrieved April 28, 2019.
- ^ John L. Beven II; Lixion A. Avila; James L. Franklin; Miles B. Lawrence; Richard J. Pasch; Stacy R. Stewart (May 2005). "Eastern North Pacific Hurricane Season of 2003". Monthly Weather Review (PDF). American Meteorological Society. 133 (5): 1,403–1,414. Bibcode:2005MWRv..133.1403B. doi:10.1175/MWR2917.1.
- ^ a b c d e f g h i j k l m n o p q r s t u v w x Emil L. Gunther (April 1978). "Eastern North Pacific Tropical Cyclones of 1977". Monthly Weather Review (PDF). American Meteorological Society. 106 (4): 546–558. Bibcode:1978MWRv..106..546G. doi:10.1175/1520-0493(1978)106<0546:ENPTCO>2.0.CO;2.
- ^ a b c d e f g h i j k l m n o p q r s National Hurricane Center; Hurricane Research Division; Central Pacific Hurricane Center (April 4, 2023). "The Northeast and North Central Pacific hurricane database 1949–2022". United States National Oceanic and Atmospheric Administration's National Weather Service. A guide on how to read the database is available here.
 This article incorporates text from this source, which is in the public domain.
- ^ a b David M. Roth. "Hurricane Doreen - August 12-18, 1977". Weather Prediction Center. Retrieved April 28, 2019.
- ^ a b c "8 Killed as Storm Strikes California". Milwaukee Journal Sentinel. August 18, 1977. Retrieved April 28, 2019.
- ^ Jim Hudson (August 22, 1977). "Mohave Valley disaster declared by Supervisors". Kingman Daily Miner. Retrieved April 28, 2019.
- ^ "Remnants of Hurricane Belt Southern California". Milwaukee Journal Sentinel. August 16, 1977. Retrieved April 28, 2019.
- ^ Miles B. Lawrence (April 1978). "Atlantic Hurricane Season of 1977" (PDF). Monthly Weather Review. 106 (4): 534–565. Bibcode:1978MWRv..106..534L. doi:10.1175/1520-0493(1978)106<0534:AHSO>2.0.CO;2. Retrieved January 20, 2016.
- ^ David M. Roth. "Hurricane Heather - October 5-8, 1977". Weather Prediction Center. Retrieved April 28, 2019.
- ^ "Town hall set". Kingman Daily Miner. October 10, 1977. Retrieved April 28, 2019.
- ^ Floods of October 1977 in Southern Arizona and March 1978 in Central Arizona (PDF) (Report). United States Geological Survey. 1984. Retrieved April 28, 2019.
- ^ a b National Hurricane Operations Plan (PDF) (Report). Washington, D.C.: NOAA Office of the Federal Coordinator for Meteorological Services and Supporting Research. May 1977. pp. 83, 85. Retrieved February 27, 2024.
- ^ National Hurricane Operations Plan (PDF) (Report). Washington, D.C.: NOAA Office of the Federal Coordinator for Meteorological Services and Supporting Research. May 1973. p. 102. Retrieved February 27, 2024.
- ^ "Tropical Cyclone Naming History and Retired Names". Miami, Florida: National Hurricane Center. Retrieved April 28, 2019.
- ^ "Eastern North Pacific Tropical Cyclone Name History". Atlantic Tropical Weather Center. Archived from the original on September 29, 2007. Retrieved February 27, 2024.
External links
Tropical cyclones of the 1977 Pacific hurricane season | ||
|---|---|---|
 | ||