
| |||||||||||||||||||||||||||||||||||||||||||||||||||||||||||||||||
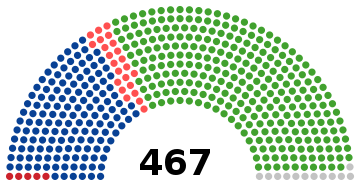
All 467 seats in the House of Representatives of Japan 234 seats needed for a majority | |||||||||||||||||||||||||||||||||||||||||||||||||||||||||||||||||
|---|---|---|---|---|---|---|---|---|---|---|---|---|---|---|---|---|---|---|---|---|---|---|---|---|---|---|---|---|---|---|---|---|---|---|---|---|---|---|---|---|---|---|---|---|---|---|---|---|---|---|---|---|---|---|---|---|---|---|---|---|---|---|---|---|---|
| Turnout | 71.1% ( | ||||||||||||||||||||||||||||||||||||||||||||||||||||||||||||||||
| |||||||||||||||||||||||||||||||||||||||||||||||||||||||||||||||||
 | |||||||||||||||||||||||||||||||||||||||||||||||||||||||||||||||||


| This article is part of a series on |
| Politics of Japan |
|---|
 |
|
|
|
|
General elections were held in Japan on 21 November 1963. The result was a victory for the Liberal Democratic Party (LDP), which won 283 of the 467 seats.[1] Voter turnout was 71.1%.
Most commentators believed that the election results would not radically alter the Japanese political landscape, and this was confirmed in the results, which did not see any party win or lose a large amount of seats. Although the LDP lost 13 seats, 12 LDP-aligned independents were also elected. The highest gain in seats came from the Democratic Socialist Party (DSP), which tactically fielded far fewer candidates than the previous elections and concentrated on fewer districts, gaining six seats, which was more than any of the other opposition parties gained. The elections also saw the defeat of two former prime ministers; Tetsu Katayama of the DSP (formerly of the JSP) and Tanzan Ishibashi of the LDP.[2]
YouTube Encyclopedic
-
1/5Views:9 99751 5861 504 34773 640392 688
-
Elections In Sarawak (1963)
-
Speeches That Changed The World | (Political Documentary ) | Timeline
-
The Entire History of the Cold War Explained | Best Cold War Documentary
-
DicKtionary - A is for Air Force - Curtis LeMay
-
The World's Most Famous Speeches (chosen by YOU!)
Transcription
Results
 | |||||
|---|---|---|---|---|---|
| Party | Votes | % | Seats | +/– | |
| Liberal Democratic Party | 22,423,915 | 54.67 | 283 | –13 | |
| Japan Socialist Party | 11,906,766 | 29.03 | 144 | –1 | |
| Democratic Socialist Party | 3,023,302 | 7.37 | 23 | +6 | |
| Japanese Communist Party | 1,646,477 | 4.01 | 5 | +2 | |
| Other parties | 59,765 | 0.15 | 0 | – | |
| Independents | 1,956,313 | 4.77 | 12 | +7 | |
| Total | 41,016,538 | 100.00 | 467 | 0 | |
| Valid votes | 41,016,538 | 98.93 | |||
| Invalid/blank votes | 442,406 | 1.07 | |||
| Total votes | 41,458,944 | 100.00 | |||
| Registered voters/turnout | 58,281,678 | 71.14 | |||
| Source: Baerwald, Mackie | |||||
By prefecture
| Prefecture | Total seats |
Seats won | ||||
|---|---|---|---|---|---|---|
| LDP | JSP | DSP | JCP | Ind. | ||
| Aichi | 19 | 11 | 6 | 1 | 1 | |
| Akita | 8 | 4 | 3 | 1 | ||
| Aomori | 7 | 3 | 3 | 1 | ||
| Chiba | 13 | 10 | 2 | 1 | ||
| Ehime | 9 | 5 | 3 | 1 | ||
| Fukui | 4 | 3 | 1 | |||
| Fukuoka | 19 | 10 | 7 | 2 | ||
| Fukushima | 12 | 9 | 3 | |||
| Gifu | 9 | 6 | 3 | |||
| Gunma | 10 | 7 | 3 | |||
| Hiroshima | 12 | 9 | 2 | 1 | ||
| Hokkaido | 22 | 10 | 9 | 1 | 2 | |
| Hyōgo | 18 | 8 | 6 | 3 | 1 | |
| Ibaraki | 12 | 8 | 3 | 1 | ||
| Ishikawa | 6 | 4 | 1 | 1 | ||
| Iwate | 8 | 6 | 2 | |||
| Kagawa | 6 | 4 | 1 | 1 | ||
| Kagoshima | 11 | 6 | 4 | 1 | ||
| Kanagawa | 13 | 7 | 5 | 1 | ||
| Kōchi | 5 | 4 | 1 | |||
| Kumamoto | 10 | 8 | 2 | |||
| Kyoto | 10 | 4 | 3 | 2 | 1 | |
| Mie | 9 | 6 | 2 | 1 | ||
| Miyagi | 9 | 5 | 3 | 1 | ||
| Miyazaki | 6 | 4 | 2 | |||
| Nagano | 13 | 8 | 4 | 1 | ||
| Nagasaki | 9 | 6 | 2 | 1 | ||
| Nara | 5 | 3 | 2 | |||
| Niigata | 15 | 9 | 5 | 1 | ||
| Ōita | 7 | 5 | 2 | |||
| Okayama | 10 | 6 | 4 | |||
| Osaka | 19 | 8 | 6 | 3 | 2 | |
| Saga | 5 | 3 | 2 | |||
| Saitama | 13 | 8 | 5 | |||
| Shiga | 5 | 3 | 2 | |||
| Shimane | 5 | 4 | 1 | |||
| Shizuoka | 14 | 9 | 4 | 1 | ||
| Tochigi | 10 | 7 | 3 | |||
| Tokushima | 5 | 4 | 1 | |||
| Tokyo | 27 | 13 | 12 | 2 | ||
| Tottori | 4 | 3 | 1 | |||
| Toyama | 6 | 5 | 1 | |||
| Wakayama | 6 | 4 | 2 | |||
| Yamagata | 8 | 6 | 2 | |||
| Yamaguchi | 9 | 4 | 3 | 2 | ||
| Yamanashi | 5 | 4 | 1 | |||
| Total | 467 | 283 | 144 | 23 | 5 | 12 |
References
- ^ "統計局ホームページ/第27章 公務員・選挙". Archived from the original on 2015-02-15. Retrieved 2012-12-19.
- ^ Baerwald, Hans H. (1964-01-01). "Japan at Election Time". Asian Survey. 4 (1): 646–655. doi:10.2307/3023540. ISSN 0004-4687. JSTOR 3023540.
| General elections | |
|---|---|
| Councillors elections | |
| Unified local elections | |
| Supreme Court retention elections |
|