
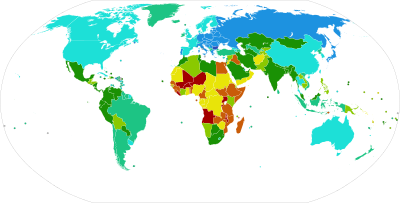
| ≥ 30 25 – 29.99 20 – 24.99 15 – 19.99 | 10 – 14.99 5 – 9.99 0 – 4.99 -5 – -0.01 | < -5 Data unavailable |
In Demography, the rate of natural increase (RNI), also known as natural population change, is defined as the birth rate minus the death rate of a particular population, over a particular time period.[1] It is typically expressed either as a number per 1,000 individuals in the population[2] or as a percentage.[3] RNI can be either positive or negative. It contrasts to total population change by ignoring net migration.
This RNI gives demographers an insight into how a region's population is evolving, and these analyses can inform government attempts to shape RNI.
YouTube Encyclopedic
-
1/3Views:23 8101 4673 851
-
Why Countries Natural Increase Rates Grow/Shrink [AP Human Geography Unit 2 Topic 4] (2.4)
-
Class 12 Sociology Chapter 2 | Rate of Natural Increase- The Demographic Structure of Indian Society
-
Population Dynamics
Transcription
Examples
Suppose a population of 5,000 individuals experiences 1,150 live births and 900 deaths over the course of one year.
To show the RNI over that year as a percentage, the equation would be
(1,150 – 900) ÷ 5,000 = 0.05 = +5%
To show the RNI as a number per 1,000 individuals in the population, the equation would be
(1,150 – 900) ÷ (5,000/1,000) = 250 ÷ 5 = +50
It can also be shown as natural births per 1,000 minus deaths per 1,000
(1,150 ÷ 5) – (900 ÷ 5) = 230 – 180 = +50
To convert the RNI per 1,000 population to a percentage, divide it by 1,000. The equation would be
+50 ÷ 1,000 = 0.05 = +5%
Uses
The rate of natural increase gives demographers an idea of how a region's population is shifting over time. RNI excludes in-migration and out-migration, giving an indication of population growth based only on births and deaths. Comparing natural population change with total population change shows which is dominate for a particular region. Looking at this difference across regions reveals those that are changing mainly due to births exceeding deaths and those changing mainly due to migration. The map shows just such an analysis for the US.[1]

The trend of RNI over time can indicate what stage of the Demographic Transition Model (DTM) a region or country is in.
National efforts to affect RNI
Government attempts to shape the RNI of a region or country are common around the world.[4] Policies can either encourage or discourage an increase in birth rates. For example, during the COVID-19 crisis Singapore offered families a “pandemic baby bonus” to encourage a higher birth rate, therefore increasing RNI.[5] The US has considered similar policies.[6] Another example was China's one-child policy, intended to decrease birth rates, therefore decreasing the RNI.[7]
A country with a good infrastructure to support families, women's health, and maternal/child health would likely have lower death rates from infant or maternal mortality, which would increase RNI.
See also
References
- ^ a b Rogers, Luke; Borsella, Peter (March 24, 2016). "Growth or Decline: Understanding How Populations Change". United States Census Bureau.
- ^ "World Population Prospects". United Nations Department of Economic and Social Affairs.
- ^ "Estimates, 1950 - 2020: Annually interpolated demographic indicators - Rate of natural increase (per 1,000 population)". Our World In Data.
- ^ "Government policies to raise or lower the fertility leve" (PDF). Population Facts, United Nations Department of Economics and Social Affairs. December 2017.
- ^ "Singapore offers 'pandemic baby bonus' to boost births". BBC News. October 6, 2020.
- ^ Cain Miller, Claire (February 17, 2021). "Would Americans Have More Babies if the Government Paid Them?". New York Times.
- ^ Hesketh, Therese; Lu, Li; Xing, Zhu Wei (2005-09-15). "The Effect of China's One-Child Family Policy after 25 Years" (PDF). New England Journal of Medicine. 353 (11): 1171–1176. doi:10.1056/NEJMhpr051833. ISSN 0028-4793. PMID 16162890.
| Major topics | |
|---|---|
| Society and population | |
| Publications | |
| Lists | |
Events and organizations |
|
| Related topics | |