

Tamaño de esta previsualización PNG del archivo SVG: 800 × 372 píxeles. Otras resoluciones: 320 × 149 píxeles · 640 × 298 píxeles · 1024 × 476 píxeles · 1280 × 595 píxeles · 2560 × 1191 píxeles · 933 × 434 píxeles.
Ver la imagen en su resolución original ((Imagen SVG, nominalmente 933 × 434 pixels, tamaño de archivo: 50 kB))
W3C-validity not checked.
Resumen
| Descripción |
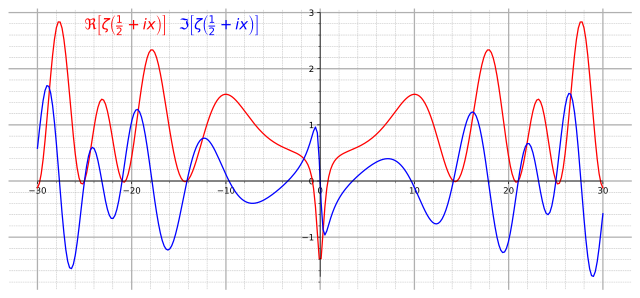
English: Graph of real (red) and imaginary (blue) parts of the critical line Re(z)=1/2 of the Riemann zeta function. |
||
| Fecha | |||
| Fuente |
Own work. Made with Mathematica using the following code: Show[Plot[{Re[Zeta[1/2+I x]], Im[Zeta[1/2+I x]]}, {x,-30, 30},AxesLabel->{"x"} , PlotStyle->{Red, Blue}, Ticks->{Table[4x-28,{x,0,14}]}, ImageSize->{800,600}],
Graphics[Text[Style[\[DoubleStruckCapitalR][\[Zeta][ I x + "1/2"]],14,Red ,Background ->White],{-22,2.6} ]],
Graphics[Text[Style[\[GothicCapitalI][\[Zeta][ I x + "1/2"]],14,Blue ,Background ->White],{-14,2.6} ]]] |
||
| Autor | Slonzor | ||
| Permiso (Reutilización de este archivo) |
Public Domain | ||
| SVG desarrollo | El código fuente de esta imagen SVG es válido. | ||
| Código fuente | Python code
|
Licencia
| Yo, el titular de los derechos de autor de esta obra, lo libero al dominio público. Esto aplica en todo el mundo. En algunos países esto puede no ser legalmente factible; si ello ocurriese: Concedo a cualquier persona el derecho de usar este trabajo para cualquier propósito, sin ningún tipo de condición al menos que éstas sean requeridas por la ley. |
Historial del archivo
Haz clic sobre una fecha y hora para ver el archivo tal como apareció en ese momento.
| Fecha y hora | Miniatura | Dimensiones | Usuario | Comentario | |
|---|---|---|---|---|---|
| actual | 20:01 23 ago 2017 | | 933 × 434 (50 kB) | <bdi>Krishnavedala</bdi> | much reduced vector version |
| 22:28 24 sep 2009 |  | 800 × 600 (122 kB) | <bdi>Geek3</bdi> | linewidth=1px | |
| 19:33 20 nov 2008 |  | 800 × 600 (122 kB) | <bdi>Slonzor</bdi> | Man i've messed this up a lot of times. | |
| 19:27 20 nov 2008 |  | 800 × 600 (3,36 MB) | <bdi>Slonzor</bdi> | ||
| 19:23 20 nov 2008 |  | 800 × 600 (3,36 MB) | <bdi>Slonzor</bdi> | ||
| 19:18 20 nov 2008 |  | 800 × 600 (3,36 MB) | <bdi>Slonzor</bdi> | ||
| 19:13 20 nov 2008 |  | 800 × 600 (79 kB) | <bdi>Slonzor</bdi> | {{Information |Description={{en|1=Graph of real (red) and imaginary (blue) parts of the critical line Re(z)=1/2 of the Riemann zeta function.}} |Source=Own work. Made with Mathematica using the following code: <code><nowiki>Show[Plot[{Re[Zeta[1/2+I x]], |
Usos del archivo
La siguiente página usa este archivo:
Uso global del archivo
Las wikis siguientes utilizan este archivo:
- Uso en ar.wikipedia.org
- Uso en ba.wikipedia.org
- Uso en be.wikipedia.org
- Uso en ca.wikipedia.org
- Uso en ckb.wikipedia.org
- Uso en da.wikipedia.org
- Uso en el.wikipedia.org
- Uso en en.wikipedia.org
- Uso en eo.wikipedia.org
- Uso en eu.wikipedia.org
- Uso en fa.wikipedia.org
- Uso en fi.wikipedia.org
- Uso en he.wikipedia.org
- Uso en hi.wikipedia.org
- Uso en hy.wikipedia.org
- Uso en id.wikipedia.org
- Uso en it.wikipedia.org
- Uso en it.wikiquote.org
- Uso en ja.wikipedia.org
- Uso en ko.wikipedia.org
- Uso en la.wikipedia.org
- Uso en mn.wikipedia.org
- Uso en nn.wikipedia.org
- Uso en no.wikipedia.org
- Uso en pa.wikipedia.org
- Uso en pt.wikipedia.org
- Uso en ru.wikipedia.org
- Uso en sl.wikipedia.org
- Uso en sq.wikipedia.org
- Uso en sr.wikipedia.org
- Uso en uk.wikipedia.org
- Uso en vi.wikipedia.org
- Uso en zh-yue.wikipedia.org
Ver más uso global de este archivo.