Ver la imagen en su resolución original (2231 × 2266 píxeles; tamaño de archivo: 426 kB; tipo MIME: image/jpeg)
Historial del archivo
Haz clic sobre una fecha y hora para ver el archivo tal como apareció en ese momento.
| Fecha y hora | Miniatura | Dimensiones | Usuario | Comentario | |
|---|---|---|---|---|---|
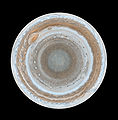
| actual | 10:59 14 feb 2007 |  | 2231 × 2266 (426 kB) | Helix84 | {{en| :This map of Jupiter is the most detailed global color map of the planet ever produced. The round map is a polar stereographic projection that shows the south pole in the center of the map and the equator at the edge. It was constructed from images |
Usos del archivo
Las siguientes páginas usan este archivo:
Uso global del archivo
Las wikis siguientes utilizan este archivo:
- Uso en af.wikipedia.org
- Uso en ar.wikipedia.org
- Uso en bn.wikipedia.org
- Uso en ca.wikipedia.org
- Uso en de.wikipedia.org
- Uso en en.wikipedia.org
- Jupiter
- Wikipedia:Featured pictures thumbs/05
- Wikipedia:Featured picture candidates/October-2006
- Wikipedia:Featured picture candidates/Map of Jupiter
- User:Andonic/Successful Featured Picture Nominations
- Wikipedia:Featured picture candidates/January-2007
- Wikipedia:Featured picture candidates/Polar Map of Jupiter
- Wikipedia:Wikipedia Signpost/2007-01-15/Features and admins
- Wikipedia:Wikipedia Signpost/2007-01-15/SPV
- User talk:Andonic/Archive 7
- Wikipedia:WikiProject Astronomy/Recognized content
- Portal:Solar System
- Portal:Solar System/Selected article
- Portal:Solar System/Selected picture
- Wikipedia:Picture of the day/May 2007
- Template:POTD/2007-05-10
- User talk:Andonic/Archive 11
- Portal:Solar System/Selected picture/11
- Wikipedia:Featured pictures/Space/Looking out
- Wikipedia:Today's featured article/August 2009
- Wikipedia:Today's featured article/August 25, 2009
- Portal:Solar System/Selected article/21
- Talk:Jupiter/Archive 5
- Atmosphere of Jupiter
- Wikipedia:WikiProject Astronomy/Recognized astronomy content
- Wikipedia:Wikipedia Signpost/Single/2007-01-15
- Uso en eu.wikipedia.org
- Uso en fr.wikipedia.org
- Uso en it.wikipedia.org
- Uso en ja.wikipedia.org
- Uso en kn.wikipedia.org
- Uso en la.wikipedia.org
- Uso en mk.wikipedia.org
- Uso en nds.wikipedia.org
- Uso en no.wikipedia.org
Ver más uso global de este archivo.


