
Zaragoza, Antioquia | |
|---|---|
Municipality and town | |
 | |
 Flag  Seal | |
 Location of the municipality and town of Zaragoza, Antioquia in the Antioquia Department of Colombia | |
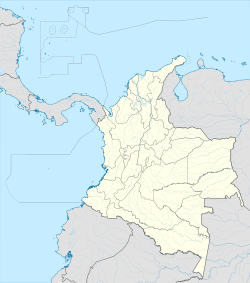 Zaragoza, Antioquia Location in Colombia | |
| Coordinates: 7°29′38.4″N 74°52′15.6″W / 7.494000°N 74.871000°W | |
| Country | |
| Department | |
| Subregion | Bajo Cauca |
| Population (Census 2018[1]) | |
| • Total | 24,067 |
| Time zone | UTC-5 (Colombia Standard Time) |
Zaragoza (Spanish pronunciation: [saɾaˈɣosa]) is a municipality in the Colombian department of Antioquia. Its population was 24,067 at the 2018 census.
Climate
Zaragoza has a tropical rainforest climate (Af) with heavy to very heavy rainfall year-round.
| Climate data for Zaragoza | |||||||||||||
|---|---|---|---|---|---|---|---|---|---|---|---|---|---|
| Month | Jan | Feb | Mar | Apr | May | Jun | Jul | Aug | Sep | Oct | Nov | Dec | Year |
| Mean daily maximum °C (°F) | 31.5 (88.7) |
31.9 (89.4) |
32.2 (90.0) |
31.7 (89.1) |
31.2 (88.2) |
30.9 (87.6) |
31.3 (88.3) |
31.0 (87.8) |
30.6 (87.1) |
30.5 (86.9) |
30.3 (86.5) |
30.7 (87.3) |
31.2 (88.1) |
| Daily mean °C (°F) | 27.1 (80.8) |
27.4 (81.3) |
27.9 (82.2) |
27.7 (81.9) |
27.3 (81.1) |
27.0 (80.6) |
27.2 (81.0) |
27.0 (80.6) |
26.7 (80.1) |
26.6 (79.9) |
26.5 (79.7) |
26.7 (80.1) |
27.1 (80.8) |
| Mean daily minimum °C (°F) | 22.8 (73.0) |
23.0 (73.4) |
23.7 (74.7) |
23.7 (74.7) |
23.4 (74.1) |
23.2 (73.8) |
23.1 (73.6) |
23.0 (73.4) |
22.8 (73.0) |
22.8 (73.0) |
22.8 (73.0) |
22.8 (73.0) |
23.1 (73.6) |
| Average rainfall mm (inches) | 125.9 (4.96) |
135.4 (5.33) |
171.3 (6.74) |
393.6 (15.50) |
520.7 (20.50) |
482.1 (18.98) |
463.4 (18.24) |
486.0 (19.13) |
521.7 (20.54) |
531.1 (20.91) |
467.2 (18.39) |
304.8 (12.00) |
4,603.2 (181.22) |
| Average rainy days | 7 | 7 | 8 | 14 | 18 | 16 | 16 | 18 | 18 | 19 | 17 | 11 | 169 |
| Source: IDEAM[2] | |||||||||||||
References
- ^ "Censo Nacional de Población y Vivienda 2018". Retrieved 19 April 2020.
- ^ "Data". www.ideam.gov.co. Retrieved 2020-09-03.
Capital: Medellín | |||||||||||||||||||
| Regions and municipalities |
| ||||||||||||||||||
| Related topics | |||||||||||||||||||
| Gold |
|  |
|---|---|---|
| <span style="color:black;background: white;">Silver</span> | ||
| <span style="color:black;background: white;">Platinum</span> | ||
| Nickel |
| |
| Coltan | ||
| Emeralds | ||
| Coal | ||
| Salt | ||
| Sources | ||
| International | |
|---|---|
| National | |
This Department of Antioquia location article is a stub. You can help Wikipedia by expanding it. |