
West Sussex County Council in England is elected every four years.
YouTube Encyclopedic
-
1/1Views:1 144
-
How Surrey County Council is improving our roads
Transcription
Council elections
- 1997 West Sussex County Council election
- 2001 West Sussex County Council election
- 2005 West Sussex County Council election (boundary changes reduced the number of seats by 1)[1]
- 2009 West Sussex County Council election
- 2013 West Sussex County Council election
- 2017 West Sussex County Council election
- 2021 West Sussex County Council election
Election results
| Overall control | Conservative | Lib Dems | Labour | UKIP | Green | Local Alliance | Independent | ||||||||
| 2021 | Con | 48 | 10 | 9 | - | 1 | 1 | 1 | |||||||
| 2017 | Con | 56 | 9 | 5 | - | - | - | - | |||||||
| 2013 | Con | 46 | 8 | 6 | 10 | - | - | 1 | |||||||
| 2009 | Con | 48 | 21 | 2 | - | - | - | - | |||||||
| 2005 | Con | 46 | 17 | 7 | - | - | - | - | |||||||
| 2001 | Con | 42 | 18 | 11 | - | - | - | - | |||||||
| 1997 | Con | 37 | 24 | 9 | - | - | - | 1 | |||||||
Results maps
-
 2009 results map
 -
 2013 results map
 -
 2017 results map
 -
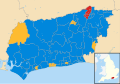
 2021 results map


By-election results
1993-1997
| Party | Candidate | Votes | % | ±% | |
|---|---|---|---|---|---|
| Labour | 1,283 | 79.8 | |||
| Conservative | 229 | 14.2 | |||
| Liberal Democrats | 96 | 6.0 | |||
| Majority | 1,054 | 65.6 | |||
| Turnout | 1,608 | 26.7 | |||
| Labour hold | Swing | ||||
1997-2001
| Party | Candidate | Votes | % | ±% | |
|---|---|---|---|---|---|
| Liberal Democrats | 1,077 | 50.2 | +4.5 | ||
| Conservative | 750 | 34.9 | -0.5 | ||
| Labour | 319 | 14.9 | -3.9 | ||
| Majority | 327 | 15.3 | |||
| Turnout | 2,146 | ||||
| Liberal Democrats hold | Swing | ||||
| Party | Candidate | Votes | % | ±% | |
|---|---|---|---|---|---|
| Conservative | Michael Willett | 1,297 | 44.0 | +1.6 | |
| Liberal Democrats | Derek Deedman | 1,040 | 35.3 | -12.0 | |
| Labour | John Ridley | 480 | 16.3 | +6.1 | |
| Independent | Bernard Durnford | 132 | 4.5 | +4.5 | |
| Majority | 257 | 8.7 | |||
| Turnout | 2,949 | ||||
| Conservative gain from Liberal Democrats | Swing | ||||
| Party | Candidate | Votes | % | ±% | |
|---|---|---|---|---|---|
| Labour | 830 | 50.7 | -1.1 | ||
| Conservative | 635 | 38.8 | +4.3 | ||
| Liberal Democrats | 171 | 10.4 | +0.0 | ||
| Majority | 195 | 11.9 | |||
| Turnout | 1,636 | 23.1 | |||
| Labour hold | Swing | ||||
2001-2005
| Party | Candidate | Votes | % | ±% | |
|---|---|---|---|---|---|
| Liberal Democrats | Patricia Webster | 1,027 | 51.8 | +22.6 | |
| Conservative | Peter Jones | 954 | 48.2 | -4.0 | |
| Majority | 73 | 3.6 | |||
| Turnout | 1,981 | 26.0 | |||
| Liberal Democrats gain from Conservative | Swing | ||||
| Party | Candidate | Votes | % | ±% | |
|---|---|---|---|---|---|
| Conservative | Robert Dunn | 1,145 | 59.9 | +13.2 | |
| Liberal Democrats | Mark O'Keeffe | 420 | 22.0 | -2.0 | |
| Labour | Adrienne Lowe | 346 | 18.1 | -11.1 | |
| Majority | 725 | 37.9 | |||
| Turnout | 1,911 | 20.9 | |||
| Conservative hold | Swing | ||||
| Party | Candidate | Votes | % | ±% | |
|---|---|---|---|---|---|
| Liberal Democrats | Anthony Hull | 1,652 | 44.9 | -1.9 | |
| Conservative | John Charles | 1,575 | 42.8 | +4.5 | |
| Labour | Richard Wilson | 454 | 12.3 | -2.6 | |
| Majority | 77 | 2.1 | |||
| Turnout | 3,681 | 42.9 | |||
| Liberal Democrats hold | Swing | ||||
2005-2009
| Party | Candidate | Votes | % | ±% | |
|---|---|---|---|---|---|
| Conservative | Deborah Urquhart | 1,500 | 75.6 | +25.4 | |
| Liberal Democrats | Trevor Richards | 334 | 16.8 | -21.0 | |
| Labour | James Field | 149 | 7.5 | +7.5 | |
| Majority | 1,166 | 58.8 | |||
| Turnout | 1,983 | 25.8 | |||
| Conservative hold | Swing | ||||
| Party | Candidate | Votes | % | ±% | |
|---|---|---|---|---|---|
| Conservative | Janet Mockridge | 907 | 55.5 | +15.4 | |
| Labour | Andrew Bray | 316 | 19.4 | -9.6 | |
| Liberal Democrats | James Doyle | 314 | 19.2 | -0.3 | |
| Green | Susan Board | 96 | 5.9 | +0.9 | |
| Majority | 591 | 36.1 | |||
| Turnout | 1,633 | 21.0 | |||
| Conservative hold | Swing | ||||
| Party | Candidate | Votes | % | ±% | |
|---|---|---|---|---|---|
| Conservative | Peter Bradbury | 2,020 | 61.3 | +8.3 | |
| Liberal Democrats | Stephen Blanch | 1,274 | 38.7 | +7.4 | |
| Majority | 746 | 22.6 | |||
| Turnout | 3,358 | 45.41 | -27.39 | ||
| Conservative hold | Swing | ||||
| Party | Candidate | Votes | % | ±% | |
|---|---|---|---|---|---|
| Conservative | Chris Duncton | 1,437 | 72.0 | +17.8 | |
| Liberal Democrats | Raymond Cooper | 346 | 17.3 | =13.0 | |
| BNP | Andrew Emerson | 213 | 10.7 | +10.7 | |
| Majority | 1,091 | 54.7 | |||
| Turnout | 2,002 | 21.12 | -48.60 | ||
| Conservative hold | Swing | ||||
2009-2013
| Party | Candidate | Votes | % | ±% | |
|---|---|---|---|---|---|
| Conservative | John O'Brien | 2,878 | 48.2 | +3.7 | |
| Liberal Democrats | Catrin Ingham | 2,771 | 46.4 | +6.5 | |
| Independent | Robert Wall | 328 | 5.5 | N/A | |
| Majority | 107 | 1.8 | -1.8 | ||
| Turnout | 5,977 | 68.5 | +27.3 | ||
| Conservative hold | Swing | ||||
| Party | Candidate | Votes | % | ±% | |
|---|---|---|---|---|---|
| Conservative | Robert Lanzer | 1,036 | 64.4 | -7.9 | |
| Labour | Peter Smith | 417 | 26.0 | +12.0 | |
| Liberal Democrats | Sulu Pandya | 82 | 5.1 | -8.6 | |
| UKIP | John MacCanna | 61 | 3.8 | +3.8 | |
| Justice Party | Arshad Khan | 12 | 0.7 | +0.7 | |
| Majority | 619 | 38.5 | -19.8 | ||
| Turnout | 1,609 | ||||
| Conservative hold | Swing | -10.0 | |||
| Party | Candidate | Votes | % | ±% | |
|---|---|---|---|---|---|
| Conservative | John Cherry | 1,410 | 78.2 | +9.8 | |
| UKIP | Judith Fowler | 392 | 21.8 | N/A | |
| Majority | 1,018 | 56.0 | +13.9 | ||
| Turnout | 1,900 | 21.5 | -15.8 | ||
| Conservative hold | Swing | ||||
2013-2017
| Party | Candidate | Votes | % | ±% | |
|---|---|---|---|---|---|
| Conservative | Philip Circus | 1,037 | 45.9 | -2.0 | |
| UKIP | John Wallace | 729 | 32.2 | -7.8 | |
| Liberal Democrats | Nick Hopkinson | 364 | 16.1 | +2.0 | |
| Green | James Doyle | 131 | 5.8 | N/A | |
| Majority | 308 | 13.7 | +3.8 | ||
| Turnout | 2,261 | 22.5 | -10.6 | ||
| Conservative hold | Swing | +2.9 | |||
| Party | Candidate | Votes | % | ±% | |
|---|---|---|---|---|---|
| Conservative | Liz Kitchen | 868 | 58.3 | +3.3 | |
| UKIP | Geoff Stevens | 335 | 22.5 | -7.7 | |
| Green | Darrin Green | 119 | 8.0 | N/A | |
| Liberal Democrats | Tony Millson | 103 | 6.9 | -7.9 | |
| Labour | Carol Hayton | 63 | 4.4 | N/A | |
| Majority | 533 | 36.8 | +12..0 | ||
| Turnout | 1490 | 20.1 | -10.1 | ||
| Conservative hold | Swing | +5.5 | |||
| Party | Candidate | Votes | % | ±% | |
|---|---|---|---|---|---|
| Conservative | Stephen Hillier | 649 | 35.5 | +1.7 | |
| UKIP | Charles Burrell | 576 | 31.5 | +5.1 | |
| Labour | Richard Goddard | 346 | 18.9 | -2.7 | |
| Liberal Democrats | Anne Hall | 201 | 11.0 | -8.2 | |
| Green | Paul Brown | 55 | 3.0 | N/A | |
| Majority | 73 | 4.0 | -2.4 | ||
| Turnout | 1832 | 23.1 | -6.6 | ||
| Conservative hold | Swing | -1.2 | |||
2017-2021
| Party | Candidate | Votes | % | ±% | |
|---|---|---|---|---|---|
| Labour | Karen Sudan | 1,293 | 48.9 | ||
| Conservative | Jan Tarrant | 839 | 31.7 | ||
| Liberal Democrats | David Anderson | 268 | 10.1 | ||
| Green | Richard Kail | 246 | 9.3 | ||
| Majority | 454 | 17.2 | |||
| Turnout | 2,646 | 30.2 | |||
| Labour hold | Swing | ||||
| Party | Candidate | Votes | % | ±% | |
|---|---|---|---|---|---|
| Conservative | Brenda Burgess | 1,102 | 51.7 | ||
| Labour | Angela Malik | 628 | 29.5 | ||
| Liberal Democrats | David Anderson | 257 | 12.1 | ||
| Green | Danielle Kail | 136 | 6.4 | ||
| Justice Party | Arshad Khan | 9 | 0.4 | ||
| Majority | 474 | 22.2 | |||
| Turnout | 2,132 | 25.2 | |||
| Conservative hold | Swing | ||||
| Party | Candidate | Votes | % | ±% | |
|---|---|---|---|---|---|
| Conservative | Mike Magill | 1,368 | 48.9 | ||
| Liberal Democrats | Andrew Kerry-Bedell | 1,009 | 36.0 | ||
| Green | Michael Neville | 250 | 8.9 | ||
| Labour | Jane Towers | 161 | 5.8 | ||
| Patria | Andrew Emerson | 12 | 0.4 | ||
| Majority | 359 | 12.8 | |||
| Turnout | 2,800 | 28.8 | |||
| Conservative hold | Swing | ||||
2021-2025
| Party | Candidate | Votes | % | ±% | |
|---|---|---|---|---|---|
| Liberal Democrats | Andrew Kerry-Bedell | 1,180 | 51.8 | +22.8 | |
| Conservative | Bob Hayes | 893 | 39.2 | -11.7 | |
| Green | Ann Stewart | 178 | 7.8 | -3.1 | |
| Labour | Alan Butcher | 25 | 1.1 | -8.1 | |
| Majority | 287 | 12.6 | |||
| Turnout | 2,276 | ||||
| Liberal Democrats gain from Conservative | Swing | ||||
| Party | Candidate | Votes | % | ±% | |
|---|---|---|---|---|---|
| Labour | Graham McKnight | 1,262 | 52.0 | +5.6 | |
| Conservative | Michael Cloake | 795 | 32.8 | -6.3 | |
| Liberal Democrats | Hazel Thorpe | 235 | 9.7 | +5.4 | |
| Green | Jo Paul | 133 | 5.5 | -1.7 | |
| Majority | 467 | 19.3 | |||
| Turnout | 2,425 | ||||
| Labour hold | Swing | ||||
| Party | Candidate | Votes | % | ±% | |
|---|---|---|---|---|---|
| Independent | Jaine Wild | 803 | 43.4 | +43.4 | |
| Conservative | David Darling | 733 | 39.6 | -12.8 | |
| Labour | David Meagher | 217 | 11.7 | +3.5 | |
| Independent | Richard Parker | 99 | 5.3 | -14.8 | |
| Majority | 70 | 3.8 | |||
| Turnout | 1,852 | ||||
| Independent gain from Conservative | Swing | ||||
| Party | Candidate | Votes | % | ±% | |
|---|---|---|---|---|---|
| Conservative | John Dabell | 1,064 | 43.6 | -10.8 | |
| Independent | Norman Mockford | 467 | 19.1 | +6.4 | |
| Liberal Democrats | Andrew Lane | 365 | 14.9 | +2.5 | |
| Labour | Timothy Cornell | 340 | 13.9 | +3.2 | |
| Green | Alex Langridge | 207 | 8.5 | -1.3 | |
| Majority | 597 | 24.4 | |||
| Turnout | 2,443 | ||||
| Conservative hold | Swing | ||||
References
- ^ "Local election results: West Sussex". BBC News Online. Retrieved 18 September 2009.
- ^ "Lib Dems break Tories' winning streak". guardian.co.uk. London. 4 July 2003. Retrieved 18 September 2009.
- ^ "West Sussex County Council - Saltings division by election" (PDF). Adur District Council. Retrieved 18 September 2009.
- ^ "Roffey electoral division by-election result". West Sussex county council. Retrieved 18 September 2009.
- ^ a b c d "Results of Previous Elections". West Sussex county council. Archived from the original on 26 September 2006. Retrieved 18 September 2009.
- ^ "Declaration of Result of Poll - East Grinstead South & Ashurst Wood" (PDF). West Sussex County Council. 7 May 2010. Retrieved 28 May 2011.
- ^ "Declaration of Result of Poll - Maidenbower" (PDF). West Sussex County Council. 8 October 2010. Retrieved 28 May 2011.
- ^ "Declaration of result of poll" (PDF). West Sussex County Council. 24 October 2013. Retrieved 25 October 2013.
- ^ "Declaration of result of poll" (PDF). Mid Sussex District Council. 19 December 2013. Retrieved 20 December 2013.
- ^ "By-election result". West Sussex County Council. 2 May 2019. Retrieved 11 May 2021.
- ^ "By-election result". West Sussex County Council. 26 September 2019. Retrieved 11 May 2021.
- ^ "By-election result". West Sussex County Council. 21 November 2019. Retrieved 11 May 2021.
- ^ "Local Elections Archive Project — Bourne Division". www.andrewteale.me.uk. Retrieved 25 September 2023.
- ^ "Local Elections Archive Project — Worthing West Division". www.andrewteale.me.uk. Retrieved 25 September 2023.
- ^ "Local Elections Archive Project — Felpham Division". www.andrewteale.me.uk. Retrieved 25 September 2023.
- ^ "Local Elections Archive Project — East Grinstead Meridian Division". www.andrewteale.me.uk. Retrieved 25 September 2023.
External links
| West Sussex CC | |
|---|---|
| Adur | |
| Arun | |
| Chichester | |
| Crawley | |
| Horsham | |
| Mid Sussex | |
| Worthing | |
| |