

The characteristics of United States rainfall climatology differ significantly across the United States and those under United States sovereignty. Summer and early fall bring brief, but frequent thundershowers and tropical cyclones which create a wet summer and drier winter in the eastern Gulf and lower East Coast. During the winter, and spring, Pacific storm systems bring Hawaii and the western United States most of their precipitation. Low pressure systems moving up the East Coast and through the Great Lakes, bring cold season precipitation to from the Midwest to New England, as well as Great Salt Lake. The snow to liquid ratio across the contiguous United States averages 13:1, meaning 13 inches (330 mm) of snow melts down to 1 inch (25 mm) of water.[1]
During the summer, the North American monsoon combined with Gulf of California and Gulf of Mexico moisture moving around the subtropical ridge in the Atlantic Ocean bring the promise of afternoon and evening air-mass thunderstorms to the southern tier of the country as well as the Great Plains. Equatorward of the subtropical ridge, tropical cyclones enhance precipitation across southern and eastern sections of the country, as well as Puerto Rico, the United States Virgin Islands, the Northern Mariana Islands, Guam, and American Samoa. Over the top of the ridge, the jet stream brings a summer precipitation maximum to the Great Plains and western Great Lakes. Large thunderstorm areas known as mesoscale convective complexes move through the Plains, Midwest, and Great Lakes during the warm season, contributing up to 10% of the annual precipitation to the region.
The El Niño–Southern Oscillation affects the precipitation distribution, by altering rainfall patterns across the West, Midwest, the Southeast, and throughout the tropics. There is also evidence that global warming is leading to increased precipitation to the eastern portions of North America, while droughts are becoming more frequent in the western portions. Furthermore, global La Niña meteorological events are generally associated with drier and hotter conditions and further exacerbation of droughts in California and the Southwestern and to some extent the Southeastern United States. Meteorological scientists have observed that La Niñas have become more frequent over time.[2]
YouTube Encyclopedic
-
1/5Views:69 21876 475105 9725 286641
-
🥔 How do we Classify Climates? Crash Course Geography #13
-
climate zones explained (explainity® explainer video)
-
The Asian Monsoon - The World's Largest Weather System
-
ESS 5. Lec 09. The Atmosphere: Precipitation Processes
-
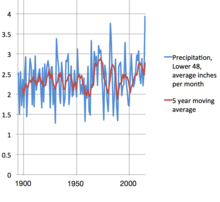
Daily normal temperature and precipitation climatology for Alaska.
Transcription
General

The eastern part of the contiguous United States east of the 98th meridian, the mountains of the Pacific Northwest, the Willamette Valley, and the Sierra Nevada range are the wetter portions of the nation, with average rainfall exceeding 30 inches (760 mm) per year. The drier areas are the Desert Southwest, Great Basin, valleys of northeast Arizona, eastern Utah, and central Wyoming.[4][5] Increased warming within urban heat islands leads to an increase in rainfall downwind of cities.[6]
Alaska
Juneau averages over 50 inches (1,270 mm) of precipitation a year, while other areas in southeast Alaska receive over 275 inches (6,980 mm). South central Alaska does not get nearly as much rain as the southeast of Alaska, though it does get more snow. On average, Anchorage receives 16 inches (406 mm) of precipitation a year, with around 75 inches (1,905 mm) of snow. The northern coast of the Gulf of Alaska receives up to 150 inches (3,800 mm) of precipitation annually.[7] Across western sections of the state, the northern side of the Seward Peninsula is a desert with less than 10 inches (250 mm) of precipitation annually, while some locations between Dillingham and Bethel average around 100 inches (2,540 mm) of precipitation. Inland, often less than 10 inches (250 mm) falls a year, but what precipitation falls during the winter tends to stay throughout the season.[8] La Niña events lead to drier than normal conditions, while El Niño events do not have a correlation towards dry or wet conditions. Precipitation increases by 10 to 40 percent when the Pacific decadal oscillation is positive.[9]
West

From September through May, extratropical cyclones from the Pacific Ocean move inland into the region due to a southward migration of the jet stream during the cold season. This shift in the jet stream brings much of the annual precipitation to the region,[10] and also brings the potential for heavy rain events.[11] The West Coast occasionally experiences ocean-effect showers, usually in the form of rain at lower elevations south of the mouth of the Columbia River. These occur whenever an Arctic air mass from western Canada is drawn westward out over the Pacific Ocean, typically by way of the Fraser Valley, returning shoreward around a center of low pressure. Strong onshore flow is brought into the mountain ranges of the west, focusing significant precipitation into the Rocky Mountains, with rain shadows occurring in the Harney Basin,[12] Great Basin,[13] the central valley of California,[14] and the lower Colorado River valley.[15] In general, rainfall amounts are lower on the southern portions of the West coast.[16] The biggest recipients of the precipitation are the coastal ranges such as the Olympic Mountains,[17] the Cascades,[18] and the Sierra Nevada range.[19] Lesser amounts fall upon the Continental Divide. Cold-season precipitation into this region is the main supply of water to area rivers, such as the Colorado River and Rio Grande, and also acts as the main source of water to people living in this portion of the United States.[20] During El Niño events, increased precipitation is expected in California due to a more southerly, zonal, storm track.[21] California also enters a wet pattern when thunderstorm activity within the tropics associated with the Madden–Julian oscillation nears 150E longitude.[11] During La Niña, increased precipitation is diverted into the Pacific Northwest due to a more northerly storm track.[22]
Lake-effect snow off Great Salt Lake
The southern and southeastern sides of the Great Salt Lake receive significant lake-effect snow. Since the Great Salt Lake never freezes, the lake-effect can affect the weather along the Wasatch Front year round.[23] The lake-effect largely contributes to the 55 inches (140 cm) to 80 inches (200 cm) annual snowfall amounts recorded south and east of the lake,[24] with average snowfall amounts exceeding 600 inches (1,500 cm) in the Wasatch Mountains.[25] The snow, which is often very light and dry due to the desert climate, is referred to as "The Greatest Snow on Earth" in the mountains. Lake-effect snow contributes to approximately 6-8 snowfalls per year in Salt Lake City, with approximately 10% of the city's precipitation being contributed by the phenomenon.[26]
North American Monsoon

The North American Monsoon (NAM) occurs from late June or early July into September, originating over Mexico and spreading into the southwest United States by mid-July. This allows the wet season to start in the Southwest during the summer rather than early fall as seen across the remainder of the West.[10] Within the United States, it affects Arizona, New Mexico, Nevada, Utah, Colorado, West Texas, and California. The North American monsoon is known to many as the Summer, Southwest, Mexican or Arizona monsoon.[27][28] It is also sometimes called the Desert Monsoon as a large part of the affected area is desert.
When precipitable water values near 1.32 inches (34 mm), brief but often torrential thunderstorms and the hurricane force winds and hail can occur, especially over mountainous terrain.[29] This activity is occasionally enhanced by the passage of retrograding (westward-moving) upper cyclones moving under the subtropical ridge and the entrainment of the remnants of tropical storms.[30][31] Tropical cyclones from the eastern Pacific contribute to the moisture within the monsoon system, and bring up to 20 percent of the average annual rainfall to southern California.[32] Flash flooding is a serious danger during the monsoon season. Dry washes can become raging rivers in an instant, even when no storms are visible as a storm can cause a flash flood tens of miles away. Lightning strikes are also a significant danger. Because it is dangerous to be caught in the open when these storms suddenly appear, many golf courses in Arizona have thunderstorm warning systems.
As much as 45% of the annual rainfall across New Mexico occurs during the summer monsoon.[33] Many desert plants are adapted to take advantage of this brief wet season. Because of the monsoons, the Sonoran and Mojave are considered relatively "wet" when ranked among other deserts such as the Sahara. Monsoons play a vital role in managing wildfire threat by providing moisture at higher elevations and feeding desert streams. Heavy monsoon rain can lead to excess winter plant growth, in turn a summer wildfire risk. A lack of monsoon rain can hamper summer seeding, reducing excess winter plant growth but worsening drought.

.jpg)
Great Plains
Downslope winds off the Rocky Mountains can aid in forming the dry line. Major drought episodes in the midwestern United States are associated with an amplification of the upper tropospheric subtropical (or monsoon) ridge across the West and Plains, along with a weakening of the western edge of the "Bermuda high".[34] During the summer, a southerly low-level jet draws moisture from the Gulf of Mexico. Additional moisture comes from more local sources, especially transpiring vegetation. Maximum precipitation generally occurs in late spring and early summer, with minimum precipitation in winter. During La Niña events, the storm track shifts far enough northward to bring wetter than normal conditions (in the form of increased snowfall) to the Midwestern states, as well as hot and dry summers.[35][36]
The convective season for the Plains ranges between May and September. Organized systems of thunderstorms known as mesoscale convective systems develop over the region during this period, with a bulk of the activity occurring between midnight and 6 a.m. local time. The time of maximum precipitation during the day gradually varies from late afternoon near the slopes of the Rockies to early morning near the Ohio River valley,[37] in part reflecting the west-to-east propagation of mesoscale convective systems. Mesoscale convective systems bring 30 to 70 percent of the annual warm season rainfall to the Plains.[38] An especially long-lived and well-organized type of mesoscale convective system called a mesoscale convective complex produces on average 8% to 18% of the annual warm season rainfall across the Plains and Midwest.[39] Squall lines account for 30% of the large thunderstorm complexes which move through the region.[40]
Gulf Coast and lower Atlantic Coast south of New England
In general, northern and western portions of this region have a winter/spring maximum in precipitation with late summer/early fall being drier,[41] while southern and eastern portions have a summer maximum and winter/early spring minimum in precipitation.
Most locations on the East Coast from Boston northward show a slight winter maximum as winter storms drop heavy precipitation. South of Boston, convective storms are common in the hot summer months and seasonal rainfall shows a slight summer maximum (though not at all stations). As one moves from Virginia Beach southward, summer becomes the wettest season, as convective thunderstorms created in the hot and moist tropical air mass drop brief but intense precipitation. In winter these areas still sees precipitation as low pressure systems moving across the southern United States often tap moisture from the Gulf of Mexico and drop cold season precipitation from eastern Texas to the New York area.
On the Florida peninsula, a strong monsoon becomes dominant, with dry winters and heavy summer rainfall. In winter the strong subtropical ridge creates the stable air over Florida with little convection and few fronts. Along the Gulf Coast, and the south Atlantic states, decaying tropical systems added to summers peak rainfall.[42]
Cold season
The subtropical jet stream brings in upper level moisture from the Pacific Ocean during the cold season. Ahead of storm systems, significant moisture becomes drawn in from the Gulf of Mexico, which increases moisture within the atmospheric column and leads to precipitation ahead of extratropical cyclones. During the El Niño portion of ENSO, increased precipitation falls along the Gulf coast and Southeast due to a stronger than normal, and more southerly, polar jet stream.[43] In the area around Memphis, Tennessee and across the state of Mississippi, there are two rainfall maxima in the winter and spring.[44][45] Across Georgia and South Carolina, the first of the annual precipitation maxima occurs in late winter, during February or March.[46][47] Alabama has an annual rainfall maximum in winter or spring and a dry summer.[48]
Warm season

During the summer, the subtropical ridge in the Atlantic Ocean strengthens, bringing in increasingly humid air from the warm Atlantic, Caribbean, and Gulf of Mexico. Once precipitable water values exceed 1.25 inches (32 mm), afternoon and evening thunderstorms break out at the western periphery of the subtropical ridge across the Southeast on a daily basis. Summer is the time of the second rainfall maximum during the year across Georgia, and the time of the main rainfall maximum in Florida.[46][49] During the late summer and fall, tropical cyclones move into the region from the Atlantic and Gulf of Mexico, supplying portions of the area with one-quarter of their annual rainfall, on average. Fall is the time of the rainfall minimum across Louisiana.[50] Sometimes, Gulf moisture sneaks up the Front Range of Rockies as far north as the northern High Plains, bringing higher dewpoint air into states such as Wyoming and Montana.
Great Lakes
Overall, late spring and early summer is the wettest time of year for the western portion of the region, with a winter minimum in precipitation. This is due to warm, moist, and unstable air moving along the jet stream where it is centralized. Which brings precipitation along the westerlies.[51] In contrast, eastern portions of the regions have two precipitation maximums, one during spring, and again in November. While July and August are the driest months in the region. The reason being that this region is further away from the unstable air of the central U.S and has more moderators to the climate. Due to the fact that storms and winds generally move west to east, the winds that blow from the Great Lakes during the summer keep the area more stable. With thunderstorms generally being less common.[52]
Cold season

Extratropical cyclones can bring moderate to heavy snowfall during the cold season. On the backside of these systems, particularly those moving through the eastern United States, lake effect snowfall is possible. Low level cold in the winter sweeping in from Canada combine with relatively warmer, unfrozen lakes to produce dramatic lake-effect snow on the eastern and southern shores of the Great Lakes.[53] Lake-effect precipitation produces a significant difference between the snowfall around the Great Lakes, sometimes within small distances. Lake effect snowfall accounts for 30 to 60 percent of the annual snowfall near the coasts of the Great Lakes.[54] Lake Erie has the distinction of being the only great lake capable of completely freezing over during the winter due to its relative shallowness.[55] Once frozen, the resulting ice cover alleviates lake-effect snow downwind of the lake. The influence of the Great Lakes allows the region to lie within a Humid Continental Climate regime.[56] Although certain scientists have argued that the eastern third resemble more of an oceanic climate[57]
Warm season

Weather systems in the westerlies that cause precipitation move along jet stream, which migrates north into the region by summer. This also increases the likelihood for severe weather to develop due to stronger upper-level divergence in its vicinity.[58] Mesoscale convective complexes move into the region from the Plains from late April through mid-July, with June the peak month for the western portions of the Great Lakes. These systems contribute about 2% of the annual precipitation for the region.[39] Also, remnants of tropical cyclones occasionally move northward into the region, though their overall contribution to precipitation across the region is minimal.[59] From the spring through the summer, areas near the shores of the relatively cooler Great Lakes develop sea breezes, which lowers rainfall amounts and increases sunshine near the immediate coastline.[54] The eastern Great Lakes are significantly drier during the summer.[52]
Northeast

Average precipitation across the region show maxima along the coastal plain and along the mountains of the Appalachians. Between 28 inches (710 mm) and 62 inches (1,600 mm) of precipitation falls annually across the area.[60] Seasonally, there are slight changes to precipitation distribution through the year. For example, Burlington, Vermont has a summer maximum and a winter minimum. In contrast, Portland, Maine has a fall and winter maximum, with a summer minimum in precipitation.[61] Temporally, a maximum in precipitation is seen around three peak times: 3 a.m., 10 a.m., and 6 p.m. During the summer, the 6 p.m. peak is most pronounced.[62]
Cold season
Coastal extratropical cyclones, known as nor'easters, bring a bulk of the wintry precipitation to the region during the cold season as they track parallel to the coastline, forming along the natural temperature gradient of the Gulf stream before moving up the coastline.[63] The Appalachian Mountains largely shield New York City and Philadelphia from picking up any lake-effect snow, though ocean-effect snows are possible near Cape Cod.[64] The Finger Lakes of New York are long enough for lake-effect precipitation. Lake-effect snow from the Finger Lakes occurs in upstate New York until those lakes freeze over.[65] Bay-effect snows fall downwind of Delaware Bay, Chesapeake Bay, and Massachusetts Bay when the basic criteria are met. Ocean effect snows are possible downwind of the Gulf Stream across the Southeast.[66]
Warm season
During the summer and early fall, mesoscale convective systems can move into the area from Canada and the Great Lakes. Tropical cyclones and their remains occasionally move into the region from the south and southwest.[67] Recently, the region has experienced a couple heavy rainfall events that exceeded the 50-year return period, during October 1996 and October 1998, which suggest an increase in heavy rainfall along the coast.[61]
Pacific islands
Hawaii

Snow, although not usually associated with tropics, falls at higher elevations on the Big Island, on Mauna Loa as well as Mauna Kea, which reaches an altitude of 13,796 feet (4,205 m), in some winter months. Snow only rarely falls on Maui's Haleakala. Mount Waiʻaleʻale (Waiʻaleʻale), on the island of Kauai, is notable for its extreme rainfall, as it has the second highest average annual rainfall on Earth, with 460 inches (12,000 mm).[68] Storm systems affect the state with heavy rains between October and March. Showers are common across the island chain, but thunderstorms are relatively rare. Local climates vary considerably on each island due to their topography, divisible into windward (Koʻolau) and leeward (Kona) regions based upon location relative to the higher mountains. The Kona coast is the only area in Hawaii with a summer precipitation maximum. Windward sides face the east to northeast trade winds and receive much more rainfall; leeward sides are drier and sunnier, with less rain and less cloud cover.[69] In the late winter and spring during El Niño events, drier than average conditions can be expected in Hawaii.[70]
Northern Marianas
The islands have a tropical marine climate moderated by seasonal northeast trade winds. There is a dry season which stretches from December to June, and a rainy season from July to November.[71] Saipan's average annual precipitation is 82.36 inches (2,092 mm), with 67 percent falling during the rainy season.[72] Typhoons frequent the island chain, which can lead to excessive rainfall.[73]
Guam

Guam's climate is moderated by east to northeast trade winds through the year. The average annual rainfall for the island is 86 inches (2,200 mm).[74] There is a distinct dry season from January to June, and a rainy season from July to December.[75] Typhoons frequent the island, which can lead to excessive rainfall. During El Niño years, dry season precipitation averages below normal. However, the threat of a tropical cyclone is over triple what is normal during El Niño years, so extreme shorter duration rainfall events are possible.[76]
American Samoa
American Samoa's climate regime is dominated by southeast trade winds. The island dependency is wet, with annual rainfall averaging near 120 inches (3,000 mm) at the airport, with amounts closer to 200 inches (5,100 mm) in other areas.[77] There is a distinct rainy season when tropical cyclones occasionally visit between November and April. The dry season lasts from May to October.[78] During El Niño events, precipitation averages about 10 percent above normal, while La Niña events lead to precipitation amounts which average close to 10 percent below normal.[79]
Pago Pago harbor in American Samoa has the highest annual rainfall of any harbor in the world.[80] This is due to the nearby Rainmaker Mountain.[80]
Atlantic islands
Puerto Rico
There is a pronounced rainy season from April to November across the commonwealth, encompassing the annual hurricane season. Due to the Commonwealth's topography, rainfall varies greatly across the archipelago. Pico del Este averages 171.09 inches (4,346 mm) of rainfall yearly while Magueyes Island averages only 29.32 inches (745 mm) a year.[81][82] Despite known changes in tropical cyclone activity due to changes in the El Niño/Southern Oscillation (ENSO),[83] there is no known relationship between rainfall in Puerto Rico and the ENSO cycle. However, when values of the North Atlantic oscillation are high during the winter, precipitation is lower than average for Puerto Rico.[84] There have not been any documented cases of snow falling within Puerto Rico, though occasionally it is brought in from elsewhere as a publicity stunt.[85]
United States Virgin Islands
The climate of the United States Virgin Islands has sustained easterly trade winds through the year. There is a rainy season which lasts from September to November, when hurricanes are more prone to visit the island chain.[86] The average rainfall through the island chain ranges from 51.55 inches (1,309 mm) at Annually to 37.79 inches (960 mm) at East Hill.[87]
Changes due to global warming
Increasing temperatures tend to increase evaporation which leads to more precipitation. As average global temperatures have risen, average global precipitation has also increased. Precipitation has generally increased over land north of 30°N from 1900 to 2005, but declined over the tropics since the 1970s. Eastern portions of North America have become wetter. There has been an increase in the number of heavy precipitation events over many areas during the past century, as well as an increase since the 1970s in the prevalence of droughts—especially in the tropics and subtropics. Over the contiguous United States, total annual precipitation increased at an average rate of 6.1 percent per century since 1900, with the greatest increases within the East North Central climate region (11.6 percent per century) and the South (11.1 percent). Hawaii was the only region to show a decrease (−9.25 percent).[89] From this excess precipitation, crop losses are expected to increase by US$3 billion (2002 dollars) annually over the next 30 years.[90]
See also
- Climate of the United States
- Drought in the United States
- Dust Bowl
- Floods in the United States
- List of wettest tropical cyclones in the United States
- Susan van den Heever, atmospheric scientist and professor
References
- ^ Martin A. Baxter, Charles E. Graves, and James T. Moore. A Climatology of Snow-to-Liquid Ratio for the Contiguous United States. Retrieved on 2008-03-21.
- ^ Seth Borenstein, Associated Press science writer (May 28, 2022). "Weather's unwanted guest: Nasty La Niña keeps popping up". 9news.com. Retrieved June 4, 2022.
"Scientists are noticing that in the past 25 years the world seems to be getting more La Niñas than it used to…"
- ^ Irina Ivanova (June 2, 2022). "California is rationing water amid its worst drought in 1,200 years". CBS News. Retrieved June 4, 2022.
- ^ NationalAtlas.gov Precipitation of the Individual States and of the Conterminous States. Archived 2010-03-15 at the Wayback Machine Retrieved on 2008-03-09.
- ^ Oregon Climate Service, Oregon State University The Climate of Oregon Climate Zone 2 Willamette Valley. Retrieved on 2014-08-06.
- ^ Illinois State Water Survey. Climate of Illinois. Archived 2008-06-25 at the Wayback Machine Retrieved on 2008-03-19.
- ^ Western Regional Climate Center. Climate of Alaska. Retrieved on 2008-03-19.
- ^ Mean Annual Precipitation in Alaska-Yukon Archived 2007-06-19 at the Wayback Machine. Oregon Climate Service at Oregon State University. Retrieved on 2006-10-23.
- ^ John Papineau, Ph.D. Understanding Alaska's Climate Variation. Archived 2008-05-11 at the Wayback Machine Retrieved on 2008-03-19.
- ^ a b J. Horel. Normal Monthly Precipitation, Inches. Archived September 1, 2006, at the Wayback Machine Retrieved on 2008-03-19.
- ^ a b Norman W. Junker. West Coast Cold Season Heavy Rainfall Events. Retrieved on 2008-03-01.
- ^ USA Today. How mountains influence rainfall patterns. Retrieved on 2008-02-29.
- ^ Arthur C. Benke and Colbert E. Cushing. Rivers of North America. Retrieved on 2008-03-01.
- ^ William Edward Duellman. Patterns of Distribution of Amphibians: A Global Perspective. Retrieved on 2008-03-01.
- ^ Arizona-Sonora Desert Museum. Lower Colorado River rain shadow. Archived 2008-02-06 at the Wayback Machine Retrieved on 2008-03-01.
- ^ Sierra Nevada Photos. Sierra Nevada Precipitation. Archived 2008-02-22 at the Wayback Machine Retrieved on 2008-02-29.
- ^ Olympic National Park. Olympic National Park Weather Page. Retrieved on 2008-03-01.
- ^ USA Today. Mt. Baker snowfall record sticks. Retrieved on 2008-02-29.
- ^ Sierra Nevada Photos. Average Annual Precipitation. Archived 2008-02-22 at the Wayback Machine Retrieved on 2008-03-01.
- ^ Colorado Basin River Forecast Center. Foreword. Retrieved on 2008-02-28.
- ^ John Monteverdi and Jan Null. WESTERN REGION TECHNICAL ATTACHMENT NO. 97-37 NOVEMBER 21, 1997: El Niño and California Precipitation. Archived December 27, 2009, at the Wayback Machine Retrieved on 2008-02-28.
- ^ Nathan Mantua. La Niña Impacts in the Pacific Northwest. Archived 2007-10-22 at the Wayback Machine Retrieved on 2008-02-29.
- ^ Steenburgh, W. J, 1999. Lake Effect of the Great Salt Lake: Scientific Overview and Forecast Diagnostics. Archived 2007-04-25 at the Wayback Machine Retrieved on 2008-03-01.
- ^ National Weather Service Forecast Office Salt Lake City, Utah. Maximum and Minimum Seasonal Snowfall: 1928-1929 to present. Archived 2004-12-17 at the Wayback Machine Retrieved on 2008-03-01.
- ^ Utah Center for Climate and Weather. Utah's Greatest Snow on Earth. Retrieved on 2008-03-01.
- ^ Deseret Morning News. Lake has great impacts on storm, weather Archived October 2, 2012, at the Wayback Machine. Retrieved on 1999-08-05.
- ^ Arizona State University Department of Geography. Basics of Arizona Monsoon. Archived 2009-05-31 at the Wayback Machine Retrieved on 2008-02-29.
- ^ New Mexico Tech. Lecture 17: 1. North American Monsoon System. Retrieved on 2008-02-29.
- ^ Norman W. Junker. Maddox Type IV Event Retrieved on 2008-02-29.
- ^ Climate Prediction Center. Reports to the Nation: The North American Monsoon. Archived 2016-12-26 at the Wayback Machine Retrieved on 2008-02-29.
- ^ David M. Roth (2012). Tropical Cyclone Rainfall for the West. Hydrometeorological Prediction Center. Retrieved on 2012-03-14.
- ^ Kristen L. Corbosiero; Michael J. Dickinson & Lance F. Bosart (2009). "The Contribution of Eastern North Pacific Tropical Cyclones to the Rainfall Climatology of the Southwest United States". Monthly Weather Review. American Meteorological Society. 137 (8): 2415–2435. Bibcode:2009MWRv..137.2415C. doi:10.1175/2009MWR2768.1. ISSN 0027-0644.
- ^ Elizabeth A. Ritchie. 27th Conference on Hurricanes and Tropical Meteorology P2.4: The impact of tropical cyclone remnants on the rainfall of the North American southwest region. Retrieved on 2008-02-29.
- ^ ClimaTrends. Drought patterns in the Midwest; 1988 and 2007. Retrieved on 2008-03-01.
- ^ Southeast Climate Consortium. SECC Winter Climate Outlook. Archived 2008-03-04 at the Wayback Machine Retrieved on 2008-02-29.
- ^ Reuters. La Nina could mean dry summer in Midwest and Plains. Retrieved on 2008-02-29.
- ^ Ahijevych, D. A., C. A. Davis, R. E. Carbone, and J. D. Tuttle, 2004: Initiation of Precipitation Episodes Relative to Elevated Terrain. J. Atmos. Sci. 61, 2763–2769.
- ^ William R. Cotton, Susan van den Heever, and Israel Jirak. Conceptual Models of Mesoscale Convective Systems: Part 9. Retrieved on 2008-03-23.
- ^ a b Walker S. Ashley, Thomas L. Mote, P. Grady Dixon, Sharon L. Trotter, Emily J. Powell, Joshua D. Durkee, and Andrew J. Grundstein. Distribution of Mesoscale Convective Complex Rainfall in the United States. Retrieved on 2008-03-02.
- ^ Brian A. Klimowski and Mark R. Hjelmfelt. Climatology and Structure of High Wind-Producing Mesoscale Convective Systems Over the Northern High Plains. Retrieved on 2008-03-01.
- ^ David M. Gaffin; David G. Hotz (2000). "A Precipitation and Flood Climatology with Synoptic Features of Heavy Rainfall across the Southern Appalachian Mountains" (PDF). 24 (3). National Weather Digest: 3–15.
{{cite journal}}: Cite journal requires|journal=(help) - ^ "Climate of Florida", Wikipedia, 2020-02-27, retrieved 2020-03-24
- ^ Climate Prediction Center. El Niño (ENSO) Related Rainfall Patterns Over the Tropical Pacific. Archived 2010-05-28 at the Wayback Machine Retrieved on 2008-02-28.
- ^ David M. Gaffin and Joseph C. Lowery. Monthly Precipitation for Memphis CWA from A Rainfall Climatology of the NWSFO Memphis County Warning Area (NOAA Technical Memorandum NWS SR-175, May 1996)
- ^ Southern Regional Climate Center. Climate Synopsis For Mississippi Retrieved on 2008-03-19.
- ^ a b Netstate. The Geography of Georgia. Retrieved on 2008-03-19.
- ^ South Carolina State Climatology Office. South Carolina Climate. Retrieved on 2008-03-18.
- ^ Jason C. Elliot. A Rainfall Climatology of the WSO Huntsville Hydrologic Service Area. Retrieved on 2008-03-19.
- ^ Southeast Regional Climate Center. Historical Climate Summaries for Florida. Retrieved on 2007-06-02.
- ^ Southern Regional Climate Center. Climate Synopsis for Louisiana. Retrieved on 2008-03-19.
- ^ "Climate of Chicago", Wikipedia, 2020-03-17, retrieved 2020-03-24
- ^ a b "Buffalo, New York Climate". www.bestplaces.net. Retrieved 2020-03-24.
- ^ Thomas W. Schmidlin. Climatic Summary of Snowfall and Snow Depth in the Ohio Snowbelt at Chardron. Retrieved on 2008-03-01.
- ^ a b Randall J. Schaetzl. Climate: Impacts of the Great Lakes.[permanent dead link] Retrieved on 2008-03-19.
- ^ Great Lakes Information Network. 6 | Introduction to the Great Lakes. Archived 2008-05-09 at the Wayback Machine Retrieved on 2008-03-01.
- ^ Troy M. Kimmel, Jr. GRG301K - WEATHER AND CLIMATE KOPPEN CLIMATE CLASSIFICATION FLOW CHART. Archived 2016-01-15 at the Wayback Machine Retrieved on 2008-03-19.
- ^ Metcalfe, John. "Where's the 'Dreariest' Place in America?". CityLab. Retrieved 2020-03-24.
- ^ Upper Michigan Weather. Archived 2008-12-02 at the Wayback Machine Retrieved on 2008-03-19.
- ^ David M. Roth. Tropical Cyclones in the Midwest. Retrieved on 2008-03-02.
- ^ Allan D. Randall (1996). Mean Annual Runoff, Precipitation, and Evapotranspiration in the Glaciated Northeast United States, 1951-1980. United States Geological Survey. Retrieved on 2008-03-01.
- ^ a b Barry Keim (June 1999). Current Climate of the New England Region: New England Regional Assessment. Archived 2012-02-20 at the Wayback Machine University of New Hampshire. Retrieved on 2008-03-19.
- ^ Michael G. Landin & Lance F. Bosart (June 1985). "Diurnal Variability of Precipitation in the Northeastern United States". Monthly Weather Review. American Meteorological Society. 113 (6): 989–1014. Bibcode:1985MWRv..113..989L. doi:10.1175/1520-0493(1985)113<0989:DVOPIT>2.0.CO;2.
- ^ George J. Maglaras; Jeff S. Waldstreicher; Paul J. Kocin; Anthony F. Gigi & Robert A. Marine (March 1995). "Winter Weather Forecasting throughout the Eastern United States. Part 1: An Overview". Weather and Forecasting. American Meteorological Society. 10 (1): 6. Bibcode:1995WtFor..10....5M. doi:10.1175/1520-0434(1995)010<0005:wwftte>2.0.co;2.
- ^ Frank P. Colby, Jr. (2003). Mesoscale Snow Bands in an Ocean-Effect Snowstorm. Archived 2012-02-20 at the Wayback Machine University of Massachusetts Lowell. Retrieved on 2008-03-01.
- ^ Neil F. Laird (2004). Understanding Lake-Effect Snow Storms in the Finger Lakes & Great Lakes Regions. Finger Lakes Institute. Retrieved on 2008-03-01.
- ^ COMET. Lake Effect-type Phenomena in Other Regions. Archived 2008-05-11 at the Wayback Machine Retrieved on 2006-11-05.
- ^ David R. Vallee (Summer 2002). A Centennial Review of Major Land-Falling Tropical Cyclones in Southern New England. Government of Massachusetts. Retrieved on 2008-03-01.
- ^ Diana Leone. Rain supreme. Retrieved on 2008-03-19.
- ^ Western Regional Climate Center. Climate of Hawaii. Archived 2008-03-14 at the Wayback Machine Retrieved on 2008-03-19.
- ^ Pao-Shin Chu. Hawaii Rainfall Anomalies and El Niño. Retrieved on 2008-03-19.
- ^ Central Intelligence Agency. The World Factbook -- Northern Mariana Islands. Retrieved on 2008-03-19.
- ^ BBC. Average Conditions: Saipan, Northern Mariana Islands. Retrieved on 2008-03-19.
- ^ BBC. Weather Centre - World Weather - Country Guides - Northern Mariana Islands. Retrieved on 2008-03-19.
- ^ United States Navy (2005-06-02). Naval Forces Marianas: Guam Climate. Retrieved on 2008-03-19.
- ^ Central Intelligence Agency. The World Factbook -- Guam. Retrieved on 2008-03-19.
- ^ Pacific ENSO Applications Climate Center. Pacific ENSO Update: 4th Quarter, 2006. Vol. 12 No. 4. Retrieved on 2008-03-19.
- ^ National Park of American Samoa. American Samoa. Retrieved on 2008-03-19.
- ^ Central Intelligence Agency. The World Factbook -- American Samoa. Retrieved on 2008-03-19.
- ^ Pacific ENSO Applications Climate Center. RAINFALL VARIATIONS DURING ENSO. Archived 2008-04-21 at the Wayback Machine Retrieved on 2008-03-19.
- ^ a b https://www.lonelyplanet.com/american-samoa/attractions/rainmaker-mountain/a/poi-sig/1456093/362248 Lonely Planet. Rainmaker Mountain. Retrieved September 7, 2019.
- ^ Southern Region Climate Center. Pico del Este Climatology. Retrieved on 2008-01-23.
- ^ Southern Region Climate Center. Magueyes Island Climatology. Retrieved on 2008-01-23.
- ^ Dr. David Hodell and Ray G. Thomas. Impacts of ENSO. Archived 2008-03-02 at the Wayback Machine Retrieved on 2008-03-19.
- ^ Björn A. Malmgren, Amos Winter, and Deliang Chen. El Niño–Southern Oscillation and North Atlantic Oscillation Control of Climate in Puerto Rico. Retrieved on 2008-03-19.
- ^ Associated Press. Canadian Snow Sails To Puerto Rico. Retrieved on 2008-01-23.
- ^ Central Intelligence Agency. The World Factbook -- Virgin Islands. Retrieved on 2008-03-19.
- ^ Southeast Regional Climate Center and The University of North Carolina. Historical Climate Summaries for Puerto Rico and the U.S. Virgin Islands. Archived 2008-03-21 at the Wayback Machine Retrieved on 2008-03-19.
- ^ "Climate at a Glance - National Centers for Environmental Information (NCEI)". www.ncdc.noaa.gov. Retrieved 2016-01-21.
- ^ Climate Change Division (2008-12-17). "Precipitation and Storm Changes". Environment Protection Agency. Retrieved 2009-07-17.
- ^ Cynthia Rosenzweig; Francesco N. Tubiello; Richard Goldberg; Evan Mills; Janine Bloomfield (2002). "Increased crop damage in the US from excess precipitation under climate change" (PDF). Global Environmental Change. 12 (3): 197–202. doi:10.1016/S0959-3780(02)00008-0. Archived from the original (PDF) on 2010-01-20. Retrieved 2009-07-17.
External links
- Last 24 hours of rainfall over the lower 48 - National Weather Service rainfall network
- Rainfall forecasts for the lower 48
- Current map of forecast precipitation over the United States during the next three hours.