
| ||||||||||||||||||||||||||
| Turnout | 74.93% (of registered voters) 59.08% (of eligible voters) | |||||||||||||||||||||||||
|---|---|---|---|---|---|---|---|---|---|---|---|---|---|---|---|---|---|---|---|---|---|---|---|---|---|---|
| ||||||||||||||||||||||||||
| ||||||||||||||||||||||||||
| ||||||||||||||||||||||||||


| Elections in California |
|---|
 |


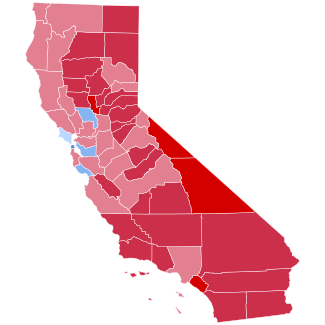
The 1984 United States presidential election in California took place on November 6, 1984, as part of the 1984 United States presidential election. State voters chose 47 representatives, or electors, to the Electoral College, who voted for president and vice president. California voted for the Republican incumbent and former California Governor, Ronald Reagan, in a landslide over the Democratic challenger, former Minnesota Senator and Vice President Walter Mondale. Reagan easily won his home state with a comfortable 16.24% margin and carried all but five counties. Despite this, California's margin was 1.97% more Democratic than the nation as a whole.
As of the 2020 presidential election, this is the last time for a Republican to carry the following California counties in a presidential election: Contra Costa, Humboldt, Lake, Los Angeles, Mendocino, San Mateo, Santa Clara, Solano and Sonoma.[2] Reagan is also the last candidate from either party to carry every county they won in the state with a majority. This is also the most recent occasion where a Republican won more than thirty percent of the vote in San Francisco, won the state by double digits (George H. W. Bush would win the state by a 3-point margin in 1988), and won every county of Greater Southern California.
Reagan became the first Republican ever to win the White House without Marin or Santa Cruz Counties. These were among a handful of counties nationwide that flipped against him.[a] As a result of this election, San Francisco and Alameda were the only two counties in California to have never been carried by Reagan in either of his campaigns for president or for Governor of California (Reagan also did not carry Yolo County in any of his presidential campaigns; however, he carried the county in his 1966 gubernatorial campaign).
YouTube Encyclopedic
-
1/5Views:362 16814 56443 2691 066305 504
-
The American Presidential Election of 1984
-
President Reagan's Trip to California, Voting and Watching Election Results on November 6, 1984
-
The 1984 Election Explained
-
President Reagan's Remarks at the Reelection Victory Celebration on November 6, 1984
-
The American Presidential Election of 1988
Transcription
Democratic primary
Jesse Jackson's voters were 50% black, 38% white, 7% Hispanic, and 5% were members of other groups. Massachusetts was the only state where black voters composed a smaller percentage of his supporters.[3]
Results
| 1984 United States presidential election in California[4] | |||||
|---|---|---|---|---|---|
| Party | Candidate | Votes | Percentage | Electoral votes | |
| Republican | Ronald Wilson Reagan (Incumbent) | 5,467,009 | 57.51% | 47 | |
| Democratic | Walter Frederick Mondale | 3,922,519 | 41.27% | 0 | |
| Libertarian | David Bergland | 115,513 | 1.22% | 0 | |
| American Independent | Bob Richards | 39,265 | 0.41% | 0 | |
| Peace and Freedom | Sonia Johnson | 26,297 | 0.28% | 0 | |
| No party | Write-in | 366 | 0.00% | 0 | |
| No party | Dennis L. Serrette (write-in) | 16 | 0.00% | 0 | |
| Invalid or blank votes | — | ||||
| Totals | 9,505,423 | 100.00% | 47 | ||
| Voter turnout | — | ||||
Results by county
| County | Ronald Reagan Republican |
Walter Mondale Democratic |
Various candidates Other parties |
Margin | Total votes cast | ||||
|---|---|---|---|---|---|---|---|---|---|
| # | % | # | % | # | % | # | % | ||
| Alameda | 192,408 | 40.01% | 282,041 | 58.65% | 6,425 | 1.34% | -89,633 | -18.64% | 480,874 |
| Alpine | 264 | 56.65% | 194 | 41.63% | 8 | 1.72% | 70 | 15.02% | 466 |
| Amador | 6,986 | 61.48% | 4,188 | 36.86% | 189 | 1.66% | 2,798 | 24.62% | 11,363 |
| Butte | 45,381 | 63.06% | 25,421 | 35.32% | 1,162 | 1.62% | 19,960 | 27.74% | 71,964 |
| Calaveras | 7,632 | 64.26% | 4,081 | 34.36% | 164 | 1.38% | 3,551 | 29.90% | 11,877 |
| Colusa | 3,388 | 65.30% | 1,725 | 33.25% | 75 | 1.45% | 1,663 | 32.05% | 5,188 |
| Contra Costa | 172,331 | 54.48% | 140,994 | 44.57% | 2,993 | 0.95% | 31,337 | 9.91% | 316,318 |
| Del Norte | 3,996 | 58.41% | 2,696 | 39.41% | 149 | 2.18% | 1,300 | 19.00% | 6,841 |
| El Dorado | 27,583 | 64.93% | 14,312 | 33.69% | 583 | 1.38% | 13,271 | 31.24% | 42,478 |
| Fresno | 104,757 | 54.30% | 86,315 | 44.74% | 1,864 | 0.96% | 18,442 | 9.56% | 192,936 |
| Glenn | 6,020 | 69.74% | 2,488 | 28.82% | 124 | 1.44% | 3,532 | 40.92% | 8,632 |
| Humboldt | 27,832 | 51.64% | 25,217 | 46.79% | 842 | 1.57% | 2,615 | 4.85% | 53,891 |
| Imperial | 13,829 | 62.01% | 8,237 | 36.94% | 235 | 1.05% | 5,592 | 25.07% | 22,301 |
| Inyo | 5,863 | 70.32% | 2,360 | 28.30% | 115 | 1.38% | 3,503 | 42.02% | 8,338 |
| Kern | 94,776 | 65.03% | 49,567 | 34.01% | 1,401 | 0.96% | 45,209 | 31.02% | 145,744 |
| Kings | 13,364 | 64.10% | 7,324 | 35.13% | 160 | 0.77% | 6,040 | 28.97% | 20,848 |
| Lake | 10,874 | 54.83% | 8,648 | 43.61% | 309 | 1.56% | 2,226 | 11.22% | 19,831 |
| Lassen | 5,352 | 61.09% | 3,254 | 37.14% | 155 | 1.77% | 2,098 | 23.95% | 8,761 |
| Los Angeles | 1,424,113 | 54.50% | 1,158,912 | 44.35% | 29,889 | 1.15% | 265,201 | 10.15% | 2,612,914 |
| Madera | 13,954 | 60.04% | 8,994 | 38.70% | 293 | 1.26% | 4,960 | 21.34% | 23,241 |
| Marin | 56,887 | 49.02% | 57,533 | 49.58% | 1,630 | 1.40% | -646 | -0.56% | 116,050 |
| Mariposa | 3,989 | 61.20% | 2,399 | 36.81% | 130 | 1.99% | 1,590 | 24.39% | 6,518 |
| Mendocino | 16,369 | 52.09% | 14,407 | 45.85% | 646 | 2.06% | 1,962 | 6.24% | 31,422 |
| Merced | 24,997 | 58.85% | 17,012 | 40.05% | 468 | 1.10% | 7,985 | 18.80% | 42,477 |
| Modoc | 2,995 | 69.49% | 1,219 | 28.28% | 96 | 2.23% | 1,776 | 41.21% | 4,310 |
| Mono | 2,659 | 72.31% | 962 | 26.16% | 56 | 1.53% | 1,697 | 46.15% | 3,677 |
| Monterey | 55,710 | 57.16% | 40,733 | 41.79% | 1,027 | 1.05% | 14,977 | 15.37% | 97,470 |
| Napa | 26,322 | 57.77% | 18,599 | 40.82% | 640 | 1.41% | 7,723 | 16.95% | 45,561 |
| Nevada | 19,809 | 62.36% | 11,198 | 35.25% | 761 | 2.39% | 8,611 | 27.11% | 31,768 |
| Orange | 635,013 | 74.70% | 206,272 | 24.27% | 8,792 | 1.03% | 428,741 | 50.43% | 850,077 |
| Placer | 38,035 | 62.94% | 21,294 | 35.24% | 1,098 | 1.82% | 16,741 | 27.70% | 60,427 |
| Plumas | 5,224 | 56.61% | 3,837 | 41.58% | 167 | 1.81% | 1,387 | 15.03% | 9,228 |
| Riverside | 182,324 | 63.48% | 102,043 | 35.53% | 2,835 | 0.99% | 80,281 | 27.95% | 287,202 |
| Sacramento | 204,922 | 55.56% | 159,128 | 43.14% | 4,791 | 1.30% | 45,794 | 12.42% | 368,841 |
| San Benito | 5,695 | 60.71% | 3,554 | 37.89% | 131 | 1.40% | 2,141 | 22.82% | 9,380 |
| San Bernardino | 222,071 | 64.80% | 116,454 | 33.98% | 4,180 | 1.22% | 105,617 | 30.82% | 342,705 |
| San Diego | 502,344 | 65.30% | 257,029 | 33.41% | 9,894 | 1.29% | 245,315 | 31.89% | 769,267 |
| San Francisco | 90,219 | 31.44% | 193,278 | 67.35% | 3,475 | 1.21% | -103,059 | -35.91% | 286,972 |
| San Joaquin | 81,795 | 59.61% | 53,846 | 39.24% | 1,572 | 1.15% | 27,949 | 20.37% | 137,213 |
| San Luis Obispo | 49,035 | 63.72% | 26,946 | 35.02% | 969 | 1.26% | 22,089 | 28.70% | 76,950 |
| San Mateo | 135,185 | 51.87% | 122,268 | 46.91% | 3,178 | 1.22% | 12,917 | 4.96% | 260,631 |
| Santa Barbara | 89,314 | 62.76% | 51,243 | 36.01% | 1,763 | 1.23% | 38,071 | 26.75% | 142,320 |
| Santa Clara | 288,638 | 54.81% | 229,865 | 43.65% | 8,136 | 1.54% | 58,773 | 11.16% | 596,639 |
| Santa Cruz | 41,652 | 45.20% | 49,091 | 53.27% | 1,404 | 1.53% | -7,439 | -8.07% | 92,147 |
| Shasta | 33,041 | 62.19% | 19,298 | 36.32% | 788 | 1.49% | 13,743 | 25.87% | 53,127 |
| Sierra | 1,078 | 56.86% | 781 | 41.19% | 37 | 1.95% | 297 | 15.67% | 1,896 |
| Siskiyou | 10,544 | 58.25% | 7,130 | 39.39% | 427 | 2.36% | 3,414 | 18.86% | 18,101 |
| Solano | 51,678 | 54.51% | 41,982 | 44.29% | 1,138 | 1.20% | 9,696 | 10.22% | 94,798 |
| Sonoma | 76,447 | 51.08% | 71,295 | 47.64% | 1,915 | 1.28% | 5,152 | 3.44% | 149,657 |
| Stanislaus | 55,665 | 59.23% | 37,459 | 39.86% | 861 | 0.91% | 18,206 | 19.37% | 93,985 |
| Sutter | 14,477 | 71.23% | 5,535 | 27.24% | 311 | 1.53% | 8,942 | 43.99% | 20,323 |
| Tehama | 11,586 | 62.78% | 6,527 | 35.37% | 342 | 1.85% | 5,059 | 27.41% | 18,455 |
| Trinity | 3,544 | 59.71% | 2,218 | 37.37% | 173 | 2.92% | 1,326 | 22.34% | 5,935 |
| Tulare | 51,066 | 63.88% | 28,065 | 35.11% | 812 | 1.01% | 23,001 | 28.77% | 79,943 |
| Tuolumne | 10,485 | 58.09% | 7,283 | 40.35% | 283 | 1.56% | 3,202 | 17.74% | 18,051 |
| Ventura | 151,383 | 68.67% | 66,550 | 30.19% | 2,529 | 1.14% | 84,833 | 38.48% | 220,462 |
| Yolo | 24,329 | 47.84% | 25,879 | 50.89% | 645 | 1.27% | -1,550 | -3.05% | 50,853 |
| Yuba | 9,780 | 63.52% | 5,339 | 34.68% | 278 | 1.80% | 4,441 | 28.84% | 15,397 |
| Total | 5,467,009 | 57.51% | 3,922,519 | 41.27% | 115,895 | 1.22% | 1,544,490 | 16.24% | 9,505,423 |
Counties that flipped from Republican to Democratic
References
- ^ "Historical Voter Registration and Participation in Statewide General Elections 1910-2018" (PDF). California Secretary of State. Retrieved May 5, 2022.
- ^ Sullivan, Robert David; ‘How the Red and Blue Map Evolved Over the Past Century’; America Magazine in The National Catholic Review; June 29, 2016
- ^ Ranney 1985, p. 54.
- ^ "1984 Presidential General Election Results - California". Dave Leip's U.S. Election Atlas. Retrieved August 25, 2008.
Notes
Works cited
- Ranney, Austin, ed. (1985). The American Elections of 1984. Duke University Press. ISBN 0822302306.
