
| |||||||||||||||||||||||||
All 8 Maryland seats to the United States House of Representatives | |||||||||||||||||||||||||
|---|---|---|---|---|---|---|---|---|---|---|---|---|---|---|---|---|---|---|---|---|---|---|---|---|---|
| |||||||||||||||||||||||||

| |||||||||||||||||||||||||
The 2010 congressional elections in Maryland were held on November 2, 2010, to determine who will represent the state of Maryland in the United States House of Representatives. Maryland has eight seats in the House, apportioned according to the 2000 United States census. Representatives are elected for two-year terms; those elected served in the 112th Congress from January 3, 2011 until January 3, 2013. The party primaries were held September 14, 2010.
As of 2021, this is the last time that Republicans won more than one congressional district in Maryland.
YouTube Encyclopedic
-
1/3Views:6 766 608588349
-
Why the UK Election Results are the Worst in History.
-
Know Your Lines: Gerrymandering U.S. Elections
-
Proposal 2 Ballot Discussion Nov 6 Election
Transcription
Hello Internet The UK had an election we need to talk about because after the debates finished, the people voted and the ballots tallied the results were this: But parliament ended up looking like this: Which isn't, exactly, representative. And by not exactly, I mean at all. Red earned 30% of the vote and 36% of the seats, which is sort of close, but the rest is madness: Orange earned 8% of the vote but got one eighth of that while Yellow's 5% just about doubled, and purple earned 13% and got squat. Meanwhile blue's 37% of the people booted to 51% of the seats in parliament. The blue boost is even bigger when you consider that 51% of the seats gives basically 100% the control. How'd this happen? In the UK -- national elections aren't really national, they're a bunch of local elections. The UK is divided into constituencies, each of which elects one member of parliament (M.P.) to represent them. This local / national divide is where the trouble begins. Imagine a parliament with just three constituencies, and it's easy to see how it wouldn't always align with citizens. Some people think this sort of result is fine -- “it's all *about* winning local elections,” they’ll say. “Each M.P. represents their constituency.” And while the imbalance in this example is dumb, but it's the same problem in the real election and this same argument is given, but there are two more problems with it in reality land. 1) Few citizens have any idea who their MP is, they just know what party they voted for -- what party they want to represent their views on the national level. And pretending like it's a local election is a bit disingenuous. -- in practice it's an election for now the nation will run -- not really for who is going to represent a tiny part of it. and even if it were 2) The individual constituencies are worse at representing their citizens than parliament. Indulge this spreadsheet-loving nerd for a moment, will you? The difference between what a party earned at the polls and what they got in parliament is the amount of misrepresentation error. If we calculate all the errors for all the parties and add them up we can say the Parliament as a whole has 47% percentage points of misrepresentation error. That sounds bad looks like a utopian rainbow of diversity compared to any local election because the local elections have *one* winner. Out of the 650 constituencies 647 have a higher representation error than parliament. These are the only three that don't and they're really unusual for having so many of a single kind of voter in one place. Most places look the The Wrekin which is dead in the middle a mere one-hundred and one points off. Note that the winning candidate didn't reach a majority here. Which means more than half of constituencies elected their MP with a minority of voters. The worst is Belfast South at the bottom of the list. Hilariously unrepresentative. Less than a quarter of the voters get to speak for the entire place in parliament. This is the the lowest percentage an M.P. has ever been elected by. So when people argue that the UK election is a bunch of local elections 1) people don't act like it, and 2) It's even more of an argument that the elections are broken because they're worse on this level. These local elections are unrepresentative because of the terrible 'First Past the Post' voting system -- which I have complained mightily about and won't repeat everything here -- go watch the video -- but TL;DR it only 'works' when citizens are limited to two choices. Voting for any party except the biggest makes it more likely the biggest will win by a minority -- which is exactly what happened. That citizens keep voting for smaller parties despite knowing the result is against their strategic interests demonstrates the citizenry wants diverse representation -- but that successes is the very thing that's made this the most unrepresentative parliament in the history of the UK. People happy with the results argue the system is working fine -- of course they do. Their team won. Government isn't a sport where a singular 'winner' must be determined. It's a system to make rules that everyone follows and so, we need a system where everyone can agree the process is fair even if the results don't go in their favor. If you support a system that disenfranchises people you don't like and turbo-franchises people you do -- then it doesn't look like you sport representative democracy, it looks like you support a kind of dictatorship light. Where a small group of people (including you) makes the rules for everyone. But as it is now, on election day the more people express what they want the worse the system looks which makes them disengaged at best or angry at worst and GEE I CAN'T IMAGINE WHY. This is fixable, there are many, many better ways the UK could vote -- here are two that even keep local representatives. And fixing voting really matters, because this is a kind of government illegitimacy score -- and it's been going up and may continue to do so unless this fundamentally broken voting system is changed.
Overview
| Party | Seats | Gains | Losses | Net gain/loss | Seats % | Votes % | Votes | +/− | |
|---|---|---|---|---|---|---|---|---|---|
| Democratic | 6 | 0 | 1 | –1 | 75% | 60.48% | 1,104,056 | -6.67% | |
| Republican | 2 | 1 | 0 | +1 | 25% | 36.94% | 674,246 | +6.41% | |
| Libertarian | 0 | 0 | 0 | 0 | — | 2.03% | 37,099 | +0.12% | |
| Constitution | 0 | 0 | 0 | 0 | — | 0.45% | 8,237 | +0.45% | |
| Other parties | 0 | 0 | 0 | 0 | — | 0.10% | 1,834 | -0.03% | |
| Totals | 8 | 1 | 1 | — | 100% | 100% | 1,825,472 | ||
By district
Results of the 2010 United States House of Representatives elections in Maryland by district:[2]
| District | Democratic | Republican | Others | Total | Result | ||||
|---|---|---|---|---|---|---|---|---|---|
| Votes | % | Votes | % | Votes | % | Votes | % | ||
| District 1 | 120,400 | 41.98% | 155,118 | 54.08% | 11,294 | 3.94% | 286,812 | 100.0% | Republican gain |
| District 2 | 134,133 | 64.21% | 69,523 | 33.28% | 5,248 | 2.51% | 208,904 | 100.0% | Democratic hold |
| District 3 | 147,448 | 61.07% | 86,947 | 36.01% | 7,034 | 2.91% | 241,429 | 100.0% | Democratic hold |
| District 4 | 160,228 | 83.44% | 31,467 | 16.39% | 325 | 0.17% | 192,020 | 100.0% | Democratic hold |
| District 5 | 155,110 | 64.26% | 83,575 | 34.62% | 2,698 | 1.12% | 241,383 | 100.0% | Democratic hold |
| District 6 | 80,455 | 33.22% | 148,820 | 61.45% | 12,914 | 5.33% | 242,189 | 100.0% | Republican hold |
| District 7 | 152,669 | 75.18% | 46,375 | 22.84% | 4,024 | 1.98% | 203,068 | 100.0% | Democratic hold |
| District 8 | 153,613 | 73.27% | 52,421 | 25.00% | 3,633 | 1.73% | 209,667 | 100.0% | Democratic hold |
| Total | 1,104,056 | 60.48% | 674,246 | 36.94% | 47,170 | 2.58% | 1,825,472 | 100.0% | |
| Elections in Maryland |
|---|
 |
|
|
District 1

The district encompasses the entire Eastern Shore of Maryland, as well as parts of Anne Arundel, Baltimore and Harford Counties.
Incumbent Democrat Frank Kratovil ran for re-election against Republican State Senator Andy Harris. Libertarian Richard Davis[3] and Independent Jack Wilson also ran.[4]
- MD - District 1 from OurCampaigns.com
- Race ranking and details from CQ Politics
- Campaign contributions from OpenSecrets
- Race profile[permanent dead link] at The New York Times
| Poll source | Dates administered | Frank Kratovil (D) |
Andy Harris (R) |
Richard Davis (L) |
Other | Undecided |
|---|---|---|---|---|---|---|
| Baltimore Sun/OpinionWorks | October 15–20, 2010 | 40% | 40% | — | — | 14% |
| Monmouth University | October 16–19, 2010 | 42% | 53% | — | — | 5% |
| The Hill/ANGA | October 5, 2010 | 40% | 43% | — | 1% | 15% |
| OnMessage Inc. | September 20–21, 2010 | 39% | 43% | — | — | — |
| Garin-Hart-Yang Research Group† | September 12–13, 2010 | 45% | 39% | — | — | — |
| Garin-Hart-Yang Research Group† | June 15–16, 2010 | 44% | 39% | — | — | 17% |
| Public Opinion Strategies | April 25–26, 2010 | 36% | 39% | 6% | 1% | 18% |
| Tarrance Group | November 15–17, 2009 | 39% | 52% | — | — | — |
† Internal poll for Kratovil campaign
| Party | Candidate | Votes | % | ±% | ||
|---|---|---|---|---|---|---|
| Republican | Andy Harris | 155,118 | 54.08% | +5.75 | ||
| Democratic | Frank Kratovil (incumbent) | 120,400 | 41.98% | -7.14 | ||
| Libertarian | Richard Davis | 10,876 | 3.79% | +1.33 | ||
| No party | Write-ins | 418 | 0.15% | |||
| Total votes | 286,812 | 100.00 | ||||
| Republican gain from Democratic | ||||||
District 2
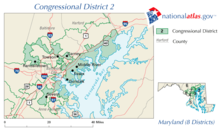
The district comprises parts of Harford, Baltimore, and Anne Arundel Counties, as well as small portions of the City of Baltimore, and has been represented by Democrat Dutch Ruppersberger since 2003; he ran for re-election against Republican Marcelo Cardarelli, a physician.
- Race ranking and details from CQ Politics
- Campaign contributions from OpenSecrets
- Race profile[permanent dead link] at The New York Times
| Party | Candidate | Votes | % | ±% | |
|---|---|---|---|---|---|
| Democratic | Dutch Ruppersberger (incumbent) | 134,133 | 64.21% | -7.65 | |
| Republican | Marcelo Cardarelli | 69,523 | 33.28% | +8.47 | |
| Libertarian | Lorenzo Gaztanaga | 5,090 | 2.44% | -0.74 | |
| No party | Write-ins | 158 | 0.08% | ||
| Total votes | 208,904 | 100.00 | |||
| Democratic hold | |||||
District 3
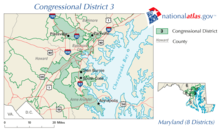
This gerrymandered district comprises portions of Baltimore, Howard and Anne Arundel counties, as well as a significant part of the independent city of Baltimore, and was represented by Democrat John Sarbanes since 2007. Sarbanes is the son of former Maryland Senator Paul Sarbanes. His Republican opponent was Jim Wilhelm.
- Race ranking and details from CQ Politics
- Campaign contributions from OpenSecrets
- profile[permanent dead link] at The New York Times
| Party | Candidate | Votes | % | ±% | |
|---|---|---|---|---|---|
| Democratic | John Sarbanes (incumbent) | 147,448 | 61.07% | -8.59 | |
| Republican | Jim Wilhelm | 86,947 | 36.01% | +5.93 | |
| Libertarian | Jerry McKinley | 5,212 | 2.16% | +2.16 | |
| Constitution | Alain Lareau | 1,634 | 0.68% | +0.68 | |
| No party | Write-ins | 188 | 0.08% | ||
| Total votes | 241,429 | 100.00 | |||
| Democratic hold | |||||
District 4

The district comprises portions of Prince George's and Montgomery Counties, and was represented by Democrat Donna Edwards. She ran for re-election against Republican Robert Broadus.
- Race ranking and details from CQ Politics
- Campaign contributions from OpenSecrets
- Race profile[permanent dead link] at The New York Times
| Party | Candidate | Votes | % | ±% | |
|---|---|---|---|---|---|
| Democratic | Donna Edwards (incumbent) | 160,228 | 83.44% | -2.39 | |
| Republican | Robert Broadus | 31,467 | 16.39% | +3.54 | |
| No party | Write-ins | 325 | 0.17% | ||
| Total votes | 192,020 | 100.00 | |||
| Democratic hold | |||||
District 5

The district comprises all of Charles, St. Mary's, and Calvert Counties, as well as portions of Prince George's and Anne Arundel Counties. The seat had been represented by Democrat and House Majority Leader Steny Hoyer since 1981. He was challenged by Republican Charles Lollar, the Chairman of the Charles County Republican Party, and Libertarian H. Gavin Shickle.[5]
- Race ranking and details from CQ Politics
- Campaign contributions from OpenSecrets
- Race profile[permanent dead link] at The New York Times
| Party | Candidate | Votes | % | ±% | |
|---|---|---|---|---|---|
| Democratic | Steny Hoyer (incumbent) | 155,110 | 64.26% | -9.39 | |
| Republican | Charles Lollar | 83,575 | 34.62% | +10.65 | |
| Libertarian | H. Gavin Shickle | 2,578 | 1.07% | -1.20 | |
| No party | Write-ins | 120 | 0.05% | ||
| Total votes | 241,383 | 100.00 | |||
| Democratic hold | |||||
District 6
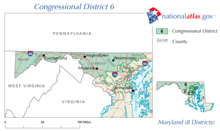
The district comprises all of Garrett, Allegany, Washington, Frederick and Carroll Counties, as well as portions of Montgomery, Baltimore, and Harford Counties, and had been represented by Republican Roscoe Bartlett since 1993. Democrat Andrew J. Duck challenged Roscoe Bartlett in 2010.
- Race ranking and details from CQ Politics
- Campaign contributions from OpenSecrets
- Race profile[permanent dead link] at The New York Times
| Party | Candidate | Votes | % | ±% | |
|---|---|---|---|---|---|
| Republican | Roscoe Bartlett (incumbent) | 148,820 | 61.45% | +3.69 | |
| Democratic | Andrew Duck | 80,455 | 33.22% | -5.57 | |
| Libertarian | Dan Massey | 6,816 | 2.81% | -0.54 | |
| Constitution | Michael Reed | 5,907 | 2.44% | +2.44 | |
| No party | Write-ins | 191 | 0.08% | ||
| Total votes | 242,189 | 100.00 | |||
| Republican hold | |||||
District 7
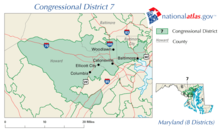
The district encompasses parts of Baltimore City, Baltimore County, and Howard County, and had been represented by Democrat Elijah Cummings since 1996. He was challenged for re-election by Republican Frank Mirabile.
- Race ranking and details from CQ Politics
- Campaign contributions from OpenSecrets
- Race profile[permanent dead link] at The New York Times
| Party | Candidate | Votes | % | ±% | |
|---|---|---|---|---|---|
| Democratic | Elijah Cummings (incumbent) | 152,669 | 75.18% | -4.32 | |
| Republican | Frank C. Mirabile | 46,375 | 22.84% | +4.26 | |
| Libertarian | Scott Spencer | 3,814 | 1.88% | +0.06 | |
| No party | Write-ins | 210 | 0.10% | ||
| Total votes | 203,068 | 100.00 | |||
| Democratic hold | |||||
District 8
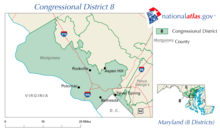
The district mostly consists of the larger part of Montgomery County, but also includes a small portion of Prince George's County, and had been represented by Democrat Chris Van Hollen since 2003. He was challenged by Republican Michael Lee Philips.
- Race ranking and details from CQ Politics
- Campaign contributions from OpenSecrets
- Race profile[permanent dead link] at The New York Times
| Party | Candidate | Votes | % | ±% | |
|---|---|---|---|---|---|
| Democratic | Chris Van Hollen (incumbent) | 153,613 | 73.27% | -1.81 | |
| Republican | Michael Lee Philips | 52,421 | 25.00% | +3.32 | |
| Libertarian | Mark Grannis | 2,713 | 1.29% | +0.45 | |
| Constitution | Fred Nordhorn | 696 | 0.33% | +0.33 | |
| No party | Write-ins | 224 | 0.11% | ||
| Total votes | 209,667 | 100.00 | |||
| Democratic hold | |||||
References
- ^ Office of the Clerk of the U.S. House of Representatives
- ^ Haas, Karen L. (June 3, 2011). "Statistics of the Congressional Election of November 2, 2010". Clerk of the U.S. House of Representatives. Retrieved November 12, 2019.
- ^ www.delmarvanow.com Archived August 7, 2009, at the Wayback Machine
- ^ Official candidate list Archived 2012-03-06 at the Wayback Machine Maryland Board of Elections
- ^ "Race Rating Change Tracker, 2010 Maps and Ratings: Maryland - 5th District". Roll Call. CQ Politics. March 2, 2010. Archived from the original on September 8, 2010. Retrieved August 27, 2010.
External links
- Maryland State Board of Elections
- U.S. Congress candidates for Maryland at Project Vote Smart
- Maryland U.S. House from OurCampaigns.com
- Campaign contributions for U.S. Congressional races in Maryland from OpenSecrets
- 2010 Maryland General Election graph of multiple polls from Pollster.com
- House - Maryland from The Cook Political Report
- Candidate blogs at The Baltimore Sun
| Preceded by 2008 elections |
United States House elections in Maryland 2010 |
Succeeded by 2012 elections |