
| Timeline of the 2012 Pacific hurricane season | |||||
|---|---|---|---|---|---|
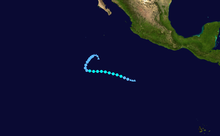
 Season summary map | |||||
| Season boundaries | |||||
| First system formed | May 14, 2012 | ||||
| Last system dissipated | November 3, 2012 | ||||
| Strongest system | |||||
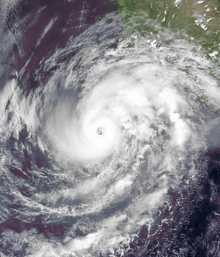
| Name | Emilia | ||||
| Maximum winds | 140 mph (220 km/h) (1-minute sustained) | ||||
| Lowest pressure | 945 mbar (hPa; 27.91 inHg) | ||||
| Longest lasting system | |||||
| Name | Daniel and Emilia (tie) | ||||
| Duration | 8.25 days | ||||
| |||||
The 2012 Pacific hurricane season was an above-average year in which seventeen named storms formed.[nb 1] The hurricane season officially began on May 15 in the east Pacific—defined as the region east of 140°W—and on June 1 in the central Pacific—defined as the region west of 140°W to the International Date Line—and ended on November 30 in both regions. These dates conventionally delimit the period during each year when most tropical cyclones form in the northeastern Pacific Ocean.[2] This year, the first storm of the season, Tropical Storm Aletta, formed on May 14, and the last, Tropical Storm Rosa, dissipated on November 3.
The season produced seventeen tropical storms; ten became hurricanes, and five further intensified into major hurricanes.[nb 2] Impact during the season was relatively minimal. In late May, Hurricane Bud paralleled the western Mexico coastline before dissipating, causing minor damage and but no reported fatalities.[4] In mid-June, Hurricane Carlotta came ashore in Oaxaca at Category 2 hurricane intensity, making it the easternmost tropical cyclone in the basin to make landfall at hurricane intensity since 1966. The storm killed seven and caused $12.4 million (2012 USD) in damage.[5]
This timeline includes information that was not released in real time, meaning that data from post-storm reviews by the National Hurricane Center, such as a storm that was not operationally warned upon, has been included. This timeline documents tropical cyclone formations, strengthening, weakening, landfalls, extratropical transitions, and dissipations during the season.
YouTube Encyclopedic
-
1/4Views:2 472 6481 1854 9115 102 746
-
The Atlantic Slave Trade: Crash Course World History #24
-
The 2003 typhoon season in the western North Pacific
-
Black Star Update August 11 2016
-
The Absurd True Scale of Pablo Escobar's Wealth Visualized
Transcription
Hi, my name is John Green, This is Crash Course: World History, and today we’re going to talk about slavery. Slavery is not funny. n fact, it’s very near the top of the list of things that aren’t funny, so today’s episode is gonna be a little light on the jokes. But, I’m gonna help you understand what pre-Civil War Americans often euphemistically referred to as the “peculiar institution.” [music intro] [music intro] [music intro] [music intro] [music intro] [music intro] Slavery is as old as civilization itself, although it’s not as old as humanity – thanks to our hunting and gathering foremothers. But the numbers involved in the Atlantic Slave Trade are truly staggering. From 1500 to 1880 CE, somewhere between 10 and 12 million African slaves were forcibly moved from Africa to the Americas. And about 15% of those people died during the journey. I know you’re saying, “That looks like a very nice ship, I mean my God it’s almost as big as South America.” Yeah, not to scale. And those who didn’t die became property, bought and sold like any commodity. Where Africans came from, and went to, changed over time, but in all, 48% of slaves went to the Caribbean and 41% to Brazil—although few Americans recognize this, relatively few slaves were imported to the U.S.—only about 5% of the total. It’s also worth noting that by the time Europeans started importing Africans into the Americas, Europe had a long history of trading slaves. The first real “European” slave trade began after the fourth Crusade in 1204. The Crusade that you will remember as the crazy one. [relatively speaking] Italian merchants imported thousands of Armenian, Circassian, and Georgian slaves to Italy. Most of them were women who worked as household servants, but many worked processing sugar. And sugar is, of course, a crop that African slaves later cultivated in the Caribbean. Camera 2 side note: None of primary crops grown by slaves, sugar, tobacco, coffee, is necessary to sustain human life. So in a way, slavery was a very early byproduct of a consumer culture that revolves around the purchase of goods that bring us pleasure but not sustenance. You are welcome to draw your own metaphorically resonant conclusions from this fact. One of the big misconceptions about slavery, at least when I was growing up, was that Europeans somehow captured Africans, put them in chains, stuck them on boats, and then took them to the Americas. The chains and ships bit is true, as is the America part if you define America as America and not as ‘Merica. But Africans were living in all kinds of conglomerations from small villages to city-states to empires, and they were much too powerful for the Europeans to just conquer. And, in fact, Europeans obtained African slaves by trading for them. Because trade is a two-way proposition, this meant that Africans were captured by other Africans and then traded to Europeans in exchange for goods, usually like metal tools, or fine textiles, or guns. And for those Africans, slaves were a form of property and a very valuable one. In many places, slaves were one of the only sources of private wealth because land was usually owned by the state. And this gets to a really important point: If we’re going to understand the tragedy of slavery, we need to understand the economics of it. We need to get inside what Mark Twain famously called a deformed conscience. We have to see slaves both as they were—as human beings—and as they were viewed—as an economic commodity. Right, so you probably know about the horrendous conditions aboard slave ships, which, at their largest could hold 400 people. But it’s worth underscoring that each slave had an average four square feet of space. That is four square feet. As one eyewitness testified before Parliament in 1791, “They had not so much room as a man in his coffin.” # [and I’m the jerk that gets claustrophobic in elevators] Once in the Americas, the surviving slaves were sold in a market very similar to the way cattle would be sold. After purchase, slave owners would often brand their new possession on the cheeks, again just as they would do with cattle. The lives of slaves were dominated by work and terror, but mostly work. Slaves did all types of work, from housework to skilled crafts work, and some even worked as sailors, but the majority of them worked as agricultural laborers. In the Caribbean and Brazil, most of them planted, harvested and processed sugar, working ten months out of the year, dawn until dusk. The worst part of this job, which was saying something because there were many bad parts, was fertilizing the sugar cane. This required slaves to carry 80 pound baskets of manure on their heads up and down hilly terrain. Mr. Green, Mr. Green. I think it’s time for a poop joke. No, I’m not, Me From the Past, because slavery isn’t funny. [like, at all] When it came time to harvest and process the cane, speed was incredibly important because once cut, sugar sap can go sour within a day. This meant that slaves would often work 48 hours straight during harvest time, working without sleep in the sweltering sugar press houses where the cane would be crushed in hand rollers and then boiled. Slaves often caught their hands in the rollers, and their overseers kept a hatchet on hand for amputations. I told you this wasn’t going to be funny. [anyone else reevaluating the hyperbolic vocab of modern oppression?] Given these appalling conditions, it’s little wonder that the average life expectancy for a Brazilian slave on a sugar plantation in the late 18th century was 23 years. Things were slightly better in British sugar colonies like Barbados, and in the U.S. living and working conditions were better still. So relatively good that in fact, slave populations began increasing naturally, meaning that more slaves were born than died. This may sound like a good thing, but it is of course it’s own kind of evil because it meant that slave owners were calculating that if they kept their slaves healthy enough, they would reproduce and then the slave owners could steal and sell their children. Or use them to work their land. Either way, blech. Anyway, this explains why even though the percentage of slaves imported from Africa to the United States was relatively small, slaves and other people of African descent, came to make up a significant portion of the US population. The brutality of working conditions in Brazil, on the other hand, meant that slaves were never able to increase their population naturally, hence the continued need to import slaves into Brazil until slavery ended in the 1880s. So, I noted earlier that slavery isn’t new. It’s also a hard word to define. Like, Stalin forced million to work in Gulags, but we don’t usually consider those people slaves. On the other hand, many slaves in history had lives of great power, wealth, and influence. Like remeber Zheng He, the world’s greatest admiral? He was technically a slave. So were many of the most important advisers to Sueleiman the Magnificent. So was Darth Vader. [still not over amputee hatchet] But, Atlantic World slavery was different, and more horrifying, because it was chattel slavery, a term historians use to indicate that the slaves were movable property. Oh, it’s time for the Open Letter? Ow. An Open Letter to the Word “Slave.” But first, let’s see what’s in the secret compartment today. Oh, it’s Boba Fett, noted owner of a ship called “Slave One.” And apparently a ballet dancer. Do do do do do do. [THE Stan, off camera] That’s a fine approximation of ballet music. Thank you, Stan. Alright, dear “slave,” as a word, you are overused. Like Britney Spears, I’m a slave number four letter U, no you’re not! Boba Fett’s ship, Slave One. A ship can’t be a slave. But more importantly, slave, you are constantly used in political rhetoric. And never correctly. There’s nothing new about this. Witness, for instance, all the early Americans claiming that paying the stamp tax would make them slaves. And that was in a time when they knew exactly what slavery looked like. Taxes, as I have mentioned before, can be very useful. I, for instance, like paved roads. But even if you don’t like a tax, it’s not slavery. [IT’S NOT SLAVERY.] Here, I have written for you a list of all the times it is okay to use the word “slave.” Oh, it is a one item long list. Best wishes, John Green. So what exactly makes slavery so horrendous? Well, definitions are slippery but I’m going to start with the definition of slavery proposed by sociologist Orlando Patterson: It is “the permanent, violent, and personal domination of natally alienated and generally dishonored persons.” According to this definition, a slave is removed from the culture, land, and society of his or her birth and suffers what Patterson called “social death.” Ultimately then, what makes slavery slavery is that slaves are de-humanized. The Latin word that gave us chattel also gave us cattle. In many ways, Atlantic slavery drew from a lot of previous models of slavery, and took everything that sucked about each of them and combined them into a big ball so that it would be the biggest possible ball of suck. [technical term] Stan, am I allowed to say “suck” on this show? Nice. Okay, to understand what I’m talking about, we need to look at some previous models of slavery. Let’s go to the Thought Bubble... The Greeks were among the first to consider “otherness” a characteristic of slaves. Most Greek slaves were “barbarians,” [bar bar bar barians?] and their inability to speak Greek kept them from talking back to their masters and also indicated their slave status. Aristotle, who despite being spectacularly wrong about almost everything was incredibly influential, believed some people were just naturally slaves, saying: “it is clear that there are certain people who are free and certain people who are slaves by nature, and it is both to their advantage, and just, for them to be slaves.” This idea, despite being totally insane, remained popular for millennia. The Greeks popularized the idea that slaves should be traded from far away, but the Romans took it to another level. Slaves probably made up 30% of the total Roman population, similar to the percentage of slaves in America at slavery’s height. The Romans also invented the plantation, using mass numbers of slaves to work the land on giant farms called latifundia. So called because they were not fun...dia. [too soon!!!!] The Judeo-Christian world contributed as well, and while we are not going to venture into the incredibly complicated role that slavery plays in the Bible because I vividly remember the comments section from the Christianity episode, the Bible was widely used to justify slavery and in particular the enslavement of Africans, because of the moment in Genesis when Noah curses Ham, saying: “Cursed be Canaan; / The lowest of slaves shall he be to his brothers.” This encapsulates two ideas vital to Atlantic slavery: 1. That slavery can be a hereditary status passed down through generations, and 2. That slavery is the result of human sin. Both ideas serve as powerful justifications for holding an entire race in bondage. Thanks, Thought Bubble. But there were even more contributors to the idea that led to Atlantic slavery. For instance, Muslim Arabs were the first to import large numbers of Bantu-speaking Africans into their territory as slaves. The Muslims called these Africans zanj, and they were a distinct and despised group, distinguished from other North Africans by the color of their skin. The zanj in territory held by the Abbasids staged one of the first big slave revolts in 869 CE. And it may be that this revolt was so devastating that it convinced the Abbasids that large-scale plantation style agriculture on the Roman model just wasn’t worth it. But by then, they’d connected the Aristotilian idea that some people are just naturally slaves with the appearance of sub-Saharan Africans. The Spanish and the Portuguese, you no doubt remember, were the Europeans with the closest ties to the Muslim world, because there were Muslims living in the Iberian Peninsula until 1492. So it makes sense that Iberians would be the first to absorb these racist attitude toward blacks. And as the first colonizers of the Americas and the dominant importers of slaves, the Portuguese and the Spanish helped define the attitudes that characterized Atlantic slavery, beliefs they’d inherited from a complicated nexus of all the slaveholders who came before them. In short, Atlantic Slavery was a monstrous tragedy— but it was a tragedy in which the whole world participated. And it was the culmination of millennia of imagining the “Other” as inherently Lesser. It’s tempting to pin all the blame for Atlantic slavery on one particular group, but to blame one group is to exonerate all the others, and by extension ourselves. The truth that we must grapple with is that a vast array of our ancestors— including those we think of as ours, whoever they may be— believed that it was possible for their fellow human beings to be mere property. Thanks for watching. I’ll see you next week. Crash Course is produced and directed by Stan Muller, our script supervisor is Danica Johnson. The show is written by my high school history teacher Raoul Meyer and myself. Our graphics team is ThoughtBubble, Last week’s Phrase of the Week was: "Cinnamon Challenge" I hate you for that, by the way. [seriously, grody to the max] If you want to suggest future phrases of the week you can do so in comments where you can also guess at this week's Phrase of the Week or ask questions of our team of historians. Thanks for watching. and as we say in my hometown, Don’t forget…ah, forget it. I got nothing. [this one's a heaping helping of heavy]
Timeline

May
May 14
- 1200 UTC (5:00 a.m. PDT) – Tropical Depression One-E develops from an area of low pressure about 655 mi (1,054 km) south of Manzanillo, Mexico.[6]
May 15
- The 2012 Pacific hurricane season officially begins.[2]
- 0000 UTC (5:00 p.m. PDT May 14) – Tropical Depression One-E intensifies into Tropical Storm Aletta.[6]
May 16
- 0000 UTC (5:00 p.m. PDT May 15) – Tropical Storm Aletta attains its peak intensity with maximum sustained winds of 50 mph (80 km/h) and a minimum barometric pressure of 1000 mb (hPa; 29.53 inHg).[6]
May 17
- 0600 UTC (11:00 p.m. PDT May 16) – Tropical Storm Aletta weakens to a tropical depression roughly 825 mi (1,328 km) southwest of the southern tip of Baja California.[6]
May 19
- 0600 UTC (11:00 p.m. PDT May 18) – Tropical Depression Aletta degenerates into a non-convective remnant area of low pressure.[6]
May 20
- 1800 UTC (11:00 a.m. PDT) – Tropical Depression Two-E develops from an area of low pressure about 520 mi (840 km) south of Acapulco, Mexico.[4]
May 22
- 0600 UTC (11:00 p.m. PDT May 21) – Tropical Depression Two-E intensifies into Tropical Storm Bud roughly 495 mi (797 km) south-southwest of Acapulco, Mexico.[4]
May 24
- 0000 UTC (5:00 p.m. PDT May 23) – Tropical Storm Bud intensifies into a Category 1 hurricane on the Saffir–Simpson hurricane wind scale, becoming the first of the 2012 season.[4]
- 1200 UTC (5:00 a.m. PDT) – Hurricane Bud intensifies into a Category 2 hurricane.[4]
May 25
- 0000 UTC (5:00 p.m. PDT May 24) – Hurricane Bud intensifies into a Category 3 hurricane, the first major hurricane of the 2012 season, and simultaneously attains its peak intensity with winds of 115 mph (185 km/h) and a minimum barometric pressure of 961 mb (hPa; 28.38 inHg).[4]
- 0600 UTC (11:00 p.m. PDT May 24) – Hurricane Bud weakens to a Category 2 hurricane.[4]
- 1800 UTC (11:00 a.m. PDT) – Hurricane Bud weakens to a Category 1 hurricane about 80 mi (130 km) west-southwest of Manzanillo, Mexico.[4]
May 26
- 0000 UTC (5:00 p.m. PDT May 25) – Hurricane Bud weakens to a tropical storm.[4]
- 0600 UTC (11:00 p.m. PDT May 25) – Tropical Storm Bud degenerates into a non-convective remnant area of low pressure near the southwestern coast of Mexico.[4]
June
June 14
- 0000 UTC (5:00 p.m. PDT June 13) – Tropical Depression Three-E develops from an area of low pressure roughly 530 mi (850 km) south-southeast of Huatulco, Mexico.[7]
- 0600 UTC (11:00 p.m. PDT June 13) – Tropical Depression Three-E intensifies into Tropical Storm Carlotta.[7]
June 15

- 1200 UTC (5:00 a.m. PDT) – Tropical Storm Carlotta intensifies into a Category 1 hurricane about 365 mi (587 km) southeast of Acapulco, Mexico.[7]
- 1800 UTC (11:00 a.m. PDT) – Hurricane Carlotta rapidly intensifies into a Category 2 hurricane.[7]
- 2100 UTC (2:00 p.m. PDT) – Hurricane Carlotta attains its peak intensity with maximum sustained winds of 110 mph (180 km/h) and a minimum barometric pressure of 973 mb (hPa; 28.71 inHg).[7]
June 16
- 0100 UTC (6:00 p.m. PDT June 15) – Hurricane Carlotta makes landfall near Puerto Escondido, Mexico, with winds of 105 mph (169 km/h).[7]
- 0600 UTC (11:00 p.m. PDT June 15) – Hurricane Carlotta weakens to a Category 1 hurricane.[7]
- 0900 UTC (2:00 a.m. PDT) – Hurricane Carlotta weakens to a tropical storm.[7]
- 1200 UTC (5:00 a.m. PDT) – Tropical Storm Carlotta weakens to a tropical depression roughly 60 mi (97 km) north-northeast of Acapulco, Mexico.[7]
June 17
- 0000 UTC (5:00 p.m. PDT June 16) – Tropical Depression Carlotta degenerates into a non-convective remnant area of low pressure about 100 mi (160 km) northeast of Zihuatanejo, Mexico.[7]
July
July 4
- 0600 UTC (11:00 p.m. PDT July 3) – Tropical Depression Four-E develops from an area of low pressure about 490 mi (790 km) south of Manzanillo, Mexico.[8]
July 5
- 0600 UTC (11:00 p.m. PDT July 4) – Tropical Depression Four-E intensifies into Tropical Storm Daniel roughly 475 mi (764 km) southwest of Manzanillo, Mexico.[8]
July 7

- 0000 UTC (5:00 p.m. PDT July 6) Tropical Storm Daniel intensifies into a Category 1 hurricane about 720 mi (1,160 km) southwest of the southern tip of Baja California.[8]
- 1800 UTC (11:00 a.m. PDT) – Tropical Depression Five-E develops from an area of low pressure roughly 495 mi (797 km) south-southwest of Acapulco, Mexico.[9]
July 8
- 0000 UTC (5:00 p.m. PDT July 7) – Hurricane Daniel intensifies into a Category 2 hurricane.[8]
- 0000 UTC (5:00 p.m. PDT July 7) – Tropical Depression Five-E intensifies into Tropical Storm Emilia about 490 mi (790 km) south-southwest of Acapulco, Mexico.[9]
- 0600 UTC (11:00 p.m. PDT July 7) – Hurricane Daniel intensifies into a Category 3 hurricane and simultaneously attains its peak intensity with winds of 115 mph (185 km/h) and a minimum barometric pressure of 961 mb (hPa; 28.38 inHg).[8]
- 1200 UTC (5:00 a.m. PDT) – Hurricane Daniel weakens to a Category 2 hurricane roughly 1,015 mi (1,633 km) southwest of the southern tip of Baja California.[8]
July 9
- 0600 UTC (11:00 p.m. PDT July 8) – Hurricane Daniel weakens to a Category 1 hurricane.[8]
- 0600 UTC (11:00 p.m. PDT July 8) – Tropical Storm Emilia intensifies into a Category 1 hurricane about 680 mi (1,090 km) southwest of Acapulco, Mexico.[9]
- 1200 UTC (5:00 a.m. PDT) – Hurricane Emilia rapidly intensifies into a Category 2 hurricane.[9]
July 10

- 0000 UTC (5:00 p.m. PDT July 9) – Hurricane Emilia rapidly intensifies into a Category 3 hurricane.[9]
- 0600 UTC (11:00 p.m. PDT July 9) – Hurricane Daniel weakens to a tropical storm about 1,465 mi (2,358 km) southeast of the Hawaiian Islands.[8]
- 0600 UTC (11:00 p.m. PDT July 9) – Hurricane Emilia intensifies into a Category 4 hurricane and simultaneously attains its peak intensity with winds of 135 mph (217 km/h) and a minimum barometric pressure of 945 mb (hPa; 27.91 inHg).[9]
- 1800 UTC (11:00 a.m. PDT) – Hurricane Emilia weakens to a Category 3 hurricane.[9]
July 11
- 0000 UTC (5:00 p.m. PDT July 10) – Hurricane Emilia weakens to a Category 2 hurricane roughly 685 mi (1,102 km) south-southwest of the southern tip of Baja California.[9]
- 1800 UTC (11:00 a.m. PDT) – Tropical Storm Daniel weakens to a tropical depression.[8]
- 1800 UTC (11:00 a.m. PDT) – Hurricane Emilia re-intensifies into a Category 3 hurricane.[9]
July 12
- 0000 UTC (5:00 p.m. PDT July 11) – Tropical Depression Six-E develops from an area of low pressure about 405 mi (652 km) south of Mazanillo, Mexico.[10]
- 0600 UTC (11:00 p.m. PDT July 11) – Tropical Depression Six-E intensifies into Tropical Storm Fabio.[10]
- 1200 UTC (5:00 a.m. PDT) – Tropical Depression Daniel degenerates into a non-convective remnant area of low pressure roughly 665 mi (1,070 km) southeast of the Hawaiian Islands.[8]
- 1800 UTC (11:00 a.m. PDT) – Hurricane Emilia weakens to a Category 2 hurricane for a second time.[9]
July 13
- 0000 UTC (5:00 p.m. PDT July 12) – Hurricane Emilia weakens to a Category 1 hurricane about 1,000 mi (1,600 km) southwest of the southern tip of Baja California.[9]
- 1200 UTC (5:00 a.m. PDT) – Hurricane Emilia weakens to a tropical storm.[9]
- 1800 UTC (11:00 a.m. PDT) – Tropical Storm Fabio intensifies into a Category 1 hurricane roughly 515 mi (829 km) southwest of Manzanillo, Mexico.[10]
July 14

- 1800 UTC (11:00 a.m. PDT) – Hurricane Fabio intensifies into a Category 2 hurricane.[10]
July 15
- 0600 UTC (11:00 p.m. PDT July 14) – Hurricane Fabio attains its peak intensity with maximum sustained winds of 110 mph (180 km/h) and a minimum barometric pressure of 966 mb (hPa; 28.53 inHg).[10]
- 1800 UTC (11:00 a.m. PDT) – Tropical Storm Emilia degenerates into a non-convective remnant area of low pressure roughly 1,110 mi (1,790 km) southeast of the Hawaiian Islands.[9]
July 16
- 0000 UTC (5:00 p.m. PDT July 15) – Hurricane Fabio weakens to a Category 1 hurricane.[10]
- 1800 UTC (11:00 a.m. PDT) – Hurricane Fabio weakens to a tropical storm about 700 mi (1,100 km) southwest of the southern tip of Baja California.[10]
July 18
- 0000 UTC (5:00 p.m. PDT July 17) – Tropical Storm Fabio weakens to a tropical depression.[10]
- 1200 UTC (5:00 a.m. PDT) – Tropical Depression Fabio degenerates into a non-convective remnant area of low pressure roughly 400 mi (640 km) west-southwest of Punta Eugenia, Mexico.[10]
August
August 7
- 0600 UTC (11:00 p.m. PDT August 6) – Tropical Depression Seven-E develops from an area of low pressure about 600 mi (970 km) west-southwest of Manzanillo, Mexico.[11]
- 1800 UTC (11:00 a.m. PDT) – Tropical Depression Seven-E intensifies into Tropical Storm Gilma roughly 565 mi (909 km) west-southwest of Manzanillo, Mexico.[11]
August 8

- 1800 UTC (11:00 a.m. PDT) – Tropical Storm Gilma intensifies into a Category 1 hurricane.[11]
August 9
- 0600 UTC (11:00 p.m. PDT August 8) – Hurricane Gilma attains its peak intensity with maximum sustained winds of 80 mph (130 km/h) and a minimum barometric pressure of 984 mb (hPa; 29.06 inHg).[11]
- 1800 UTC (11:00 a.m. PDT) – Hurricane Gilma weakens to a tropical storm about 700 mi (1,100 km) southwest of the southern tip of Baja California.[11]
August 11
- 1200 UTC (5:00 a.m. PDT) – Tropical Storm Gilma degenerates into a non-convective remnant area of low pressure roughly 680 mi (1,090 km) west-southwest of the southern tip of Baja California.[11]
- 1200 UTC (5:00 a.m. PDT) – Tropical Depression Eight-E develops from an area of low pressure about 125 mi (201 km) south-southwest of Manzanillo, Mexico.[12]
- 1800 UTC (11:00 a.m. PDT) – Tropical Depression Eight-E intensifies into Tropical Storm Hector roughly 180 mi (290 km) south-southwest of Manzanillo, Mexico.[12]
August 12
- 1200 UTC (5:00 a.m. PDT) – Tropical Storm Hector attains its peak intensity with maximum sustained winds of 50 mph (80 km/h) and a minimum barometric pressure of 995 mb (hPa; 29.39 inHg).[12]
August 15
- 1200 UTC (5:00 a.m. PDT) – Tropical Storm Hector weakens to a tropical depression about 495 mi (797 km) southwest of the southern tip of Baja California.[12]
August 17
- 0000 UTC (5:00 p.m. PDT August 16) – Tropical Depression Hector degenerates into a non-convective remnant area of low pressure roughly 440 mi (710 km) southwest of the southern tip of Baja California.[12]
August 27
- 1200 UTC (5:00 a.m. PDT) – Tropical Depression Nine-E develops from an area of low pressure about 375 mi (604 km) south-southwest of Manzanillo, Mexico.[13]
- 1800 UTC (11:00 a.m. PDT) – Tropical Depression Nine-E intensifies into Tropical Storm Ileana roughly 315 mi (507 km) south-southwest of Manzanillo, Mexico.[13]
August 30

- 0000 UTC (5:00 p.m. PDT August 29) – Tropical Storm Ileana intensifies into a Category 1 hurricane about 340 mi (550 km) south-southwest of the southern tip of Baja California.[13]
- 1800 UTC (11:00 a.m. PDT) – Hurricane Ileana attains its peak intensity with maximum sustained winds of 85 mph (140 km) and a minimum barometric pressure of 978 mb (hPa; 28.88 inHg).[13]
August 31
- 1800 UTC (11:00 a.m. PDT) – Hurricane Ileana weakens to a tropical storm roughly 375 mi (604 km) west-southwest of the southern tip of Baja California.[13]
September
September 2
- 0600 UTC (11:00 p.m. PDT September 1) – Tropical Storm Ileana weakens to a tropical depression about 660 mi (1,060 km) west of the southern tip of Baja California.[13]
- 1200 UTC (5:00 a.m. PDT) – Tropical Depression Ileana degenerates into a non-convective remnant area of low pressure roughly 1,380 mi (2,220 km) east-southeast of the Hawaiian Islands.[13]
- 1200 UTC (5:00 a.m. PDT) – Tropical Storm John develops from an area of low pressure about 230 mi (370 km) southwest of Manzanillo, Mexico.[14]
September 3
- 0000 UTC (5:00 p.m. PDT September 2) – Tropical Storm John attains its peak intensity with maximum sustained winds of 45 mph (72 km/h) and a minimum barometric pressure of 1000 mb (hPa; 29.53 inHg).[14]
September 4
- 0000 UTC (5:00 p.m. PDT September 3) – Tropical Storm John weakens to a tropical depression.[14]
- 1200 UTC (5:00 a.m. PDT) – Tropical Depression John degenerates into a non-convective remnant area of low pressure roughly 395 mi (636 km) west-northwest of the southern tip of Baja California.[14]
September 12
- 0600 UTC (11:00 p.m. PDT September 11) – Tropical Depression Eleven-E develops from an area of low pressure about 175 mi (282 km) south-southwest of Manzanillo, Mexico.[15]
- 1200 UTC (5:00 a.m. PDT) – Tropical Depression Eleven-E intensifies into Tropical Storm Kristy roughly 150 mi (240 km) south-southwest of Manzanillo, Mexico.[15]
September 14
- 0600 UTC (11:00 p.m. PDT September 13) – Tropical Storm Kristy attains its peak intensity with maximum sustained winds of 60 mph (97 km/h) and a minimum barometric pressure of 998 mb (hPa; 29.47 inHg).[15]
September 15
- 1200 UTC (5:00 a.m. PDT) – Tropical Depression Twelve-E develops from an area of low pressure about 1,080 mi (1,740 km) southwest of Cabo San Lucas, Mexico.[16]
- 1800 UTC (11:00 a.m. PDT) – Tropical Depression Twelve-E intensifies into Tropical Storm Lane.[16]
September 16
- 1800 UTC (11:00 a.m. PDT) – Tropical Storm Kristy weakens to a tropical depression about 540 mi (870 km) west-northwest of Cabo San Lucas, Mexico.[15]
September 17

- 0600 UTC (11:00 p.m. PDT September 16) – Tropical Depression Kristy degenerates into a non-convective remnant area of low pressure roughly 625 mi (1,006 km) west-northwest of Cabo San Lucas, Mexico.[15]
- 0600 UTC (11:00 p.m. PDT September 16) – Tropical Storm Lane intensifies into a Category 1 hurricane about 1,170 mi (1,880 km) southwest of the southern tip of Baja California.[16]
September 18
- 0000 UTC (5:00 p.m. PDT September 17) – Hurricane Lane attains its peak intensity with maximum sustained winds of 85 mph (137 km/h) and a minimum barometric pressure of 985 mb (hPa; 28.29 inHg).[16]
- 1200 UTC (5:00 a.m. PDT) – Hurricane Lane weakens to a tropical storm.[16]
September 19
- 0600 UTC (11:00 p.m. PDT September 18) – Tropical Storm Lane degenerates into a non-convective remnant area of low pressure roughly 1,330 mi (2,140 km) west-southwest of the southern tip of Baja California.[16]
September 22
- 0000 UTC (5:00 p.m. PDT September 21) – Tropical Depression Thirteen-E develops from an area of low pressure about 415 mi (668 km) south-southwest of Manzanillo, Mexico.[17]
- 1200 UTC (5:00 a.m. PDT) – Tropical Depression Thirteen-E intensifies into Tropical Storm Miriam.[17]
September 24
- 0000 UTC (5:00 p.m. PDT September 23) – Tropical Storm Miriam intensifies into a Category 1 hurricane roughly 465 mi (748 km) southwest of Manzanillo, Mexico.[17]
- 0600 UTC (11:00 p.m. PDT September 23) – Hurricane Miriam rapidly intensifies into a Category 2 hurricane.[17]
- 1200 UTC (5:00 a.m. PDT) – Hurricane Miriam rapidly intensifies into a Category 3 hurricane and simultaneously attains its peak intensity with maximum sustained winds of 120 mph (190 km/h) and a minimum barometric pressure of 959 mb (hPa; 28.32 inHg).[17]

September 25
- 0600 UTC (11:00 p.m. PDT September 24) – Hurricane Miriam weakens to a Category 2 hurricane.[17]
- 1800 UTC (11:00 a.m. PDT) – Hurricane Miriam weakens to a Category 1 hurricane about 685 mi (1,102 km) west of Manzanillo, Mexico.[17]
September 26
- 0600 UTC (11:00 p.m. PDT September 25) – Hurricane Miriam weakens to a tropical storm.[17]
September 27
- 1800 UTC (11:00 a.m. PDT) – Tropical Storm Miriam degenerates into a non-convective remnant area of low pressure roughly 435 mi (700 km) west-southwest of the southern tip of Baja California.[17]
September 28
- 0600 UTC (11:00 p.m. PDT September 27) – Tropical Storm Norman develops from an area of low pressure about 115 mi (185 km) southeast of Cabo San Lucas, Mexico and simultaneously attains its peak intensity with maximum sustained winds of 50 mph (80 km/h) and a minimum barometric pressure of 997 mb (hPa; 29.44 inHg).[18]
September 29
- 0500 UTC (10:00 p.m. PDT September 27) – Tropical Storm Norman weakens to a tropical depression and simultaneously makes landfall near Topolobampo, Mexico, with winds of 35 mph (56 km/h).[18]
- 1200 UTC (5:00 a.m. PDT) – Tropical Depression Norman degenerates into a non-convective remnant area of low pressure about 80 mi (130 km) west-northwest of Los Mochis, Mexico.[18]
October
October 6

- 1200 UTC (5:00 a.m. PDT) – Tropical Depression Fifteen-E develops from an area of low pressure roughly 860 mi (1,380 km) southwest of the southern tip of Baja California.[19]
- 1800 UTC (11:00 a.m. PDT) – Tropical Depression Fifteen-E intensifies into Tropical Storm Olivia about 880 mi (1,420 km) southwest of the southern tip of Baja California.[19]
October 7
- 1200 UTC (5:00 a.m. PDT) – Tropical Storm Olivia attains its peak intensity with maximum sustained winds of 60 mph (97 km/h) a minimum barometric pressure of 997 mb (hPa; 29.44 inHg).[19]
October 9
- 0000 UTC (5:00 p.m. PDT October 8) – Tropical Storm Olivia degenerates into a non-convective remnant area of low pressure roughly 885 mi (1,424 km).[19]
October 13
- 1200 UTC (5:00 a.m. PDT) – Tropical Depression Sixteen-E develops from an area of low pressure about 645 mi (1,038 km) south-southwest of Cabo San Lucas, Mexico.[20]
- 1800 UTC (11:00 a.m. PDT) – Tropical Depression Sixteen-E intensifies into Tropical Storm Paul.[20]
October 15

- 0600 UTC (11:00 p.m. PDT October 14) – Tropical Storm Paul intensifies into a Category 1 hurricane roughly 595 mi (958 km) southwest of Cabo San Lucas, Mexico.[20]
- 1800 UTC (11:00 a.m. PDT) – Hurricane Paul rapidly intensifies into a Category 3 hurricane and simultaneously attains its peak intensity with maximum sustained winds of 120 mph (190 km/h) and a minimum barometric pressure of 959 mb (hPa; 28.32 inHg).[20]
October 16
- 1200 UTC (5:00 a.m. PDT) – Hurricane Paul weakens to a Category 2 hurricane.[20]
- 1800 UTC (11:00 a.m. PDT) – Hurricane Paul weakens to a Category 1 hurricane about 40 mi (64 km) south-southwest of Cabo San Lazaro, Mexico.[20]
October 17
- 0000 UTC (5:00 p.m. PDT October 16) – Hurricane Paul weakens to a tropical storm.[20]
- 0600 UTC (11:00 p.m. PDT October 16) – Tropical Storm Paul degenerates into a non-convective remnant area of low pressure roughly 30 mi (48 km) northwest of Cabo San Lazaro, Mexico.[20]
October 30
- 0600 UTC (11:00 p.m. PDT October 29) – Tropical Depression Seventeen-E develops from an area of low pressure about 700 mi (1,100 km) south-southwest of the southern tip of Baja California.[21]
- 1200 UTC (5:00 a.m. PDT) – Tropical Depression Seventeen-E intensifies into Tropical Storm Rosa.[21]
October 31
- 0600 UTC (11:00 p.m. PDT October 30) – Tropical Storm Rosa attains its peak intensity with maximum sustained winds of 50 mph (80 km/h) and a minimum barometric pressure of 1001 mb (hPa; 29.56 inHg).[21]
November
November 3
- 1200 UTC (5:00 a.m. PDT) – Tropical Storm Rosa weakens to a tropical depression roughly 970 mi (1,560 km) southwest of the southern tip of Baja California.[21]
- 1800 UTC (11:00 a.m. PDT) – Tropical Depression Rosa degenerates into a non-convective remnant area of low pressure about 990 mi (1,590 km) southwest of Cabo San Lucas, Mexico.[21]
November 30
- The 2012 Pacific hurricane season officially ends.[2]
See also
- List of Pacific hurricanes
- Timeline of the 2012 Atlantic hurricane season
- Timeline of the 2012 Pacific typhoon season
Footnotes
- ^ An average season, as defined by the National Oceanic and Atmospheric Administration, has fifteen tropical storms, eight hurricanes and three major hurricanes.[1]
- ^ A major hurricane is a storm that ranks as Category 3 or higher on the Saffir–Simpson hurricane wind scale.[3]
References
- ^ "Background Information: East Pacific Hurricane Season". Climate Prediction Center. National Oceanic and Atmospheric Administration. May 23, 2013. Retrieved November 26, 2013.
- ^ a b c Christopher W. Landsea (June 2, 2011). "G: Tropical Cyclone Climatology". In Neal Dorst (ed.). Hurricane Research Division: Frequently Asked Questions. G1) When is hurricane season ?. Archived from the original on June 15, 2006. Retrieved November 26, 2013.
{{cite book}}:|work=ignored (help) - ^ Christopher W. Landsea (June 2, 2011). "A: Basic Definitions". In Neal Dorst (ed.). Hurricane Research Division: Frequently Asked Questions. A3) What is a super-typhoon? What is a major hurricane ? What is an intense hurricane ?. Archived from the original on June 15, 2006. Retrieved November 26, 2013.
{{cite book}}:|work=ignored (help) - ^ a b c d e f g h i j Eric S. Blake (October 9, 2012). Tropical Cyclone Report: Hurricane Bud (PDF). National Hurricane Center (Report). National Oceanic and Atmospheric Administration. pp. 1, 2, 4. Retrieved November 23, 2013.
- ^ July 2012 Global Catastrophe Recap (PDF). Impact Forecasting (Report). AON Benefield. 2012. Archived from the original (PDF) on October 30, 2012. Retrieved February 2, 2014.
- ^ a b c d e Daniel P. Brown (August 15, 2012). Tropical Cyclone Report: Tropical Storm Aletta (PDF). National Hurricane Center (Report). National Oceanic and Atmospheric Administration. pp. 1–4. Retrieved November 23, 2013.
- ^ a b c d e f g h i j Richard J. Pasch; David A. Zelinsky (December 20, 2012). Tropical Cyclone Report: Hurricane Carlotta (PDF). National Hurricane Center (Report). National Oceanic and Atmospheric Administration. pp. 1, 2, 4. Retrieved November 23, 2013.
- ^ a b c d e f g h i j Lixion A. Avila; Wallace Hogsett (October 17, 2012). Tropical Cyclone Report: Hurricane Daniel (PDF). National Hurricane Center (Report). National Oceanic and Atmospheric Administration. pp. 1, 3. Retrieved November 24, 2013.
- ^ a b c d e f g h i j k l m John P. Cangialosi (October 14, 2012). Tropical Cyclone Report: Hurricane Emilia (PDF). National Hurricane Center (Report). National Oceanic and Atmospheric Administration. pp. 1, 2, 4, 5. Retrieved November 24, 2013.
- ^ a b c d e f g h i John L. Beven II (December 18, 2012). Tropical Cyclone Report: Hurricane Fabio (PDF). National Hurricane Center (Report). National Oceanic and Atmospheric Administration. pp. 1, 2, 4, 5. Retrieved November 24, 2013.
- ^ a b c d e f Jessica Schauer; Robbie J. Berg (October 23, 2012). Tropical Cyclone Report: Hurricane Gilma (PDF). National Hurricane Center (Report). National Oceanic and Atmospheric Administration. pp. 1, 4. Retrieved November 23, 2013.
- ^ a b c d e Todd B. Kimberlain (November 9, 2012). Tropical Cyclone Report: Tropical Storm Hector (PDF). National Hurricane Center (Report). National Oceanic and Atmospheric Administration. pp. 1, 2, 4, 5. Retrieved November 23, 2013.
- ^ a b c d e f g Stacy R. Stewart; Monica L. Bozeman (January 15, 2013). Tropical Cyclone Report: Hurricane Ileana (PDF). National Hurricane Center (Report). National Oceanic and Atmospheric Administration. pp. 1, 2, 4. Retrieved November 23, 2013.
- ^ a b c d Daniel P. Brown (November 13, 2012). Tropical Cyclone Report: Tropical Storm John (PDF). National Hurricane Center (Report). National Oceanic and Atmospheric Administration. pp. 1, 2, 4. Retrieved November 26, 2013.
- ^ a b c d e John P. Cangialosi; Eric S. Blake; Nelsie Ramos (January 9, 2013). Tropical Cyclone Report: Tropical Storm Kristy (PDF). National Hurricane Center (Report). National Oceanic and Atmospheric Administration. pp. 1, 4. Retrieved November 26, 2013.
- ^ a b c d e f Richard J. Pasch; David A. Zelinsky (January 28, 2013). Tropical Cyclone Report: Hurricane Lane (PDF). National Hurricane Center (Report). National Oceanic and Atmospheric Administration. pp. 1, 2, 4. Retrieved November 26, 2013.
- ^ a b c d e f g h i Lixion A. Avila (January 28, 2013). Tropical Cyclone Report: Hurricane Miriam (PDF). National Hurricane Center (Report). National Oceanic and Atmospheric Administration. pp. 1, 3. Retrieved November 26, 2013.
- ^ a b c John P. Cangialosi (December 11, 2013). Tropical Cyclone Report: Tropical Storm Norman (PDF). National Hurricane Center (Report). National Oceanic and Atmospheric Administration. pp. 1, 3. Retrieved November 26, 2013.
- ^ a b c d John L. Beven II (December 18, 2012). Tropical Cyclone Report: Tropical Storm Olivia (PDF). National Hurricane Center (Report). National Oceanic and Atmospheric Administration. pp. 1, 4. Retrieved November 26, 2013.
- ^ a b c d e f g h Robbie J. Berg (January 4, 2013). Tropical Cyclone Report: Hurricane Paul (PDF). National Hurricane Center (Report). National Oceanic and Atmospheric Administration. pp. 1, 2, 5. Retrieved November 26, 2013.
- ^ a b c d e Todd B. Kimberlain (December 3, 2012). Tropical Cyclone Report: Tropical Storm Rosa (PDF). National Hurricane Center (Report). National Oceanic and Atmospheric Administration. pp. 1, 2, 4. Retrieved November 26, 2013.
External links
- The National Climatic Data Center (NCDC)'s 2012 Annual Tropical Cyclones Report
- The National Hurricane Center (NHC)'s 2012 Tropical Cyclone Advisory Archive