
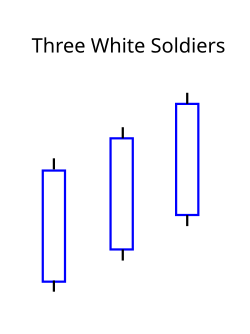
Three white soldiers is a candlestick chart pattern in the financial markets. It unfolds across three trading sessions and represents a strong price reversal from a bear market to a bull market. The pattern consists of three long candlesticks that trend upward like a staircase; each should open above the previous day's open, ideally in the middle price range of that previous day. Each candlestick should also close progressively upward to establish a new near-term high.[1]
The three white soldiers help to confirm that a bear market has ended and market sentiment has turned positive. In Candlestick Charting Explained, technical analyst Gregory L. Morris says "This type of price action is very bullish and should never be ignored."[2]
This candlestick pattern has an opposite known as the Three Black Crows, which shares the same attributes in reverse.
YouTube Encyclopedic
-
1/3Views:9 1098695 057
-
Three White Soldiers Bullish Candlestick Chart Pattern
-
Bullish Three White Soldiers Candlestick Pattern 🏯
-
How to use Three White Soldiers Candlestick Pattern in Hindi. Technical Analysis in Hindi
Transcription
See also
References
- ^ "Japanese Candlesticks". Retrieved 15 June 2010.
- ^ Morris, Gregory L.; Litchfield, Ryan (2005). Candlestick Charting Explained (3rd ed.). New York, NY: McGraw-Hill. p. 126. ISBN 0-07-146154-X.
Further reading
- Candlestick Charting Explained by Gregory L. Morris. Published by McGraw-Hill. ISBN 0-07-146154-X
- Japanese Candlestick Charting Techniques by Steve Nison. Published by New York Institute of Finance. ISBN 0-7352-0181-1