
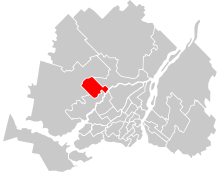
 Thérèse-De Blainville in relation to other electoral districts in Montreal and Laval | |||
| Federal electoral district | |||
| Legislature | House of Commons | ||
| MP |
Bloc Québécois | ||
| District created | 2013 | ||
| First contested | 2015 | ||
| Last contested | 2021 | ||
| District webpage | profile, map | ||
| Demographics | |||
| Population (2011)[1] | 98,499 | ||
| Electors (2015) | 78,804 | ||
| Area (km²)[1] | 77 | ||
| Pop. density (per km²) | 1,279.2 | ||
| Census division(s) | Thérèse-De Blainville | ||
| Census subdivision(s) | Blainville, Sainte-Thérèse, Bois-des-Filion, Lorraine | ||
Thérèse-De Blainville is a federal electoral district in Quebec.
Thérèse-De Blainville was created by the 2012 federal electoral boundaries redistribution and was legally defined in the 2013 representation order. It came into effect upon the call of the 42nd Canadian federal election, scheduled for 19 October 2015.[2] The riding was created from parts of Terrebonne—Blainville (51%) and Marc-Aurèle-Fortin (49%).[3]
The riding was originally intended to be named Blainville.[4]
Demographics
According to the 2021 Canadian census[5]
Ethnic groups: 87.5% White, 3.6% Black, 3.0% Arab, 1.7% Latin American, 1.3% Indigenous
Languages: 83.0% French, 4.2% English, 1.9% Arabic, 1.7% Spanish
Religions: 66.6% Christian (56.4% Catholic, 1.7% Christian Orthodox, 8.5% Other), 3.6% Muslim, 29.0% None
Median income: $46,000 (2020)
Average income: $59,500 (2020)
Members of Parliament
This riding has elected the following members of Parliament:
| Parliament | Years | Member | Party | |
|---|---|---|---|---|
| Thérèse-De Blainville Riding created from Marc-Aurèle-Fortin and Terrebonne—Blainville |
||||
| 42nd | 2015–2019 | Ramez Ayoub | Liberal | |
| 43rd | 2019–2021 | Louise Chabot | Bloc Québécois | |
| 44th | 2021–present | |||
Election results
| 2021 Canadian federal election | ||||||||
|---|---|---|---|---|---|---|---|---|
| Party | Candidate | Votes | % | ±% | Expenditures | |||
| Bloc Québécois | Louise Chabot | 21,526 | 41.2 | -0.6 | $18,256.83 | |||
| Liberal | Ramez Ayoub | 18,396 | 35.2 | -0.6 | $62,921.55 | |||
| Conservative | Marc Bissonnette | 5,773 | 11.0 | +2.0 | $3,464.83 | |||
| New Democratic | Julienne Soumaoro | 3,827 | 7.3 | -0.3 | $309.35 | |||
| People's | Vincent Aubé | 1,386 | 2.7 | +2.1 | $578.27 | |||
| Green | Simon Paré-Poupart | 1,018 | 1.9 | -2.7 | $252.95 | |||
| Free | Peggy Tassignon | 362 | 0.7 | N/A | $0.00 | |||
| Total valid votes/expense limit | 52,288 | 98.3 | – | $113,238.74 | ||||
| Total rejected ballots | 915 | 1.7 | ||||||
| Turnout | 53,203 | 63.8 | ||||||
| Registered voters | 83,459 | |||||||
| Bloc Québécois hold | Swing | ±0.0 | ||||||
| Source: Elections Canada[6] | ||||||||
| 2019 Canadian federal election | ||||||||
|---|---|---|---|---|---|---|---|---|
| Party | Candidate | Votes | % | ±% | Expenditures | |||
| Bloc Québécois | Louise Chabot | 24,486 | 41.8 | +14.71 | $10,029.76 | |||
| Liberal | Ramez Ayoub | 20,988 | 35.8 | +3.3 | $63,057.06 | |||
| Conservative | Marie Claude Fournier | 5,264 | 9.0 | -3.44 | none listed | |||
| New Democratic | Hannah Wolker | 4,431 | 7.6 | -17.33 | $198.59 | |||
| Green | Normand Beaudet | 2,710 | 4.6 | +2.2 | $0.00 | |||
| People's | Désiré Mounanga | 366 | 0.6 | $3,675.10 | ||||
| Rhinoceros | Alain Lamontagne | 289 | 0.4 | $0.00 | ||||
| Independent | Andy Piano | 89 | 0.2 | $0.00 | ||||
| Total valid votes/expense limit | 58,549 | 100.0 | ||||||
| Total rejected ballots | 933 | |||||||
| Turnout | 59,482 | 72.1 | ||||||
| Eligible voters | 82,488 | |||||||
| Bloc Québécois gain from Liberal | Swing | +5.71 | ||||||
| Source: Elections Canada[7][8] | ||||||||
| 2015 Canadian federal election | ||||||||
|---|---|---|---|---|---|---|---|---|
| Party | Candidate | Votes | % | ±% | Expenditures | |||
| Liberal | Ramez Ayoub | 18,281 | 32.50 | +22.24 | $35,214.56 | |||
| Bloc Québécois | Alain Marginean | 15,238 | 27.09 | -0.76 | $36,603.04 | |||
| New Democratic | Alain Giguère | 14,022 | 24.93 | -25.11 | $19,303.10 | |||
| Conservative | Manuel Puga | 7,000 | 12.44 | +2.69 | $9,135.41 | |||
| Green | Andrew Carkner | 1,352 | 2.40 | +0.31 | $1,781.33 | |||
| Libertarian | Daniel Guindon | 355 | 0.63 | – | $1,138.15 | |||
| Total valid votes/Expense limit | 56,248 | 100.00 | $214,228.71 | |||||
| Total rejected ballots | 1,007 | 1.76 | – | |||||
| Turnout | 57,255 | 72.16 | – | |||||
| Eligible voters | 79.347 | |||||||
| Liberal gain from New Democratic | Swing | +23.67 | ||||||
| Source: Elections Canada[9][10] | ||||||||
| 2011 federal election redistributed results[11] | |||
|---|---|---|---|
| Party | Vote | % | |
| New Democratic | 24,180 | 50.04 | |
| Bloc Québécois | 13,456 | 27.85 | |
| Liberal | 4,960 | 10.26 | |
| Conservative | 4,715 | 9.76 | |
| Green | 1,012 | 2.09 | |
References
- ^ a b Statistics Canada: 2012
- ^ Timeline for the Redistribution of Federal Electoral Districts
- ^ Final Report – Quebec
- ^ "Government Bill (House of Commons) C-37 (41-2) - Third Reading - Riding Name Change Act, 2014 - Parliament of Canada".
- ^ Government of Canada, Statistics Canada (February 9, 2022). "Profile table, Census Profile, 2021 Census of Population - Thérèse-De Blainville [Federal electoral district (2013 Representation Order)], Quebec". www12.statcan.gc.ca. Retrieved October 12, 2023.
- ^ "Confirmed candidates — Thérèse-De Blainville". Elections Canada. Retrieved September 20, 2021.
- ^ "List of confirmed candidates". Elections Canada. Retrieved October 3, 2019.
- ^ "Election Night Results". Elections Canada. Retrieved November 10, 2019.
- ^ Elections Canada – Confirmed candidates for Thérèse-De Blainville, 30 September 2015
- ^ Elections Canada – Preliminary Election Expenses Limits for Candidates
- ^ Pundits' Guide to Canadian Elections
This article about a Canadian electoral district is a stub. You can help Wikipedia by expanding it. |