

This is a list of weather records, a list of the most extreme occurrences of weather phenomena for various categories. Many weather records are measured under specific conditions—such as surface temperature and wind speed—to keep consistency among measurements around the Earth. Each of these records is understood to be the record value officially observed, as these records may have been exceeded before modern weather instrumentation was invented, or in remote areas without an official weather station. This list does not include remotely sensed observations such as satellite measurements, since those values are not considered official records.[2]
YouTube Encyclopedic
-
1/1Views:3 198
-
Folder Title List: Transferring Your Permanent Paper Records
Transcription
>> Thank you for joining us for, You Want it How? This is a records methods seminar delivered by the United States National Archives and Records Administrations National Records Management Training Program. In this session, Richard Rayburn [phonetic] discusses how to transfer permanent records to the National Archives and Records Administration. Now let's join the seminar. >> Now I think I will pass it over to Mr. Jeff Benson [phonetic] who will tell us a little bit about Mr. Richard Rayburn and then Rich will get started. >> Okay thank you, Paula. Welcome everybody. I love this introduction and hopefully this process won't seem that complicated to you, although I think you may have missed a couple steps in there but I'll let him talk about that. Our speaker today is Richard Rayburn. He's been with NARA, just hit the 20 year mark, on October 4. Those of you who are familiar with the NARA Organization, once I list some of the things that Richard has been doing at NARA, because he's covered a lot of different bases at NARA itself. During his 20 year period he was a naval records specialist, reference archivist, a move coordinator, an archives director and a records management director. Richard is based in Atlanta. He's currently a specialist with the permanent records capture team and that's why he's our presenter today. So without further ado, I'll turn it over to Richard Rayburn. >> Thank you, Jeff, and thank everybody for coming this afternoon. I'm sure, like a lot of y'all, I'm kind of suffering from post furlough stress syndrome and trying to get things back together. I was actually in the process of kind of tweaking this when we went out on furlough. We had a session scheduled right at that time. So we'll try and wade through this again and make sure we cover our bases and get everybody a little bit more happy about transferring their permanent papers to the National Archives and Records Administration and we'll try and stay on time with this presentation today. First off is why are we here? Well we're here today because permanent records are special. They're special to those of you who work in federal agencies and those of us in the National Archives. And what we really want to do is try and help give you a little better guidance on how to prepare your paper records in particular for transfer to the National Archives and into the custody and control of the National Archives. We won't touch on electronic records. That will be a later session. I know most of you will be eager to discuss that as well. But we'll work with our electronic records office in order to come up with a presentation about those. Today we'll talk about paper because some of the issues around paper now are very pressing as those of you who work in the field agencies know. Exactly how are permanent records special? Well they are special because upon transfer to the National Archives, they are retained forever, well mostly. It's true that records can be deaccessioned if we find they are not heavily used or perhaps inadequately scheduled 30 or 40 or 50 years ago and in some cases they've been transferred, they might be temporary transferred by mistake. But mostly records that come across to the custody of National Archives, are maintained forever or until filed to the public. Or I was just looking at a NASA record schedule yesterday and the schedule item actually used the infinity marking for the retention, which I thought was pretty cute. You don't see that very often. But that's basically why these records, current records, are special. They're coming across to the National Archives and we're going to maintain them until the republic falls, basically. Permanent records are special in other ways, they're special because they're stored in different conditions then records you transfer to a federal records center or perhaps even a commercial storage center. In the National Archives, once they're accessioned into the custody of the National Archives, they're stored in climate controlled conditions, special media could be stored in cold storage units down to 36 degrees and basically maintained in those conditions at a constant temperature. Treatment, if you have current records and they're transferred to the custody of the National Archives, in most instances they will be rehoused in archival containers and if needed they'll receive conservation treatment. Descriptions, records that are transferred to the National Archives will receive archival descriptions. A lot of you are familiar with ARC or what is now known as OPA and the archival descriptive catalog that the National Archives uses. The archivist within the National Archives will take your records and provide better descriptions. If needed they will update finding aids as well. Access, barring restrictions on your records and recognize your restrictions, these records will be made available to the public and the public can come in and view the records or if they're online they can have online access to them. And it's very important that access be maintained for these records. Permanent records are so special, in a lot of cases agencies really haven't transferred them to us. Everybody loves cool records, maps, photos, drawings, all kinds of neat stuff you want to retain in your offices because they're very important or they're those legal documents that your general counselors office feels that you can never, ever, ever, ever part with and they'll maintain them on site. And a lot of agencies have maintained their records. So it became a problem and has become a problem over the past, oh, 20, 30 years. And so we asked the president, President Obama, to lend us a hand and he did. The Presidential Records Narrative Directive, NARA/OMB M-12-18 was issued and Section 2.2 addresses permanent records specifically and it says by 2013 a senior agency records officer will ensure that permanent records that have been in existence more than 30 years will be identified for transfer and reporting to NARA. Now let me make it clear that you do not have to transfer your records right away. This is only a mandate that you identify the records and let us know they're there. Some agencies have already reported back to us, have gone out and looked and have sent in records identifications to our group, the Permanent Records Capture Unit, which is very much appreciated. So some agencies want to go ahead and transfer these records and that's great. We want you to transfer your records. We do want permanent records into the custody of National Archives but we also want them in good order. We don't want people to transfer their permanent records to us willy nilly. They go out to a warehouse, they discover them there, they're in a Conex trailer out in the middle of a national forest and all of a sudden you're like, oh, we need to get rid of these records. Just bear in mind that we'd like to have you get a little order and that the average retention period for permanent records is 20 years. So in most cases we're getting the records a long time after they've been in use. And for better or for worse they could be inadequately described we've indexed and there could have been a lot that happened to the records over that time. That places the burden on you as the current federal employee who handles these records but it also places the burden on us. So at the National Archives we need to work with you specifically in order to make sure the records come across to us in good order. It helps us and eventually it helps the tax payers as well. So and just to reiterate, a lot can happen in 20 years. Here's the famous Indiana Jones photo and I'll just remind everybody, that is not the National Archives. We do have a better grip on where our records are and they don't tend to disappear into a black hole. But once you want to transfer your records, there're going to be two ways that you can transfer permanent paper records to the National Archives once they've met a retention date, via a direct offer or ERA, and most of you on a phone call or Feds and you'll understand that ERA stands for Electronic Records Administration. Some of you already use it transfer records. You can do direct offers, what National Archives calls direct offers. Those are records in your custody, in the custody of your agency that are probably out in your offices that are past their retention period. You can offer those directly to us. They don't have to go to a federal record center but again they need to be in good order. Many of you maintain your records in an FRC, a Federal Records Center, and you receive transfer information from our annual move group, or annual move project, and that comes in to you via ERA. So that's the two ways you can transfer records to us basically. Now the issues with some of the transfers, particularly out of the Federal Records Center over the years, most of you are familiar with the Standard Form 135, that's when you do your initial transfer of records. Again, this might be filled out 20 years before somebody actually takes a good hard look at it in order to transfer the records into the Custody of the National Archives. So in some instances we're having problems with the standard form 135. I'll have you look down in the right hand corner of it. You'll see the last revision on this was done in 1985. That's a long time ago. There is some talk within the FRC of creating a different standard 135 for permanent records, which would require a little bit more information regarding those records and how they are transformed into the FRC's. That's only, that's something that's being discussed. It's not really in any basic shape to go forward right now. But most of you have looked at this, the 135, as for your record group, you should know your agency record group, the year you're assigned an accession number, the volume, the box number. Then line 6F in the middle says your series description, restrictions on your records, your scheduling authority and disposal dates, locations, etcetera. The filling out this form is very important to the Federal Records Center. Of course they review it but there is some information that typically gets left out and that's particularly in 6F of the records data area, series description. If you read the 135 instructions, it's actually asking you for more information. In a lot of cases we don't get that information for agency. And this is what really worries our ARC units. You get a series description, office or organization of creation is what they really want, restrictions other than national security, this could be CUI, sensitive but unclassified, FOIA, PII, having special media in there, includes the dates. But don't get too crazy about your dates. You know you just want some inclusive dates. But filling this out properly is sometimes a problem with agencies. And again you have people who may shorthand this information and this causes problems down the road, particularly for paper. So what can you do to help this? Well you need to use the 135 in order to transfer your records into an FRC. But what you can do is append a very good folder title list to that 135. That will help with the information. All of you who transfer records to the FRC probably append some type of box list as they're called, folder list. But what we're talking about here is really a folder-title list that goes down into a little bit more detail. NARA, we don't really have a specific format for this list so we kind of, our group, the permanent records capture section, kind of goof around with this and in association with the research services units in College Park, and developed just a kind of a template. Now this is in Excel so it's a little bit difficult to see on PowerPoint so we'll break it out into a couple of slides. But this is just a template that you can use as an Excel. You can shift this if you would like to. The information on it can be static. It asks you for certain information regarding your records within your agency. You could add fields to it if you need to or basically tweak the fields if you so desire. But this gives you a nice template of what we would look for. You can use this for an FRC transfer and to the Federal Records Center or even for direct offer later into the electronic records administration. And here's a little breakout of it, to give you a better sense of what's there. Top is record group, agency name, major subdivision or minor, some people like to go even further down into a tertiary level but that can get a little bit too much into overkill and most times going down two offices is good, inconclusive dates for your restrictions, CUI or you can change this to anything, PII, any types of restrictions that you like to put in there. Our units needs to know the restrictions and we'll talk about that a little bit later. Associated finding aid, do you have a database, an index, something that goes with the records? If yes, the name, type and location of the finding aid. Alternate copies of the files, do you have the records scanned or microfilmed? If yes, where are they? Where are they located? Special media, do the records contain photos, CD's, DVD's, drawings? If yes we'd need to notify the FRC in order so that they can address it or the alternate unit for guidance. Mixed media within record series can cause trouble, as most of you know, transfers later on contain that media, could need media attention. And their disposal at disposition authority, that's basically your schedule, your NARA issued schedule signed by the archivist United States. If you have an agency manual we would like the citation for that as well and hopefully it does link to a valid NARA disposition authority. Your series description, we'll talk about that, you can get that from your disposition, a brief description of the records. And then over in the corner just some general information, dates and FRC, just some basic information about the records themselves. Page 2, this would just be an amendment to this again. This is just a very simple folder title list. Most of you know how to fill out. It's not rocket science but it can be time consuming to fill one out correctly. Box number, file or case number, are you using some type of file system? Are you using some type of decimal file system on the record that we might need to know? The folder title itself, the start date and the end date. Additional information you could give us about the records that will help us 20 years later. Any comments you would like to make about the records themselves. Why is this stuff important to NARA and why is it important to you as you think about it and as you're working with records today? I work with records daily and sometimes I don't give them much thought and that's true anywhere. You're working with your records, you're working with your case files, you're filing them, you're putting them into boxes and you're not really thinking about it and what's going to happen on down the road. Again, as the catch phrase is nowadays, you just kick the can down the road and figure somebody will take care of that later on. That can be costly to all of us. One thing is a record group number, each of you should know your record group within the federal agency and the federal community. They can change. Assigned by NARA, unique number for each agency but it can change. If you are a member of the USAOC, the Administrative Office of the Courts, you'll know that record group 21, which used to cover all courts, is now broken into two. There's a record group for bankruptcy court records. But everything that was put in under RG21 now needs to change to RG578 so record groups can change. Don't think that what you write today could be the same thing so make sure if you put the number you also put the title of your agency on it there. Agency names, fairly static but agencies can be abolished or renamed. Our friends at the Federal Highway Administration used to be the Bureau of Public Roads. Those of you in the Department of Homeland Security know that a lot of your agencies were brought into that new agency when it was created and that names changed very drastically in a lot of cases there. So again be sure and spell the name out. We do have registers of group numbers but it is helpful to have it spelled out. Never assume that your name won't change, the agency name won't change. Down when you're starting to talk about offices, major agency subdivision, again, it can change and they do change frequently. I don't know how many of y'all are undergoing a transformation here at the National Archives right now so I'll use us as an example but a lot of you have probably been through agency transformations within your own agencies. Whenever possible, don't use acronyms. We use acronyms all the time in the government. ERA, AOUSC, I just said several, if you're going to write it down on a 135 that may not be seen for 20 years, be sure and spell it out. I used to be in a unit called NR, it's actually Office of Regional Records Services. Who would know what NR is 20 years later if I just wrote it down or just used the acronym NR? Minor agency subdivisions, I was in a field unit, Atlanta Archives, our acronym then was NRC. Well you might think that's Neutral Regulatory Commission 20 years later or there's a corporate unit, NRC. So you just want to be careful with acronyms and make sure you kind of spell them out and allow people to understand what you are talking about. I know that when I first came to Atlanta years ago we had a lot of NASA records here, also CDC. CDC, we kept agency charts, office organization charts, because they changed so frequently in their 16 centers. And you basically had to have a chart for year to year to see what was going on with your records and a lot of times they didn't use acronyms, or full names in those charts, they used acronyms and you physically had to look at the records in order to figure out where they came from. Anyway, NASA, which changed a lot in terms of what units are doing. Inclusive dates, these are needed for transferring description purposes, again I think people a lot of times were bogged down on the dates oh gosh, it's got to be right on the month and the year down to the day, if I know it. Give us bulk dates if you need to, particularly if you're out looking in an office, you're doing an office clean up to report to us under 2.2, the Presidential Records Directive, and you can't figure out whether it's 1870 to 1930, you know, it's fine. Just kind of get it in the ballpark. It's better to at least know kind of a decade. Restriction exemptions, again, let us know what restrictions and exemptions are there. This protects the interests of your agency and alerts NARA staff to issues in the records. There's nothing like 20 years later going out to a shelf and discovering national classification restrictions on record, seeing top secret in a box or secret, confidential, this always makes the records archivists hair stand on end because you can get in a difficult situation and eventually you have to come back to your agency and figure out what's going on so it causes everybody difficulty. So in your transfers always let us know what restriction and what exemptions you have for the records. Controlled classified information and also things such as PII or sensitive or unclassified, these are types of regulations and restrictions that are placed on records a lot of times by your agency or by Congressional restrictions or legal restrictions on the records. If there are long term restrictions, please let us know about them. We need to know what the information is on say CUI, NASA's famous CUI instances ITAR, International Trade agreement restrictions. DOE has a thing called UNI, Uncontrolled Nuclear Information, we just need to know what these are. NARA maintains a registry but we are not basically the people who would weigh in on how these things are applied to your records. If you have issues or want to know what's going on, contact your records officer or your general counsel's office or if you have an access coordinator for your records and your agency, contact them as well. In the National Archives we have an access coordinator, whom I actually talked to about this presentation, who helps us figure out what restrictions are placed on records. But if there are longstanding restrictions, grand jury, we've seen grand jury records come in, those are closed in perpetuity. We don't really want grand jury records. There's nothing we can do with grand jury records. We need to know about that so that somebody is not surprised 20 years later or risks fines, fees or actually jail time for allowing people to see these records. Again, the what NARA really pushes for is open access to records but we will abide by the restrictions that your agency places on the records within the limits of the exemptions. Associated finding aids, have you created databases and indexes to gain access to your records? If so we'd like to have them. There can be problems with finding aids. I'll show you an example of that later. But if you create a database that gets you into the records and gets you into the records quickly, that is what we would like to have. In some instances they can be a homegrown programming type activity that may not transfer to the National Archives so we would like to look at them just to see if they'll work with the programming capabilities that we have within the National Archives. Alternate copies, have you scanned and microfilmed your records? If so they could be designated the record copy. We might need to schedule the new records but if you can transfer electronic or scans to us, that's welcomed as well. Again, NARA is tight on space for paper records so we do like to take in electronic records or special media if we can. Special media is always an issue. We need to talk about the volume and type whenever you transfer records in. Make sure you designate special media carefully on your 135 and your Excel spreadsheets if you fill them out, so that we can talk about those over time. Again, the worst thing that can happen is you transfer delicate special media into a Federal Record Center and it sits there for 25 years in difficult conditions and deteriorates. By the time the archival unit sees it, it could be just a mass of melted plastic. So please designate your special media. Phew, yeah, phew is right, disposition authority, everybody should be well acquainted with their schedules and the schedules, as you all know, change over time. Our team, permanent records capture section, is actually compiling all permanent authorities that have been created by federal agencies since 1974. Right now we're up to about 10,000. We estimate anywhere between 20,000 and 30,000 permanent authorities have been created by permanent federal agencies over the years. In the old days you would get a schedule that's like this NOAA schedule here. This is actually a brand new one written by a colleague of mine out in Chicago. This is the approved schedule and it also cross references to a manual item number, 1406-5.1 and make sure you spell that out clearly for us. This is very important to the reference archivist years later. ERA now is loading, and this is part of our project within the current records capture section, is we will load the legacy schedule permanent items into ERA. That way people can see them. But right now it's very important to just kind of get them in. This live schedule would be on ERA. That gives you the ability to go in and read a description like this. That also gives our archivists 20 years from now the ability to also read this. Item 1, that's your description, that's your record series description that you can basically cut and paste and put in your 135 or your Excel spreadsheet. Also my colleague, Steiger, [phonetic] wrote a traditional archival type description for these records that you can also cut and paste. An archivist years later could use this as a description for the records for the surface weather observations. Nowadays you have big bucket schedules that would move away from this scheduled item type structure but the big buckets for permanent record should still give you some type of information about the series that's being transferred that's a little more in depth, some of them do not, if they do not, consult with your records officer and your program unit in order to try and come up with a better description. This is particularly crucial for paper and electronic that's been around for years and years. Nobody is going to be able to go back and recreate, without a lot of hassle, what was in the records 20 years ago. So trying to get these series descriptions, particularly for permanent, is important and it's important to the archival units our archival units going forward and also your own people. If you need call back records for FOIA or you need to have a look at records in terms of organizational events over time, it will be easier to get at the records in order to access the permanent ones. Disposition, paper manuscript records not scanned, permanent, so this also, the schedule also gives your disposition, on these records, for the weather records observation, 75 years so that would be a long time away for somebody to go out, these records would sit on a shelf for 75 years and then somebody is going to have to go out and figure out whether they're eligible for transfer to the National Archives. And truthfully a lot can happen in 75 years. It may be that somebody goes and looks at them and says hey, we need to reschedule these. We don't think they're permanent. That can also happen if you go out. A lot of you looking at your records now. Under 2.2 may be determining that we need to have another look at these records and we're not opposed to that either. Now I'll just give you some examples of folder title lists that we got in. These are just over the past year or so and show you what can come in from an agency, what can happen and then I'll show you some that we've kind of fixed. Here's a folder title. This we got during FY13 from a court. If you opened that 135 or looked at that attachment in ARCIS 20 years later, is this going to be very helpful to an archivist or even somebody in your agency trying to review these records to see if they are indeed permanent and if they are eligible for transfer? I look at this and I'm thinking nope. This is not very helpful. I do know, having dealt with court records for a long time, this is a civil case. It was created in 1998. It's number 8,031 and it's probably nine folders of information plus seven folders of exhibits but beyond that I really don't know anything. Number nine is probably the division within the court district but I don't really know anything beyond that. So information that comes to us like this is just not very helpful at all and it will force somebody to go out and look at that. Now if we had a docket for this we might be able to match the court docket information to this but again we're talking an extensive search in order to figure that out so again it's just not very helpful and it's time consuming and costs money. Here's a transfer we got form the Corp of Engineers and here's one that's actually filled out for you and this person did a pretty good job filling it out, RG77, this is transfer number 282. This tells me its real property historical files. Okay it gives me some inclusive dates. Restrictive use by agency personnel only. That's good for one that's in the federal records center. I went out and looked up his disposal authority using [inaudible] and I could look up A40590H1 and it was indeed permanent. So I was like well wait, we've got some information here. It doesn't really have a series description for me but I can go to [inaudible] and kind of download that series description and see what I need to see. So I can do a little work and figure this out. He's given me some inclusive dates. They're not too bad. I see it's World War II records which could be of some interest. So now I go to the folder title list that was submitted and suddenly I'm confused because we're talking about Rockford Ordinance Plant's Illinois Audit Files and my thinking is that these are maybe contract audit files. I'm not quite sure. Are they permanent? Should they be permanent? Do I need to go out and look at these things? In and of itself the folder title list isn't so bad. It doesn't give me a lot of information but it gives me enough to kind of get a researcher where they want to go 20 years later. But the one thing that I question immediately is again, audit files, I'm not quite sure what they mean. Typically contract audit files are temporary. So I went out and I grabbed these records and I thought well I'll use these as an example for the class and I filled out the 135 that we had created and I sent you as a sample. This is RG77. It's Corp of Engineers. I discovered that is was Great Lakes in Ohio River Division and that's within the Louisville district. The dates were 40 to 77. It didn't have any exemptions on it. It didn't have any restricted information or CUI in it and it did not have a finding aid or database. I guess I could say that the original 135 is a finding aid but not so great a finding aid. And then are there alternate? Well yes. When I opened up the file it said that these records had been scanned. And I was like oh, hurray. But it didn't tell me where they were and it gives me an acronym that I have no clue. I can tell it's Corp of Engineer, Louisville something PMME. There's no way I'm going to be able to figure that out unless I call Louisville and track somebody down there who can tell me what that is and whether I could get a copy of the scans. So that's the kind of thing that's a danger of acronyms that you run into years later. It didn't really have any special media of aggregation, special media that I was really worried about. And then I put the transfer information. It had an ARCIS transfer number. It's not a direct dial. And then the number of boxes and the types of box. Then also I just took, I basically cut and pasted this information from AR and just dropped it into my spreadsheet, my Excel spreadsheet, and that took me, it was a lot harder to get into [inaudible] and find this than it was to cut and paste it but I did find it. And it gave me enough information that I went to the original NARA schedule and matched that up to make sure that the manual citation matched the schedule. Sounds like a lot of work but it probably took me 10 minutes. The folder title list itself, I have worked with Corp Engineer records and real property records before so I know in some instances what researchers are looking for. Most of these records are valuable for [inaudible] or formally utilized sites. A lot of times the Corp of Engineers is going in to clean up these sites or they're environmental issues so people want to know a lot more about these files then just is it Mayo General Hospital or George Field Radio Range Station. And so I just did a few, I did a whole box. It took me about an hour to do the whole box. And again I know what I'm looking for so it was a little faster for me but your folks could do it, if you're talking permanent records and saving everybody time, could probably do it fairly quickly as well. Most the time people want to know what state, what county, what city? What they're trying to get at is where are these facilities? Are there drawings, are there photos, are there anything in there that help me do a site cleanup years later? And what period was this facility occupied? As you can see here, one down about four is a tank arsenal so somebody probably interested in that, also the ordinance facility. So those are the types of things you're looking for in a file folder list. If it's permanent records, take your time and expend a little time on it. Again, I also realize that you're going to have to look at these, you know, 20 years later or 25 or 30 or 35 so you want to give people enough information that I can open this right up and say to myself, yes, these are very important records or I know that they're used by federal agencies and researchers quite a bit. Here's another one that came in. This has a declass number on it so I know that these records were declassified in 1986. I'm very happy about that. As I process the records I will use that declassification number in order to put it on my boxes so that somebody who comes from our office to review the records years later can see that there was a declass job that was done on these records. These were declassified by the National Archives. These are confidential correspondence. And this is under the old famous Navy filing manual, A2 Administrative Records. This is what they used to give to a researcher once these were declassified. As you can see it's very vague so we took it and broke it out. And here as an archival unit took this and created this finding aid to help people get into these records more readily. Again, you'll see they took it out, in the old days we'd hand somebody a file manual and say here's A162, that's what it says. This unit just took it and probably cut and pasted it and then hit control apostrophe and just copied it all the way down, A162. They gave you the subject of what's in the file plus a month and a year. This opened up these records to research quite a bit so that now people are interested in them. You can post this on the internet, online and everybody gets to have a look at it and that drives people to the records, makes us happy and makes people happy that they've gotten access to the records. In the old format, that very difficult to get people to the record or get them interested in the records. Now here's a database that was created for railroad retirement board records. This was created by the agency for use in retrieving records. You can see a claim file. No location numbers. As you can see, this is a working finding aid. This is what an agency created. All they kind of wanted to know was a last name and a first name, date of birth and they don't, in a lot of case they don't even put a consistent date of death in there and all they want to know is a claim file. This is fine. We had long discussions with the railroad retirement board about new use of social security numbers and I'll show you the next slide that will have them unveiled. But as it is this is okay. But in an archival unit we may take it in and tweak this a little bit. As you can see there are two Moore's. Using an initial is not great. It's okay but what if you had 14 Smiths there? That could be a problem. And again, we would want to be a little more fine on the dates of birth and the dates of death. This is why we had the long discussions. So there are the social security numbers. Now in the National Archives we basically would release these numbers because these folks are dead. And this is why we had all these discussions with the railroad retirement board. These are people all deceased within this database. And NARA still holds by the basic tenant that the dead have no rights to privacy. Now we don't get crazy about that. There are certain things that even on these we would review the files for medical information sent to the medical information but typically we would release this database with social security numbers unrevealed. Even here if I put it out on YouTube we would probably cloak the social security numbers because our access staff doesn't want 500 phone calls from concerned citizens that the National Archives is suddenly releasing social security numbers so again, we've had long conversations over this type of information. But it's a good database as it stands. It's a work database for an agency to do its work. If I was talking to the agency when they were creating this, I would have said well, can you be a little better about the information you're collecting? So that's as a records officer or person who's doing program units on a daily basis, those are the types of conversations you want to have if you go out and look at electronic media, files creation, even data dumps on files, remind your offices that somebody has to look at these one day and it's not helpful to use name, April and a file name, a file folder named April on the same shared drive. It causes confusion for everybody. Okay so we're heading into the home stretch and you've created a great folder title list and I have confidence that anybody can create a great folder title list. Heck, if I can, anybody can do it. And after years of experience I have made every mistake you can possibly make trying to create a folder title list. The wonderful thing about Excel and most of the spreadsheets that we use nowadays is that you can go back and correct them fairly easily, even the 135 that I use as an example, every time I look at it, I change it so it's a little bit crazy but luckily electronic media, even though it can be a hassle at times, it is very forgiving. You're not rolling a sheet of paper back in the typewriter to fix something. So you can create a great folder title list and then transfer your current records to the National Archive. Now how hard is that? Well it's not that hard. If you choose to store your records in a Federal Records Center you can attach your spreadsheet to that 135, you can mail it, email it, fax it or wherever to the appropriate Federal Records Center in your area or the one you use. We're a little more carefree about where records are stored these days. But you can literally fill out that electronic Excel spreadsheet and just attach it to that 135. You still need to use the 135. We're not going to eliminate that. But it can be there and you can review it in ARCIS as well. It can be viewed in ARCIS which is a great feature which I hope gets better and better. If you're transferring legal custody of your records to NARA, use ERA, Electronic Records Administration. You can attach a spreadsheet to your ERA transfer or PR, everybody is using PR now. And if you need guidance about transferring records, I won't give you an ERA session here. Lord knows I could probably use another one. But you can go to archives.gov/records-mgmt/accessioning/. There is a manual, an agency manual there that once I got used to it, it's actually pretty good. So it can show you how to attach things in ERA. You can attach these spreadsheets in ERA. It's got a little twist that can be kind of tricky. Here's kind of a blurry attachment page. You'll see on the attachment that is highlighted in blue. The only issue with attaching something in ERA in Excel Spreadsheet, here you'll see I did a premium national forest, Excel spreadsheet for the forest service in order to do a direct offer for them, is that it does not give you a message that your file has been uploaded. So I ended up attaching that I think six different times before I finally figured out I had to go back out and come back in. So just be aware that it is attaching your file, it's just not giving you the file uploaded message that you want to see. But it's there. I went and clicked on it before the furlough and by golly it still opened up and I was pleased as punch. A note about classified records, if you're going to transfer classified records or if you deal with classified records that need to be transferred, don't transfer classified records by ERA. Do it the old way on what's called the old SF-258, which is still around for these types of things. You have to fill out a form NA 14130 prior to transferring permanent classified records to NARA. And you can talk to them about this, the supervisor in that unit. His name is Don Mackelwon. [phonetic] He loves to talk about classified records and transferring them in and you can use this address to get to their website and they will assist you on this process and also in filling out this form. Here it is, the checklist form 14130. And they can give you information about this. In order to fill this out you're going to need to work with your records officer and the program office in a lot of cases. So this is the checklist form. Some of you probably already used it. And just remember, you're making history. Your agency is making history. But the legacy of your work is the permanent records that you transfer into the national archives. We maintain those records. We take care of the records. And even if we get them in a bad state, we will attempt to get the public into those records as best we can. But it's very important to think ahead when you're working with current records in your agency on a day to day basis. If you're going to retire records to the Federal Records Center or you're coming across records that are past their retention within your agency, the question you want to ask yourself is how can I get these records to the public and the National Archives so that they can review the records 20, 25, 100 years from now without great expense to the tax payer or causing an archivist to basically rework the records all the way through? To create one of those file folder lists like that Navy one I showed you a few slides ago basically takes about 13 hours per cubic foot, if you're doing a very intense description and trying to correct the records as you go along, reboxing, refoldering, doing archival descriptions, doing the finding aid. That costs taxpayers a lot of money. So any upfront work that's done on the records is very helpful on down the road. So now if you need help or advice or you know questions you can contact us at the permanent records capture section or reference unit or research unit in College Park also have an online presence. There's a tab on our records site for transferring permanent records, accessioning records so you can go there as well. Or you can contact our supervisor, Matt Eidson and he will help you as well and get you to where you need to go. But just remember try and do the best with your records. If they're in different formats, let us know and we'd love to have the permanent records in the National Archives. And that is the end. >> Okay Casey says once the records are at NARA, how do we request retrieval of the record later? Once you transfer your records to the legal custody in National Archives, basically we're loathed to send them back to the agency unless you have some very solid reason as to why you need them. We do loans back to agencies but it's on a very limited basis. We do find that people have trouble turning over their current records to us and once we lend them back to us, they have even more trouble sending them back so a lot of times you want to be able to access your records while they're in the Federal Records Center. They're still in your custody. Microfiche that's very, very old, is it so old that you couldn't have it converted to some type of electronic scan, if your microfiche is very brittle and there's something you know that's really wrong with it, you may be able to find a little bit of money to transfer it. I know they can put it, I think it can be scanned now so you might want to check on that. If you're going to maintain it locally, make sure you get it in some type of colored storage unit. As long as they're readable and you can slap it on a microfiche reader, they should be okay. But I'd have to know what kind of state they're in before I could really answer you completely. >> Thank you so much for joining us. Thank you to Rich. Thank you to the Permanent Records Capture team. Thank you to Jeff and the rest of the training team who help put this on. And thank you so much to all of you. We look forward to seeing you online in the future and hope that you found this presentation to be helpful. >> Thank you all. >> Thank you for joining us. We hope you found this seminar useful. For more information about the U.S. National Records Management Training Program, please visit www.archives.gov. Also our current workshop schedule for both face to face and web based training is available online at NARA.learn.com.
Temperature
![Increasingly, record temperatures have been warm record temperatures.[3]](http://upload.wikimedia.org/wikipedia/commons/thumb/3/38/1951-_Percent_of_record_temperatures_that_are_cold_or_warm_records.svg/208px-1951-_Percent_of_record_temperatures_that_are_cold_or_warm_records.svg.png)
![Increasingly, record temperatures have been warm record temperatures.[3]](/wikipedia/commons/thumb/e/e4/1940-2023_Global_surface_temperature_-_stacked_-_Copernicus.jpg/226px-1940-2023_Global_surface_temperature_-_stacked_-_Copernicus.jpg)
Measuring conditions
The standard measuring conditions for temperature are in the air, 1.25 metres (4.1 ft) to 2.00 metres (6.6 ft) above the ground,[5] and shielded from direct sunlight intensity (hence the term x degrees "in the shade").[6] The following lists include all officially confirmed claims measured by those methods.
Temperatures measured directly on the ground may exceed air temperatures by 30 to 50 °C (54 to 90 °F).[6] The highest natural ground surface temperature ever recorded may have been an alleged reading of 93.9 °C (201.0 °F) at Furnace Creek, California, United States, on 15 July 1972.[7] In 2011, a ground temperature of 84 °C (183.2 °F) was recorded in Port Sudan, Sudan.[8] The theoretical maximum possible ground surface temperature has been estimated to be between 90 and 100 °C (194 and 212 °F) for dry, darkish soils of low thermal conductivity.[9]
Satellite measurements of ground temperature taken between 2003 and 2009, taken with the MODIS infrared spectroradiometer on the Aqua satellite, found a maximum temperature of 70.7 °C (159.3 °F), which was recorded in 2005 in the Lut Desert, Iran. The Lut Desert was also found to have the highest maximum temperature in five of the seven years measured (2004, 2005, 2006, 2007 and 2009). These measurements reflect averages over a large region and so are lower than the maximum point surface temperature.[6]
Satellite measurements of the surface temperature of Antarctica, taken between 1982 and 2013, found a coldest temperature of −93.2 °C (−135.8 °F) on 10 August 2010, at 81°48′S 59°18′E / 81.8°S 59.3°E. Although this is not comparable to an air temperature, it is believed that the air temperature at this location would have been lower than the official record lowest air temperature of −89.2 °C (−128.6 °F).[10][11]
Hottest
Highest temperatures ever recorded

According to the World Meteorological Organization (WMO), the highest temperature ever recorded was 56.7 °C (134.1 °F) on 10 July 1913 in Furnace Creek (Greenland Ranch), California, United States,[12] but the validity of this record is challenged as possible problems with the reading have since been discovered. Christopher C. Burt, a weather historian writing for Weather Underground, believes that the 1913 Death Valley reading is "a myth", and is at least 2.2 or 2.8 °C (4 or 5 °F) too high.[13] Burt proposes that the highest reliably recorded temperature on Earth could still be at Death Valley, but is instead 54.0 °C (129.2 °F) recorded on 30 June 2013.[14] This is lower than a 1931 record of 55 °C (131 °F) recorded in Kebili, Tunisia[15] and is matched by a 1942 record of 54 °C (129 °F) from Tirat Zvi, Israel.[16] 2016 and 2017 readings in Kuwait and Iran have also matched the 2013 Death Valley record, while readings in 2020 and 2021 also at Furnace Creek went even higher, up to 54.4 °C (129.9 °F), however, they have not yet been validated by WMO.[17] The WMO has stated they stand by the 1913 record pending any future investigations.
The former highest official temperature on Earth, 57.8 °C (136.0 °F), measured in ʽAziziya, Libya on 13 September 1922, was reassessed in July 2012 by the WMO which published a report that invalidated the record.[15] There have been other unconfirmed reports of high temperatures, but these temperatures have never been officially validated by national weather services/WMO, and are currently considered to have been recorder's errors,[18] thus not being recognised as world records.[19]
Highest global average temperature
The warmest day on record for the entire planet was 6 July 2023, when the highest global average temperature was recorded at 17.08 °C (62.74 °F).[20] The month of July 2023 was the hottest month on record globally.[21] September 2023 was the most anomalously warm month, averaging 1.8 degrees Celsius above the preindustrial average.
Table
| Country/Region | Temperature | Town/Location | Date |
|---|---|---|---|
| 51.3 °C (124.3 °F) | Ouargla, Ouargla Province | 5 July 2018[22] | |
| 44.0 °C (111.2 °F) | Maun | 7 January 2016[23][24] | |
| 47.2 °C (117.0 °F) | Dori | 1984[25] | |
| 48.0 °C (118.4 °F) | Faya-Largeau | 25 May 2023[26] | |
| 36.0 °C (96.8 °F) | Hahaya International Airport | 15 November 2017[27] | |
| 51.0 °C (123.8 °F) | Aswan | 4 July 1918[28][better source needed] | |
| 47.4 °C (117.3 °F) | Lavumisa | ?[29] | |
| 49.0 °C (120.2 °F) | Jenoi | 2001[30] | |
| 43.8 °C (110.8 °F) | Navrongo | 26 March 2017[27] | |
| 45.0 °C (113.0 °F) | Koundara, Boké Region | 29 March 2017[27] | |
| 40.1 °C (104.2 °F) | Ebini | 26 September 2023[31] | |
| 43.6 °C (110.5 °F) | Ejeda, Atsimo-Andrefana | ?[32] | |
| 50.4 °C (122.7 °F) | Agadir (Inezgane Airport) | 11 August 2023[33] | |
| 49.5 °C (121.1 °F) | Diffa | 7 September 1978[34] | |
| 46.4 °C (115.5 °F) | Yola | 3 April 2010[citation needed] | |
| 36.9 °C (98.4 °F) | Le Port | 6 March 2004[35] | |
| 50.0 °C (122.0 °F) | Dunbrody, Eastern Cape | 3 November 1918[36][note 1] | |
| 49.7 °C (121.5 °F) | Dongola | 25 June 2010[26] | |
| 55 °C (131 °F) | Kebili | 7 July 1931[38][note 2] | |
| 50.7 °C (123.3 °F) | Semara | 13 July 1961[39] | |
| 42.4 °C (108.3 °F) | Mfuwe, Eastern Province | 13 October 2010[26] | |
| 19.8 °C (67.6 °F) | Signy Research Station, Signy Island | 30 January 1982[40] | |
| 37.0 °C (98.6 °F) | Sukhumi | ? | |
| 49.9 °C (121.8 °F) | Farah | August 2009[41] | |
| 45.1 °C (113.2 °F) | Rajshahi | 30 May 1972[42] | |
| 40.0 °C (104.0 °F) | Phuentsholing | 27 August 1997[43] | |
| 42.6 °C (108.7 °F) | Preah Vihear | 15 April 2016[44] | |
| 52.2 °C (126.0 °F) | Sanbao Township, Turpan, Xinjiang | 16 July 2023[45] | |
| 41.5 °C (106.7 °F) | Sheung Shui | 31 May 2023[46] | |
| 51.0 °C (123.8 °F) | Phalodi, Rajasthan | 19 May 2016[47] | |
| 40.6 °C (105.1 °F) | Banjarbaru, South Kalimantan | 16 August 1997[48][49] | |
| 54.0 °C (129.2 °F) | Ahvaz Airport (OIAW) | 29 June 2017 [50] | |
| 53.9 °C (129.0 °F) | Basra | 22 July 2016[51][52] | |
| 54.0 °C (129.2 °F) | Tirat Zvi | 21 June 1942[16][note 3] | |
| 41.1 °C (106.0 °F) | Kumagaya, Saitama Hamamatsu, Shizuoka |
23 July 2018[54][55] 17 August 2020[55] | |
| 50.0 °C (122.0 °F) | Jordan University Agriculture Research Center | 6 September 2002[56] | |
| 49.1 °C (120.4 °F) | Turkistan | ?[57] | |
| 53.9 °C (129.0 °F) | Mitribah | 21 July 2016[58][note 4] | |
| 43.6 °C (110.5 °F) | Jangy-Jer | July 1944[59] | |
| 43.5 °C (110.3 °F) | Luang Prabang | 6 May 2023[60] | |
|
44.3 °C (111.7 °F) |
Houche Al Oumara | September 2020[61] | |
| 39.0 °C (102.2 °F) | Coloane | 22 August 2017[27] | |
| 40.1 °C (104.2 °F) | Chuping | 9 April 1998[62] | |
| 34.9 °C (94.8 °F) | Hanimaadhoo | 16 April 2016[44] | |
| 44.0 °C (111.2 °F) | Khongor, Darkhan-Uul Province | 24 July 1999[63] | |
| 47.2 °C (117.0 °F) | Myinmu | 14 May 2010[64][65] | |
| 46.4 °C (115.5 °F) | Ataria | 16 June 1995[66] | |
| 51.6 °C (124.9 °F) | Joba | 16 June 2021[67] | |
| 53.7 °C (128.7 °F) | Mohenjo-daro Turbat |
26 May 2010[68] 28 May 2017[58] | |
| 42.2 °C (108.0 °F) | Tuguegarao, Cagayan Valley | 12 April 1912 11 May 1969[69] | |
| 50.4 °C (122.7 °F) | Doha | 14 July 2010[26] | |
| 52.0 °C (125.6 °F) | Jeddah | 22 June 2010[70][26] | |
| 37.0 °C (98.6 °F) | Tengah Ang Mo Kio |
17 April 1983[71] 13 May 2023[72] | |
| 41.0 °C (105.8 °F) | Hongcheon, Gangwon Province | 1 August 2018[73] | |
| 39.8 °C (103.6 °F) | Trincomalee | 13 May 1890 [74] 11 April 2019[75] | |
| 49.4 °C (120.9 °F) | Al-Hasakah | 30 July 2000 [76][77] | |
| 41.6 °C (106.9 °F) | Fuyuan | 21 August 2022[78] | |
| 48.0 °C (118.4 °F) | Panji Poyon | ?[79] | |
| 45.4 °C (113.7 °F) | Tak | 15 April 2023[80] | |
| 49.5 °C (121.1 °F) | Sarıcakaya, Eskişehir Province | 15 August 2023[81] | |
| 50.1 °C (122.2 °F) | Repetek Biosphere State Reserve, Karakum Desert | 28 July 1983[82][83] | |
| 52.1 °C (125.8 °F) | Al Jazeera Border Gate | July 2002[84][85] | |
| 44.2 °C (111.6 °F) | Tương Dương District, Nghệ An Province |
7 May 2023[86] | |
| 34.0 °C (93.2 °F) | RAF Akrotiri, Dhekelia |
?[87][88] | |
| 44.0 °C (111.2 °F) | Kuçovë | 25 July 2023[89] | |
| 39.4 °C (102.9 °F) | Borda Vidal | 28 June 2019[90] | |
| 43.7 °C (110.7 °F) | Meghri Yerevan |
1 August 2011[91][92] 12 July 2018[93] | |
| 40.5 °C (104.9 °F) | Bad Deutsch-Altenburg | 8 August 2013[94] | |
| 46.0 °C (114.8 °F) | Julfa and Ordubad | 1 July 2018 | |
| 38.9 °C (102.0 °F) | Gomel | 7 August 2010[26] | |
| 41.8 °C (107.2 °F) | Begijnendijk, Flemish Brabant[note 5] | 25 July 2019[95] | |
| 46.2 °C (115.2 °F) | Mostar | 31 July 1901[96][97] | |
| 45.2 °C (113.4 °F) | Sadovo, Plovdiv Province | 5 August 1916[98] | |
| 42.8 °C (109.0 °F) | Ploče | 5 August 1981[99] | |
| 46.2 °C (115.2 °F) | Nicosia, Visitor Center Athalassa | 4 September 2020[100] | |
| 40.4 °C (104.7 °F) | Dobřichovice, Prague-West District | 20 August 2012[101] | |
| 36.4 °C (97.5 °F) | Holstebro, Midtjylland | 10 August 1975[102] | |
| 35.6 °C (96.1 °F) | Võru | 11 August 1992[103] | |
| 37.2 °C (99.0 °F) | Joensuu Airport, Liperi | 29 July 2010[104][26] | |
| 46.0 °C (114.8 °F) | Vérargues, Hérault | 28 June 2019[97] | |
| 41.2 °C (106.2 °F) | Duisburg-Baerl, North Rhine-Westphalia and Tönisvorst, North Rhine-Westphalia[note 5] | 25 July 2019[105] | |
| 48.0 °C (118.4 °F) | Elefsina, Attica | 10 July 1977[106] | |
| 41.9 °C (107.4 °F) | Kiskunhalas | 20 July 2007[107] | |
| 30.5 °C (86.9 °F) | Teigarhorn, Djúpivogur | 22 June 1939[108][109] | |
| 33.3 °C (91.9 °F) | Kilkenny Castle, County Kilkenny | 26 June 1887[110] | |
| 48.8 °C (119.8 °F) | Floridia, Sicily | 11 August 2021[111] | |
| 37.8 °C (100.0 °F) | Ventspils | 4 August 2014[112][113] | |
| 37.4 °C (99.3 °F) | Ruggell | 13 August 2003[114][115] | |
| 37.5 °C (99.5 °F) | Zarasai, Utena County | 30 July 1994[116] | |
| 40.8 °C (105.4 °F) | Steinsel, Luxembourg and Remich, Remich[note 5] | 25 July 2019[117][118] | |
| 43.8 °C (110.8 °F) | Malta International Airport | 9 August 1999[119][120] | |
| 42.4 °C (108.3 °F) | Fălești | 7 August 2012[121] | |
| 35.1 °C (95.2 °F) | Monaco | 20 July 2022[122] | |
| 44.8 °C (112.6 °F) | Podgorica Danilovgrad |
16 August 2007 8 August 2012[123] | |
| 40.7 °C (105.3 °F) | Gilze en Rijen, North Brabant[note 5][note 6] | 25 July 2019[125] | |
| 45.7 °C (114.3 °F) | Demir Kapija, Demir Kapija | 24 July 2007[126] | |
| 35.6 °C (96.1 °F) | Nesbyen, Buskerud | 20 June 1970[127] | |
| 40.2 °C (104.4 °F) | Prószków[note 7] | 29 July 1921[129] | |
| 47.4 °C (117.3 °F) | Amareleja, Beja | 1 August 2003[130] | |
| 44.5 °C (112.1 °F) | Ion Sion, Brăila County | 10 August 1951[131] | |
| 45.4 °C (113.7 °F) | Utta, Kalmykia | 12 July 2010[132] | |
| 40.3 °C (104.5 °F) | Serravalle | 3 August 2017 9 August 2017[27] | |
| 44.9 °C (112.8 °F) | Smederevska Palanka, Podunavlje | 24 July 2007[133] | |
| 40.3 °C (104.5 °F) | Hurbanovo | 20 July 2007[134] | |
| 40.8 °C (105.4 °F) | Cerklje ob Krki | 8 August 2013[135] | |
| 47.6 °C (117.7 °F) | La Rambla, Cordoba (as La Rambla Privilegio) | 14 August 2021[136] | |
| 38.0 °C (100.4 °F) | Ultuna, Uppsala County Målilla, Kalmar County |
9 July 1933 29 June 1947[137] | |
| 41.5 °C (106.7 °F) | Grono, Moesa District | 11 August 2003[138] | |
| 42.0 °C (107.6 °F) | Luhansk | 12 August 2010[139][26] | |
| 40.3 °C (104.5 °F) | Coningsby, Lincolnshire | 19 July 2022[140] | |
| 40.8 °C (105.4 °F) | Vatican City | 28 June 2022[141] | |
| 34.2 °C (93.6 °F) | The Valley | 12 September 2015[142] | |
| 34.9 °C (94.8 °F) | V. C. Bird International Airport, St. John's | 12 August 1995[143][144] | |
| 35.0 °C (95.0 °F) | Terrance B. Lettsome International Airport | 22 July 2016[145] | |
| 49.6 °C (121.3 °F) | Lytton, British Columbia | 29 June 2021[146][147][148][149][150] | |
| 34.9 °C (94.8 °F) | Owen Roberts International Airport, Grand Cayman | 21 August 2016[145] | |
| 39.7 °C (103.5 °F) | Veguitas (Granma Province) | 12 April 2020[151] | |
| 43.0 °C (109.4 °F) | Mao | 31 August 1954[152] | |
| 30.1 °C (86.2 °F) | Ivittuut | 23 June 1915[153][154][155] | |
| 45.0 °C (113.0 °F) | Estanzuela, Zacapa | 12 May 1998[156][157] | |
| 36.5 °C (97.7 °F) | Saint-Pierre | 6 October 2010[158] | |
| 52.0 °C (125.6 °F) | Mexicali area | 28 July 1995[159][160] | |
| 40.0 °C (104.0 °F) | San Francisco | 20 March 1998[161] | |
| 40.0 °C (104.0 °F) | Mona Island | 2 July 1996[162] | |
| 56.7 °C (134.0 °F) | Furnace Creek, Death Valley, California | 10 July 1913[13][163][14] | |
| 37.2 °C (99 °F) | Saint Thomas Cruz Bay |
4 August 1994 and 23 June 1996[162] 31 July 1988[162] | |
| 50.7 °C (123.3 °F) | Oodnadatta, South Australia Onslow, Western Australia |
2 January 1962[164][165][166] 12 January 2022[167][168][169] | |
| 35.6 °C (96.1 °F) | Utirik Atoll | 24 August 2016[145] | |
| 37.2 °C (99.0 °F) | Yaren District | ?[citation needed] | |
| 42.4 °C (108.3 °F) | Rangiora, Canterbury | 7 February 1973[170] | |
| 35.0 °C (95.0 °F) | Koror | 22 March 2018[171] | |
| 35.3 °C (95.5 °F) | Asau | 24 December 1968[172] | |
| 36.1 °C (97.0 °F) | Honiara, Guadalcanal Province | 1 February 2010[26] | |
| 35.5 °C (95.9 °F) | Niuafoou | 1 February 2016[145] | |
| 36.2 °C (97.2 °F) | Lamap Malekula | 8 February 2016[145] | |
| 35.8 °C (96.4 °F) | Futuna Airport | 10 January 2016[145] | |
| 48.9 °C (120.0 °F) | Rivadavia, Salta Province[note 8] | 11 December 1905[173][174][175] | |
| 46.7 °C (116.1 °F) | Villamontes, Tarija Department | 29 October 2010[26][note 9] | |
| 44.8 °C (112.6 °F) | Araçuaí, Minas Gerais | 19 November 2023[176] | |
| 44.9 °C (112.8 °F) | Quillón, Biobio Region[note 10] | 26 January 2017[177][178] | |
| 45.0 °C (113.0 °F) | Puerto Salgar, Cundinamarca | 29 December 2015[179] | |
| 38.0 °C (100.4 °F) | Saint-Laurent-du-Maroni | 27 September 2016[145] | |
| 46.2 °C (115.2 °F) | Las Palmas | 10 December 2022[180] | |
| 41.6 °C (106.9 °F) | Iñapari | 7 October 2023[181] | |
| 44.0 °C (111.2 °F) | Paysandú, Paysandú Department | 20 January 1943[182][183] 14 January 2022[184] | |
| 43.6 °C (110.5 °F) | Santa Ana de Coro, Falcón | 29 April 2015[142] |
Other high-temperature records
| Country/Region | Temperature | Town/Location | Date | Record | Info |
|---|---|---|---|---|---|
| 37.8 °C (100.0 °F) | Marble Bar, Western Australia | 31 October 1923 to 7 April 1924 (160 days) | Most consecutive days above 37.8 °C (100 °F)[185] | - | |
| 93.9 °C (201.0 °F) | Death Valley | 15 July 1972 | Highest natural ground surface temperature[7] | - | |
| 48.9 °C (120.0 °F) | Death Valley | 9 July 1917 to 17 August 1917 (40 days) | Most consecutive days above 48.9 °C (120 °F)[186] | - |
- Highest temperature during rain: 48.3 °C (119.0 °F) in Imperial, California, 24 July 2018[187]
- Highest overnight low temperature: 44.2 °C (111.6 °F) at the Khasab weather station (WMO Index = 41241) in Oman on 17 June 2017.[188][note 11]
- Highest minimum temperature for a 24-hour period and for a calendar day: 42.6 °C (108.7 °F) at Qurayyat, Oman on 25 June 2018.[190]
- Highest average monthly temperature: 42.3 °C (108.1 °F), in Death Valley, California, for the month of July 2018.[191][192]
- Highest temperature north of the Arctic Circle: 38.0 °C (100.4 °F) in Verkhoyansk, Russia on 20 June 2020.[193][194][195][196]
- Highest temperature ever recorded north of the 50th parallel north: 49.6 °C (121.3 °F) at Lytton, British Columbia, Canada on 29 June 2021.[148][149][150]
Humidity
- Highest dew point temperature: A dew point of 35 °C (95 °F) — while the temperature was 42 °C (108 °F) — was observed at Dhahran, Saudi Arabia, at 3:00 p.m. on 8 July 2003.[197]
- Highest heat index: In the observation above at Dhahran, Saudi Arabia, the heat index ("feels like" temperature) was 81.1 °C (178.0 °F).[197]
- Highest temperature with 100% relative humidity: A temperature of 34 °C (93 °F) with 100% relative humidity in Jask, Iran, on 21 July 2012.[198]
Coldest
Lowest temperatures recorded
The lowest temperature recorded is −89.2 °C (−128.6 °F), in Antarctica.
Table
| Country/Region | Temperature | Town/Location | Date |
|---|---|---|---|
| −13.8 °C (7.2 °F) | Mécheria | 28 January 2005[199] | |
| 5.0 °C (41.0 °F) | Markoye | January 1975[25] | |
| −18.0 °C (−0.4 °F) | Gabal Katrina at elevation of 2,629 m While −6 °C in Saint Katherine City at 1,586 m. Sinai Peninsula is geologically part of the African Plate, yet geographically it's considered to be in Asia. |
?[200][201] | |
| −15.0 °C (5.0 °F) | Tsabong | ?[202] | |
| −6.7 °C (19.9 °F) | Big Bend | ?[29] | |
| 4.0 °C (39.2 °F) | Jenoi | 2003[30] | |
| 11.0 °C (51.8 °F) | Kumasi, Tafo | ?[203] | |
| 2.5 °C (36.5 °F) | Bareing | 2 January 1982[204] | |
| −21.0 °C (−5.8 °F) | ?[205] | ||
| −1.0 °C (30.2 °F) | Antsirabe, Vakinankaratra | ?[32] | |
| −23.9 °C (−11.0 °F) | Ifrane | 11 February 1935[206] | |
| −2.4 °C (27.7 °F) | Bilma | 13 January 1995[34] | |
| −5.0 °C (23.0 °F) | Gite de Bellecome | 10 September 1975[35] | |
| −20.1 °C (−4.2 °F) | Buffelsfontein, near Molteno, Eastern Cape | 23 August 2013[207] | |
| −14.5 °C (5.9 °F) | Teide, Tenerife | 29 January 2018[208] | |
| −1.0 °C (30.2 °F) | Zalingei | December 1961 January 1962[209] | |
| −89.2 °C (−128.6 °F) | Vostok Station | 21 July 1983[210][211][note 12] | |
| −52.2 °C (−62.0 °F) | Shahrak | January 1964[41] | |
| −42.0 °C (−43.6 °F) | Paghakn and Ashocq | 1961[91] | |
| −33.0 °C (−27.4 °F) | Julfa and Ordubad | ?[212] | |
| 1.1 °C (34.0 °F) | Dinajpur | 3 February 1905[213] | |
| −53.0 °C (−63.4 °F) | Mohe City, Heilongjiang | 22 January 2023[214][215][216] | |
| 7.0 °C (44.6 °F) | Mondulkiri, Ratanakiri and Preah Vihear | 29 January 2007[217] | |
| −6.0 °C (21.2 °F) | Tai Mo Shan | 24 January 2016 | |
| −45.0 °C (−49.0 °F) | Dras, Ladakh | 9 January 1995[218] | |
| −9.0 °C (15.8 °F) | Dieng Plateau | 24 June 2019[219] | |
| −36.0 °C (−32.8 °F) | Saqqez | 1972[220] | |
| −14.2 °C (6.4 °F) | Merom Golan | 10 January 2015[221] | |
| −41.0 °C (−41.8 °F) | Asahikawa, Hokkaidō | 25 January 1902[55] | |
| −16.0 °C (3.2 °F) | Shoubak | 15 December 2013[56] | |
| −57.0 °C (−70.6 °F) | Atbasar | ?[57] | |
| −4.8 °C (23.4 °F) | Salmy | 3 January 2009[222][223] | |
| −53.6 °C (−64.5 °F) | Fergana Valley | ?[224] | |
|
−6.4 °C (20.5 °F) |
Houche Al Oumara weather station | January 2016[225] | |
| 7.8 °C (46.0 °F) | Cameron Highlands | 1 February 1978[62] | |
| 17.2 °C (63.0 °F) | Hulhulé Island, located at Ibrahim Nasir International Airport | 11 April 1978[226] | |
| −55.3 °C (−67.5 °F) | Züüngovi, Uvs Province | 31 December 1976[63][227] | |
| −5.0 °C (23.0 °F) | Hakha | 30 December 1990[228][26] | |
| −45.0 °C (−49.0 °F) | Sagarmatha | ?[66] | |
| −43.6 °C (−46.5 °F) | Chunggangjin | 12 January 1933[229] | |
| −9.7 °C (14.5 °F) | Jabel Shams | January 2015[230] | |
| −24.0 °C (−11.2 °F) | Skardu | 7 January 1995[231] | |
| 6.3 °C (43.3 °F) | Baguio | 18 January 1961[69][232] [note 13] | |
| 1.5 °C (34.7 °F) | Abu Samra | 5 February 2017[27] | |
| −67.8 °C (−90.0 °F) | Verkhoyansk and Oymyakon, both in Sakha Republic |
15 January 1885
5,7 February 1892 | |
| −12.0 °C (10.4 °F) | Turaif | ?[235] | |
| 19.0 °C (66.2 °F) | Paya Lebar | 14 February 1989[71] | |
| −32.6 °C (−26.7 °F) | Yangpyeong | 5 January 1981[236] | |
| −2.6 °C (27.3 °F) | Nuwara Eliya | 14 January 1929[237] | |
| −23.0 °C (−9.4 °F) | Idlib | January 1951[238] | |
| −18.4 °C (−1.1 °F) | Yushan | 31 January 1970[239][240] | |
| −1.4 °C (29.5 °F) | Sakon Nakhon | 2 January 1974[241] | |
| −46.4 °C (−51.5 °F) | Çaldıran, Van Province | 9 January 1990[81] | |
| −36.0 °C (−32.8 °F) | Daşoguz Region | ?[82] | |
| −5.4 °C (22.3 °F) | Jebel Jais | 3 February 2017[27] | |
| −6.1 °C (21.0 °F) | Sa Pa | 4 January 1974[242] | |
| −29.0 °C (−20.2 °F) | Shtylle | 9 January 2017[243] | |
| −52.6 °C (−62.7 °F) | Grünloch doline | 19 February 1932[244] | |
| −42.2 °C (−44.0 °F) | Slavnom, Vitebsk Region | 17 January 1940[245] | |
| −30.1 °C (−22.2 °F) | Valley of the Lesse in Rochefort | 20 January 1940[246] | |
| −42.5 °C (−44.5 °F) | Igman in Sarajevo Canton | 24 January 1963[247] | |
| −38.3 °C (−36.9 °F) | Tran | 25 January 1947[98] | |
| −34.6 °C (−30.3 °F) | Gračac | 13 January 2003[248][note 14] | |
| −12.8 °C (9.0 °F) | Trikoukia, Prodromos | 30 January 1964[249] | |
| −42.2 °C (−44.0 °F) | Litvínovice | 11 February 1929[101] | |
| −31.2 °C (−24.2 °F) | Thisted Municipality, North Denmark Region | 8 January 1982[102] | |
| −43.5 °C (−46.3 °F) | Jõgeva, Jõgeva County | 17 January 1940[103] | |
| −51.5 °C (−60.7 °F) | Pokka, Kittilä, Lapland | 28 January 1999[104][250] | |
| −41.0 °C (−41.8 °F) | Mouthe, Doubs | 17 January 1985[251] | |
| −45.9 °C (−50.6 °F) | Funtensee, Berchtesgadener Land, Bavaria | 24 December 2001[252] | |
| −27.8 °C (−18.0 °F) | Ptolemaida | 27 January 1963[253] | |
| −35.0 °C (−31.0 °F) | Görömbölytapolca | 16 February 1940[107] | |
| −37.9 °C (−36.2 °F) | Grímsstaðir | 21 January 1918[108] | |
| −19.1 °C (−2.4 °F) | Markree Castle, County Sligo | 16 January 1881[110] | |
| −49.6 °C (−57.3 °F) | Busa Fradusta, Pale di San Martino | 10 February 2013[254] | |
| −43.2 °C (−45.8 °F) | Daugavpils | 8 February 1956[112] | |
| −42.9 °C (−45.2 °F) | Utena, Utena County | 1 February 1956[116] | |
| −20.2 °C (−4.4 °F) | 2 February 1956[255] | ||
| 1.4 °C (34.5 °F) | Malta International Airport | 29 January 1981[119][120] | |
| −35.5 °C (−31.9 °F) | Brătușeni, Edineț District | 20 January 1963[121] | |
| −5.2 °C (22.6 °F) | Monaco | 10 February 1986[256] | |
| −27.4 °C (−17.3 °F) | Winterswijk, Gelderland | 27 January 1942[257] | |
| −31.5 °C (−24.7 °F) | Berovo, Berovo Municipality | 27 January 1954[258] | |
| −51.4 °C (−60.5 °F) | Karasjok, Finnmark | 1 January 1886[127] | |
| −41.0 °C (−41.8 °F) | Siedlce, Masovian Voivodeship | 11 January 1940[129] | |
| −16.0 °C (3.2 °F) | Penhas da Saúde, Covilhã Municipality Miranda do Douro |
16 January 1945 and 5 February 1954[259] | |
| −38.5 °C (−37.3 °F) | Bod, Brașov County | 25 January 1942[260] | |
| −39.8 °C (−39.6 °F) | Karajukića Bunari, Zlatibor District | 26 January 2006[261] | |
| −41.0 °C (−41.8 °F) | Vígľaš-Pstruša | 11 February 1929[134] | |
| −34.5 °C (−30.1 °F) | Babno Polje | 15 February 1956 16 February 1956 13 January 1968[note 15][262] | |
| −32.0 °C (−25.6 °F) | Estany Gento (Province of Lleida)[note 16] | 2 February 1956[263] | |
| −52.6 °C (−62.7 °F) | Vuoggatjålme, Lappland | 2 February 1966[137] | |
| −41.8 °C (−43.2 °F) | La Brévine | 12 January 1987[138] | |
| −41.9 °C (−43.4 °F) | Luhansk | 8 January 1935[139][264] | |
| −27.2 °C (−17.0 °F) | Braemar, Aberdeenshire Altnaharra, Sutherland |
11 February 1895 10 January 1982 30 December 1995[265] | |
| 16.1 °C (61.0 °F) | V. C. Bird International Airport, Antigua | 31 December 1974 and 28 January 1976[143][144] | |
| −63.0 °C (−81.4 °F) | Snag, Yukon | 3 February 1947[210][266] | |
| 11.1 °C (52.0 °F) | Owen Roberts International Airport, Grand Cayman | ?[267] | |
| 0.6 °C (33.1 °F) | Bainoa, Mayabeque Province | 18 February 1996[268] | |
| −7.0 °C (19.4 °F) | Valle Nuevo, La Vega Province | 17 January 1983[269] | |
| −69.6 °C (−93.3 °F) | Klinck Automated Weather Station, Greenland Ice Sheet | 22 December 1991[193] | |
| −11.5 °C (11.3 °F) | Olintepeque, Quetzaltenango Department | ?[156] | |
| 14.1 °C (57.4 °F) | Le Lamentin | 25 December 1964[158] | |
| −25.1 °C (−13.2 °F) | Madera, Chihuahua | 27 December 1997[270] | |
| 2.0 °C (35.6 °F) | Bajo Grande, Chiriquí Province | 20 February 1995[161] | |
| 4.4 °C (40 °F) | Aibonito San Sebastián |
9 March 1911 24 January 1966[162] | |
| 10.6 °C (51 °F) | Anna's Hope, Saint Croix | 31 January 1954[162] | |
( |
−62.2 °C (−80 °F) | Prospect Creek, Alaska | 23 January 1971[271] |
(contiguous) |
−56.7 °C (−70 °F) | Rogers Pass, Montana | 20 January 1954[272] |
| −32.8 °C (−27.0 °F) | Sarmiento, Chubut Province | 1 June 1907[273][note 17] | |
| −14.0 °C (6.8 °F) | Caçador, Santa Catarina | 11 June 1952[274][275] | |
| −28.5 °C (−19.3 °F) | Balmaceda, Aysen Region | 16 June 1958[276] | |
| −11.0 °C (12.2 °F) | Páramo de Berlín, Tona, Santander | 11 December 1974[277] | |
| 18.9 °C (66.0 °F) | Willemstad | 12 December 2017[278] | |
| 16.9 °C (62.4 °F) | Maripasoula | 23 January 1964[279] | |
| −7.5 °C (18.5 °F) | Pratts Gill, Boquerón Department | 13 July 2000[280] | |
| −25.2 °C (−13.4 °F) | Mazo Cruz, Puno Region | 30 June 1966[281] | |
| −11.0 °C (12.2 °F) | Melo, Cerro Largo Department | 14 June 1967[182][183] | |
| −23.0 °C (−9.4 °F) | Charlotte Pass, New South Wales | 29 June 1994[282][283] | |
( |
−11.1 °C (12.0 °F) | Mauna Kea, Hawaii | 17 May 1979[284] |
| 20.0 °C (68.0 °F) | Yaren District | ?[citation needed] | |
| −25.6 °C (−14.1 °F) | Ranfurly, Central Otago | 18 July 1903[285] | |
| 11.1 °C (52.0 °F) | Afiamalu | 29 September 1971[172] | |
| 17.0 °C (62.6 °F) | Rennell Tingoa |
Early June 2016 30 June 2016[286] |
Other low-temperature records
- Coldest summer (month of July in the Northern Hemisphere): −33 °C (−27.4 °F); Summit Camp, Greenland on 4 July 2017.[287]
- Lowest temperature in the Northern Hemisphere: −69.6 °C (−93.3 °F); Greenland Ice Sheet, Greenland on 22 December 1991.[193]
Record extreme temperature differences
- Greatest 2-minute temperature increase: 27 °C (49 °F), from −20 °C (−4 °F) to 7 °C (45 °F); Spearfish, South Dakota, on 22 January 1943.[210]
- Greatest 24-hour temperature increase: +57 °C (+102.6 °F), from −48 °C (−54 °F) to 9 °C (48 °F); Loma, Montana, on 15 January 1972.[288]
- Fastest temperature drop: 27.2 °C (49 °F) in 5 minutes; Rapid City, South Dakota, 10 January 1911.[210]
- Largest temperature range ever in 1 area: 105.8 °C (190.4 °F), from −67.8 °C (−90.0 °F) on 15 January 1885, 5,7 February 1892 to 38.0 °C (100.4 °F) on 20 June 2020; Verkhoyansk, Sakha Republic, Russia[289][290][291][196]
Precipitation
- Least per year (locale): 0.2 millimetres (0.008 in) per year or less, Quillagua, Antofagasta Region, Chile.[292]
Rain
- Most in 60 seconds (1 minute): 38 mm (1.5 in). Barot, Sainte-Anne, Grande-Terre, Guadeloupe, France 11:03–11:04 am on 26 November 1970.[293]
- Most in 180 seconds (3 minutes): 62 mm (2.4 in). Portobelo, Colón, Panama, 29 November 1911[294][295]
- Most in 300 seconds (5 minutes): 106 mm (4.2 in). Portobelo, Colón, Panama, 29 November 1911[294][295]
- Most in 60 minutes (1 hour): 305 mm (12.0 in). Holt, Missouri, United States, 22 June 1947.[106]
- Most in 12 hours (1⁄2-day): 1,144 mm (45.0 in); Cilaos, Réunion, 8 January 1966, during Tropical Cyclone Denise.[106]
- Most in 24 hours (1 day): 1,825 mm (71.9 in); Cilaos, Réunion, 7–8 January 1966, during Tropical Cyclone Denise.[106]
- Most in 48 hours (2 days): 2,493 mm (98.1 in); Cherrapunji, Meghalaya, India, 15–16 June 1995.[106]
- Most in 72 hours (3 days): 3,929 mm (154.7 in); Commerson, Réunion, 24–26 February 2007, during Cyclone Gamede.[106]
- Most in 96 hours (4 days): 4,869 mm (191.7 in); Commerson, Réunion, 24–27 February 2007, during Cyclone Gamede.[106]
- Most in one year: 26,470 mm (1,042 in); Cherrapunji, Meghalaya, India, 1860–1861.[106]
- Most from a single tropical cyclone: 6,433 mm (253.3 in); Commerson, Réunion, during Cyclone Hyacinthe in January 1980.[296][297]
- Highest average annual total (observed over 10 years): 11,872 mm (467.4 in) (over 38 years) and 12,701 mm (500.0 in) (1998–2010); Mawsynram, Meghalaya, India or 13,466 mm (530.2 in) (1980–2011); López de Micay, Cauca, Colombia.[106][298]
- Most consecutive days with measurable rain a day with at least 0.01 inches (0.25 mm) of rainfall: 331 days in Oahu, Hawaii, 1939–1940[299]
Snow
- Most in a 24-hour period: 230 centimetres (90.6 in) of snow on Mount Ibuki, Japan on 14 February 1927.[300]
- Most in one calendar month: 9.91 meters (390 inches) of snow fell in Tamarack, California, in January 1911, leading to a snow depth in March of 11.46 meters (451 inches) (greatest measured in North America).[301][302]
- Most in one season (1 July – 30 June): 29.0 meters, (95 ft); Mount Baker, Washington, United States, 1998 through 1999.[301]
- Most in one-year period: 31.5 meters (102 ft); Mount Rainier, Washington, United States, 19 February 1971 to 18 February 1972.[210]
- Deepest snowfall recorded: 11.82 meters (38.8 ft) on Mount Ibuki, Japan on 14 February 1927.[303]
- Lowest latitude that snow has been recorded at sea level in North America: Snow fell as far south as the city of Tampico, Mexico, in February 1895 during the Great Freeze.[304][305]
Wind speeds
- Fastest ever recorded: 484±32 km/h (301±20 mph) (3-second gust); observed by a DOW (Doppler On Wheels) radar unit in the 1999 Bridge Creek–Moore tornado between Oklahoma City and Moore, Oklahoma, USA, 3 May 1999.[306]
- Fastest non-tornadic winds: 408 km/h (254 mph) (3-second gust); recorded by anemometer in Severe Tropical Cyclone Olivia passing over Barrow Island, Western Australia, 10 April 1996.[307][308]
- Fastest non-cyclonic winds: 372 km/h (231 mph) (1-minute average); recorded by anemometer on Mount Washington, New Hampshire, USA, 12 April 1934.[307][308]
- Fastest daily average: 174 km/h (108 mph); Port Martin (Adélie Land), Antarctica, 24-hour period from 21 March 1951 to 22 March 1951.[210]
Tornadoes

Deadliest in history
- On Earth: Approximately 1,300 deaths (Daulatpur–Saturia tornado); Manikganj District, Bangladesh on 26 April 1989.[309]
- In North America: 695 deaths (Tri-State Tornado); Missouri, Illinois, Indiana, United States, 18 March 1925.[210]
- In Europe: 600 or more deaths (Grand Harbour Tornado); Valletta, Malta, 23 September 1551 or 1556 (sources conflict).[310]
- In South America: 63 deaths, San Justo, Santa Fe, Argentina, 10 January 1973.[311]
- In Australia: Three deaths, Kin Kin, Queensland tornado, 14 August 1971.[312]
Outbreaks
- Largest and most severe: The 2011 Super Outbreak: 207 confirmed tornadoes occurred in a span of 24 hours, with a total of 337 occurring throughout the duration of the outbreak. They affected six US states, and included 11 rated EF4 and 4 rated EF5.[313]
Tropical cyclones
Most intense (by minimum surface air pressure)
- Most intense ever recorded: 870 hPa (25.69 inHg); eye of Super Typhoon Tip over the northwest Pacific Ocean, 12 October 1979.[210]
- Most intense in the Western Hemisphere: 872 hPa (25.75 inHg); eye of Hurricane Patricia over the eastern Pacific Ocean, 23 October 2015.[314]
- Most intense ever recorded on land: 892 hPa (26.35 inHg); Craig Key, Florida, United States, eye of the Labor Day Hurricane, 2 September 1935. While other landfalling tropical cyclones potentially had lower pressures, data is vague from areas other than the Atlantic basin, especially before the invention of weather satellites.[315]
- Most intense landfall (estimated): 884 hPa (26.10 inHg); Rakiraki District, Viti Levu, Fiji, during Cyclone Winston, 20 February 2016. Although no official land pressure readings were recorded at the landfall site, it is estimated the Winston made landfall with the aforementioned pressure.[316]
Most precipitation
- Most precipitation from a single tropical storm: 6,433 mm (253.3 in); Commerson, Réunion, during Cyclone Hyacinthe in January 1980.
Other severe weather

Hail
- Heaviest officially recorded: 1.02 kg (2.25 lb); Gopalganj District, Bangladesh, 14 April 1986.[317]
- Largest diameter officially measured: 20 cm (8.0 in) diameter, 47.3 cm (18.625 in) circumference; Vivian, South Dakota, 23 July 2010.[318]
- Largest circumference officially measured: 47.6 cm (18.75 in) circumference, 17.8 cm (7.0 in) diameter; Aurora, Nebraska, 22 June 2003.[317][319]
Lightning
- Longest lightning bolt: 768 km (477 mi) on 29 April 2020 in the southern United States.[320]
- Longest duration for a single lightning flash: 17.1 seconds on 18 June 2020 in Uruguay and northern Argentina.[320]
Ultraviolet index
- Highest ultraviolet index measured: On 29 December 2003, a UV index of 43.3 was detected at Chile/Bolivia's Licancabur volcano, at 19,423 feet (5,920 m) altitude. A light-skinned individual in such conditions may experience moderate sunburn in as little as 4 minutes.[321]
Other categories
- Highest air pressure ever recorded [above 750 meters (2,461 feet)]: 1084.8 hPa (32.03 inHg); Tosontsengel, Zavkhan, Mongolia, 19 December 2001.[322] This is the equivalent sea-level pressure; Tosontsengel is located at 1,300 metres (4,300 ft) above sea level.
- The highest adjusted-to-sea-level barometric pressure ever recorded (below 750 meters) was at Agata, Evenkiyskiy, Russia (66°53′N 93°28′E / 66.883°N 93.467°E, elevation: 261 m (856.3 ft)) on 31 December 1968 of 1083.3 hectopascals (hPa) (31.99 inHg).[323]
- The discrimination is due to the problematic assumptions (assuming a standard lapse rate) associated with reduction of sea level from high elevations.[322][323]
See also
- Weather of 2013
- Extremes on Earth
- List of extreme temperatures in Canada
- List of snowiest places in the United States by state
- U.S. state and territory temperature extremes
- United Kingdom weather records
- Weather extremes in Canada
- Climate change
Notes
- ^ A reading of 50.1 °C (122.2 °F) in Vioolsdrif on 28 November 2019 was declared invalid by the South African Weather Service.[37]
- ^ According to Christopher Burt, Africa's hottest reliably measured temperature is 50.7 °C (123.3 °F) at Semara, Western Sahara on 13 July 1961.[39] This value was surpassed on 5 July 2018 when 51.3 °C (124.3 °F) was recorded at Ouargla, Algeria.[22]
- ^ The temperature has been reported as 54.0 °C (129.2 °F), however weather historian Christopher Burt argues that the thermograph trace was misread.[53]
- ^ According to the World Meteorological Organization, the reported temperature is the highest recorded in Asia.[58]
- ^ a b c d Part of the July 2019 European heat wave
- ^ A disputed record temperature of 42.9 °C (109.2 °F) was measured on 24 July 2019 in Deelen, Gelderland.[124]
- ^ Record measured on German territory at that time: Proskau, Landkreis Oppeln, Oberschlesien (now Prószków, Opole Voivodeship). The record in Poland proper at that time was attained on the same day by the village of Zbiersk at 40.0 °C.[128]
- ^ According to Christopher Burt, South America's hottest reliably measured temperature is 47.3 °C (117.1 °F) at Campo Gallo, Argentina on 16 October 1936.[39] Another record, of 49.1 °C (120.4 °F), registered in Villa de María del Río Seco, Córdoba Province, on 2 January 1920, is disputed and considered dubious.
- ^ Temperature reached on multiple occasions; this is the most recent.
- ^ This record is disputed because of the forest fires that occurred around the town of Quillón. It is highly probable those fires have influenced this record.
- ^ The former world record was 43.3 °C (110 °F) set on 5 July 1918, in Death Valley, California.[189]
- ^ This temperature is considered the lowest ever officially recorded in Antarctica and in the World, as it was perceived by ground-positioned thermometers in 1983. Satellite analyses made on 10 August 2010 pointed to a temperature of −93.2 °C (−135.8 °F) near Dome F in Queen Maud Land, but this record is not officially listed because it was measured by remote sensing methods that are not totally consistent, unlike the 1983 temperature. See Lowest temperature recorded on Earth for details.
- ^ It is reported by local news outlet that temperatures Mount Pulag which is 2,926 meters above sea level plunges to as low as −2.0 °C (28.4 °F) although it was not verifiable.[233]
- ^ A reading of −35.5 °C (−31.9 °F) in Čakovec on 3 February 1929 and −36.0 °C (−32.8 °F) in Gospić were not measured under standard conditions and are not considered to be official record lows in Croatia.[248]
- ^ The lowest unofficially measured temperature in Slovenia was recorded at Komna on 9 January 2009 and reached −49 °C (−56 °F).
- ^ The records of −34.1 °C (−29.4 °F) of Clot del Tuc de la Llança, Catalonia, and −35.4 °C (−31.7 °F) of Vega de Liordes, León, both registered in January 2021, are not recognized by AEMET.
- ^ the Servicio Meteorologico Nacional, Argentina's national meteorological organization, reports a record low of −39 °C (−38 °F) in a high mountain valley of Río de los Patos, but this is not recognized by the World Meteorological Organization.[39]
References
- ^ "Mean Monthly Temperature Records Across the Globe / Timeseries of Global Land and Ocean Areas at Record Levels for October from 1951-2023". NCEI.NOAA.gov. National Centers for Environmental Information (NCEI) of the National Oceanic and Atmospheric Administration (NOAA). November 2023. Archived from the original on 16 November 2023. (change "202310" in URL to see years other than 2023, and months other than 10=October)
- ^ "World Meteorological Organization: Global Weather & Climate Extremes". World Meteorological Organization. Archived from the original on 13 December 2013. Retrieved 15 December 2013.
- ^ "Mean Monthly Temperature Records Across the Globe". NCEI.NOAA.gov. National Centers for Environmental Information (NCEI) of the National Oceanic and Atmospheric Administration (NOAA). November 2023. Archived from the original on 16 November 2023. (Change "202310" in URL to see years other than 2023, and months other than 10=October. Use "Timeseries of ratio... data across all months.)
- ^ "The 2023 Annual Climate Summary / Global Climate Highlights 2023". Copernicus Programme. 9 January 2024. Archived from the original on 9 January 2024.
- ^ WMO (2018): Guide to Instruments and Methods of Observation
- ^ a b c Mildrexler, David J.; Zhao, Maosheng; Running, Steven W. (2011). "Satellite Finds Highest Land Skin Temperatures on Earth". Bulletin of the American Meteorological Society. 2011 (7): 855–860. Bibcode:2011BAMS...92..855M. doi:10.1175/2011BAMS3067.1.
- ^ a b Kubecka, Paul (2001). "A possible world record maximum natural ground surface temperature". Weather. 56 (7): 218–221. Bibcode:2001Wthr...56..218K. doi:10.1002/j.1477-8696.2001.tb06577.x. S2CID 120698040.
- ^ Table 9.2, p. 158, Dryland Climatology, Sharon E. Nicholson, Cambridge University Press, 2011, ISBN 1139500244.
- ^ Garratt, J. R. (1992). "Extreme Maximum Land Surface Temperatures". Journal of Applied Meteorology. 31 (9): 1096–1105. Bibcode:1992JApMe..31.1096G. doi:10.1175/1520-0450(1992)031<1096:EMLST>2.0.CO;2.
- ^ Coldest spot on Earth identified by satellite Archived 14 April 2016 at the Wayback Machine, Jonathan Amos, BBC News, 9 December 2013.
- ^ The Coldest Place on Earth: -90 °C and below from Landsat 8 and other satellite thermal sensors Archived 3 March 2016 at the Wayback Machine, Ted Scambos, Allen Pope, Garrett Campbell, and Terry Haran, American Geophysical Union fall meeting, 9 December 2013.
- ^ "World: Highest Temperature". World Meteorological Organization. Archived from the original on 1 May 2018. Retrieved 1 May 2018.
- ^ a b "Doubts Cloud Death Valley's 100-year Heat Record". 15 July 2013. Archived from the original on 30 December 2013. Retrieved 30 December 2013.
- ^ a b Burt, Christopher C. (22 July 2016). "Hottest Reliably Measured Air Temperatures on Earth". Weather Underground. Archived from the original on 12 August 2016. Retrieved 3 August 2016.
- ^ a b Fadli, Khalid; Cerveny, Randall; Burt, Christopher; Eden, Philip; Parker, David; Brunet, Manola; Peterson, Thomas (2013). "World Meteorological Organization Assessment of the Purported World Record 58 °C Temperature Extreme at El Azizia, Libya (13 September 1922)". Bulletin of the American Meteorological Society. 94 (2): 199–204. Bibcode:2013BAMS...94..199E. doi:10.1175/BAMS-D-12-00093.1.
- ^ a b "Climate Extremes in Israel". Israel Meteorological Service. 21 June 1942. Archived from the original on 6 October 2010. Retrieved 5 December 2019.
- ^ "Temperature reaches 130 °F (54.4 °C) at California's Death Valley". 10 July 2021.
- ^ Weather Extremes Archived 25 October 2016 at the Wayback Machine, Weather Underground – Retrieved 14 September 2012.
- ^ Burt, Christopher C (2004). Extreme Weather. W. W. Norton & Company. p. 36. ISBN 978-0-393-32658-1. Retrieved 21 June 2007.
heat burst 158.
- ^ World Meteorological Organization (26 July 2023). "July 2023 is set to be the hottest month on record". public.wmo.int. Retrieved 31 July 2023.
- ^ McGuinness, Jackie; Rohloff, Katherine (14 August 2023). "NASA Clocks July 2023 as Hottest Month on Record Ever Since 1880". NASA. Retrieved 16 August 2023.
- ^ a b Watts, Jonathan (13 July 2018). "Heatwave sees record high temperatures around world this week". The Guardian. Archived from the original on 31 July 2018. Retrieved 31 July 2018.
- ^ "Botswana: Heat Wave Breaks Maximum Temperature Records". Archived from the original on 26 January 2016. Retrieved 24 January 2016.
- ^ "Weather Data: Botswana, Maun, 2016, January". Retrieved 26 June 2020.
- ^ a b "Programme D'Action National D'Adaptation a la Variabilite et aux Changements Climatiques (Pana du Burkina Faso)" (PDF) (in French). Ministere de L'Environnnement et du Cadre de Vie. p. 11. Archived (PDF) from the original on 20 October 2016. Retrieved 22 October 2016.
- ^ a b c d e f g h i j k "May 2023 was the world's third-warmest May on record". 14 June 2023.
- ^ a b c d e f g Masters, Jeff (18 January 2018). "NOAA: Earth Had Its Third Warmest Year on Record in 2017". Wunderground. Archived from the original on 30 April 2018. Retrieved 29 April 2018.
- ^ "Météo climat stats | Station Asswan / Données Météorologiques Gratuites" [Weather climate stats] (in French).
- ^ a b "Groundwater Resources of Swaziland" (PDF). Swaziland Ministry of Natural Resources, Land Use and Energy. December 1992. p. 7. Archived (PDF) from the original on 23 October 2016. Retrieved 22 October 2016.
- ^ a b "Third National Communication of the Gambia under the UNFCCC" (PDF). Ministry of Climate Change environment and Natural Resources. 2020. p. 4. Archived (PDF) from the original on 6 July 2021. Retrieved 5 November 2021.
- ^ Masters, Jeff (13 October 2023). "September 2023 was Earth's most extreme month for heat ever recorded » Yale Climate Connections". Yale Climate Connections. Retrieved 4 December 2023.
- ^ a b "Madagascar Initial National Communication" (PDF) (in French). Le Ministre de l'Environnement, des Eaux et des Forets. 2019. p. 22. Archived from the original (PDF) on 4 November 2021. Retrieved 4 November 2021.
- ^ https://twitter.com/BNONews/status/1690094767655231488
- ^ a b "Troisieme Communication Nationale A La Conference Des Parties De La Conventioncadre Des Nations Unies Sur Les Changements Climatiques" (PDF). Republique de Niger. p. 8. Archived from the original (PDF) on 6 May 2018. Retrieved 6 May 2018.
- ^ a b "Climat de la Réunion" (in French). Météo-France. Archived from the original on 1 January 2019. Retrieved 31 December 2018.
- ^ "What are the temperature, rainfall and wind extremes in SA?". South African Weather Service. Archived from the original on 17 May 2017. Retrieved 17 May 2017.
- ^ "VIOOLSDRIF TEMPERATURE ON 28 NOVEMBER 2019" (PDF). South African Weather Service. Archived from the original (PDF) on 3 December 2019. Retrieved 3 December 2019.
- ^ Khalid Ibrahim El Fadli; Randall S. Cerveny; Christopher C. Burt; Philip Eden; David Parker; Manola Brunet; Thomas C. Peterson; Gianpaolo Mordacchini; Vinicio Pelino; Pierre Bessemoulin; José Luis Stella; Fatima Driouech; M.M Abdel wahab; Matthew B. Pace (2012). "World Meteorological Organization Assessment of the Purported World Record 58 °C Temperature Extreme at El Azizia, Libya (13 September 1922)". Bulletin of the American Meteorological Society. 94 (2): 199–204. Bibcode:2013BAMS...94..199E. doi:10.1175/BAMS-D-12-00093.1.
- ^ a b c d Burt, Christopher C. (19 August 2016). "Hottest Reliably Measured Air Temperatures on Earth: PART TWO". Weather Underground. Archived from the original on 25 December 2017. Retrieved 2 October 2016.
- ^ "WMO Region VII (Antarctic: all land/ice south of 60°S): Highest Temperature". Archived from the original on 6 November 2021. Retrieved 5 November 2021.
- ^ a b Afghanistan Constitution and Citizenship Law Handboook – Strategic Information and Basic Laws. Int'l Business Publications. 2013. p. 61. ISBN 978-1-4387-7835-8.
- ^ "Bangladesh records highest temperature 42.2-degree Celsius in last 14 years". Asian Tribune. 27 April 2009. Archived from the original on 18 June 2015. Retrieved 7 November 2016.
- ^ Passang Norbu (14 June 2013). "The heat has got into the Himalayas". Kuensel. Archived from the original on 2 April 2015. Retrieved 2 March 2015.
- ^ a b "Exceptional Heat Wave 2016". Meteo France. Archived from the original on 28 April 2016. Retrieved 29 April 2016.
- ^ "China logs 52.2 Celsius as extreme weather rewrites records". Reuters. 17 July 2023. Retrieved 18 July 2023.
- ^ "Shek Wu Hui Playground Display 41 °C,A large number of people come to Take a Photo". 31 May 2023.
- ^ "Indian summer makes history, Phalodi in Rajasthan boils at 51 °C". Skymet Weather. Archived from the original on 20 May 2016. Retrieved 19 May 2016.
- ^ "Historis Kejadian Iklim Ekstrim" (in Indonesian). Meteorology, Climatology, and Geophysical Agency of Indonesia (BMKG). 2011. Archived from the original on 2 May 2021. Retrieved 2 May 2021.
- ^ Putri, Gloria Setyvani (24 October 2019). "Cuaca Panas Masih 9 Hari, Ini Daftar Hari Terpanas di Indonesia" (in Indonesian). Kompas. Archived from the original on 8 March 2022. Retrieved 2 May 2021.
- ^ "Temperatures in Iranian city of Ahvaz hit 129.2F (54C), near hottest on Earth in modern measurements". independent. 30 June 2017. Archived from the original on 30 June 2017. Retrieved 30 June 2017.
- ^ Samenow, Jason (22 July 2016). "Two Middle East locations hit 129 degrees, hottest ever in Eastern Hemisphere, maybe the world". The Washington Post. Archived from the original on 23 July 2016. Retrieved 23 July 2016.
- ^ Tapper, James (23 July 2016). "Think you're hot? Spare a thought for Kuwait, as mercury hits record 54C". The Guardian. Archived from the original on 23 October 2016. Retrieved 22 October 2016.
- ^ Burt, Christopher C. (22 October 2010). "Hottest air temperatures reported on Earth". Weather Underground. Archived from the original on 3 January 2014. Retrieved 7 January 2014.
- ^ "Japan heatwave: Temperature hits new historic record 41.1C, says Japanese weather agency". The Independent. 23 July 2018. Retrieved 15 April 2021.
- ^ a b c "National Rankings". Japan Meteorological Agency. Retrieved 9 August 2021.
- ^ a b القيم المتطرفة (in Arabic). Jordanian Meteorological Department. Archived from the original on 27 November 2016. Retrieved 27 November 2016.
- ^ a b "Climate and weather of Kazakhstan". Advantour.
- ^ a b c "WMO verifies 3rd and 4th hottest temperature recorded on Earth". World Meteorological Organization. 18 June 2019. Archived from the original on 18 December 2023. Retrieved 18 June 2019.
- ^ "National Report". cbd.minjust.gov.kg. Retrieved 19 July 2022.
- ^ "Vietnam and Laos record hottest temperatures ever as heat wave grips Southeast Asia". CNN. 8 May 2023. Retrieved 17 May 2023.
- ^ "Climate details in Lebanon".
- ^ a b "General Climate Information". Malaysia Meteorological Department. Archived from the original on 16 November 2015. Retrieved 30 June 2010.
- ^ a b "Mongolia: Assessment Report on Climate Change 2009" (PDF). Ministry of Environment, Nature and Tourism, Mongolia. September 2009. pp. 36–37. Archived (PDF) from the original on 9 December 2015. Retrieved 23 October 2016.
- ^ Myint, Yee (2 May 2016). "Heat takes its toll". Myanmar Times. Archived from the original on 23 October 2016. Retrieved 23 October 2016.
- ^ Soe, Kyaw (25 February 2016). "Warnings of strong El Niño through June". Myanmar Times. Archived from the original on 24 October 2016. Retrieved 23 October 2016.
- ^ a b "Climatic Extremities in Nepal". Compendium of Environmental Statistics Nepal 2015. Central Bureau of Statistics. 2016. pp. 43–44. Archived from the original on 19 December 2019. Retrieved 18 December 2019.
- ^ "The highest temperatures recorded", Oman Meteorology, retrieved 17 June 2021
- ^ Vidal, John; Walsh, Declan (1 June 2010). "Temperatures reach record high in Pakistan". The Guardian. Retrieved 15 October 2019.
- ^ a b "Second National Communication to the United Nations Framework Convention on Climate Change" (PDF). Government of the Philippines. 29 December 2014. p. 6. Archived (PDF) from the original on 15 February 2017. Retrieved 24 October 2016.
- ^ "saudigazette". Archived from the original on 30 September 2015.
- ^ a b "Historical Extremes". Meteorological Service Singapore. Archived from the original on 27 November 2016. Retrieved 8 December 2016.
- ^ "Temperature soars to 37 °C in Singapore, equals record for daily high set in 1983". CNA. Retrieved 14 May 2023.
- ^ "한반도 폭염 신기원...서울 39.6도·홍천 41.0도". news1. Retrieved 1 August 2018.
- ^ "Ever Recorded Daily Extreme Values" (PDF). 29 December 2009. Archived from the original (PDF) on 29 December 2009. Retrieved 20 April 2023.
- ^ "SL experiencing highest temperatures in 140 years: Prof. Jayaratne - Breaking News | Daily Mirror". www.dailymirror.lk. Retrieved 20 April 2023.
- ^ "Initial National Communication of the Syrian Arab Republic" (PDF). Ministry of state for Environmental Affairs. April 2010. pp. 18–20. Archived (PDF) from the original on 24 October 2016. Retrieved 24 October 2016.
- ^ "Ventusky - Weather Forecast Maps". www.ventusky.com. Retrieved 20 July 2022.
- ^ Masters, Jeff (12 January 2023). "2022: Earth's 5th- or 6th-warmest year on record » Yale Climate Connections". Yale Climate Connections. Retrieved 4 December 2023.
- ^ "Tajikistan Climate and Weather - Average Temperatures and Precipitation". www.advantour.com.
- ^ "Historic Asia heat breaks hundreds of records, with extremes in Thailand and China". The Washington Post. 17 April 2023. Retrieved 17 May 2023.
- ^ a b "Ülkemizi etkisi altına alan sıcak hava dalgasının etkisiyle, bugün Türkiye'de sıcaklık rekoru kırıldı".
- ^ a b "Third National Communication of Turkmenistan Under the United Nations Framework Convention on Climate Change" (PDF). Ministry of Nature Protection of Turkmenistan. 2015. pp. 12–13. Archived (PDF) from the original on 25 October 2016. Retrieved 24 October 2016.
- ^ "Report on implementation of the UNCCD in Turkmenistan". Ministry of Nature Protection of Turkmenistan. 2000. p. 7. Archived from the original on 18 November 2016. Retrieved 18 November 2016.
- ^ Ponce de Leon, Janice (11 August 2016). "Debunking weather myths in the UAE". Gulf News. Archived from the original on 18 November 2016. Retrieved 18 November 2016.
- ^ Croucher, Martin (12 July 2013). "UAE weather: Temperature soars to near record level". The National. Archived from the original on 18 November 2016. Retrieved 18 November 2016.
- ^ Nguyen Hoai (2023). "Nghe An recorded 44.2 degrees Celsius, the highest in Vietnamese history". Tien Phong News. Retrieved 7 May 2023.
- ^ https://weatherandclimate.com/united-kingdom/dhekelia
- ^ https://weatherandclimate.com/united-kingdom/akrotiri
- ^ "Albania hits all-time high as heat blasts southern Europe and fires rage". Washington Post.
- ^ "French Station Breaks All-Time Heat Record by Astounding Margin". www.wunderground.com. Retrieved 17 July 2022.
- ^ a b "Republic of Armenia Third National Communication on Climate Change" (PDF). Ministry of Nature Protection. 2015. p. 3. Archived (PDF) from the original on 23 October 2016. Retrieved 23 October 2016.
- ^ "Hottest Day on Record – 43.7 Celsius". Hetq Online. 3 August 2011. Archived from the original on 24 October 2016. Retrieved 23 October 2016.
- ^ Jessica Blunden; Derek Arndt (2019). "State of the Climate in 2018". Bulletin of the American Meteorological Society. 100 (9): Si-S306. doi:10.1175/2019BAMSStateoftheClimate.1. hdl:11603/24308. S2CID 202481135. Retrieved 4 November 2021.
- ^ "Neuer Hitze-Rekord: 40,5 °C in Bad Deutsch-Altenburg". ZAMG. 9 August 2013. Archived from the original on 10 August 2013. Retrieved 9 August 2013.
- ^ "Zo uitzonderlijk was het gisteren: 41,8 graden in Begijnendijk" (in Dutch). VRTNWS. Archived from the original on 26 July 2019. Retrieved 25 July 2019.
- ^ "Federal Hydrometeorological Institute". Archived from the original on 9 October 2016. Retrieved 28 July 2016.
- ^ a b "C'est officiel : on a atteint les 46 °C en France en juin" (in French). Météo France. Archived from the original on 21 July 2019. Retrieved 19 July 2019.
- ^ a b "Bulgaria Second National Communication" (PDF). Archived (PDF) from the original on 25 July 2010. Retrieved 20 August 2010.
- ^ "Croatia Sixth National Communication" (PDF). Archived (PDF) from the original on 21 September 2016. Retrieved 19 July 2016.
- ^ "Ιστορική θερμοκρασιακή καταγραφή - Καταρρίφθηκε το παγκύπριο ρεκόρ των 45.6 βαθμών Κελσίου". Kitasweather. 7 September 2020.
- ^ a b "Česká republika – Česká nej". atlasceska.cz. Archived from the original on 20 September 2012. Retrieved 20 August 2012.
- ^ a b "Vejrekstremer i Danmark" (in Danish). Danish Meteorological Institute. Archived from the original on 26 April 2017. Retrieved 25 April 2017.
- ^ a b "Weather records". Estonian Weather Services. Archived from the original on 18 October 2016. Retrieved 28 September 2016.
- ^ a b "Lämpötilaennätyksiä" (in Finnish). Finnish Meteorological Institute. Archived from the original on 7 November 2017. Retrieved 3 January 2017.
- ^ "DWD-Stationen Duisburg-Baerl und Tönisvorst jetzt Spitzenreiter mit 41,2 Grad Celsius". www.dwd.de (in German). 17 December 2020. Retrieved 4 January 2021.
- ^ a b c d e f g h i "Global Weather & Climate Extremes". World Meteorological Organisation. Archived from the original on 4 January 2013. Retrieved 2 January 2019.
- ^ a b "Website of the Hungarian Meteorological Service". Met.hu. Archived from the original on 1 July 2015. Retrieved 7 August 2015.
- ^ a b Einarsson, Markús. Climate of Iceland Archived 24 July 2011 at the Wayback Machine pg 683. Retrieved 29 April 2009.
- ^ Heat Wave Hits Iceland, New Records Set Archived 29 June 2009 at the Wayback Machine Iceland Review 31 July 2008. Retrieved 29 April 2009.
- ^ a b "Temperature – Climate – Met Éireann – The Irish Meteorological Service Online". Met.ie. 2 January 1979. Archived from the original on 23 July 2011. Retrieved 20 August 2010.
- ^ "WMO is monitoring potential new temperature records". public.wmo.int. 17 July 2023. Retrieved 17 July 2023.
- ^ a b LVGMC Twitter account Archived 19 August 2014 at the Wayback Machine. Latvian Environment, Geology and Meteorology Centre. Retrieved 4 August 2014. (in Latvian)
- ^ "papildināts (17:24) - Gaisa temperatūra Latvijā pirmo reizi pārsniegusi +37 grādus". Diena.lv. 4 August 2014. Archived from the original on 6 August 2014. Retrieved 4 August 2014. (in Latvian)
- ^ "Wild Weather Around the World | Weather Extremes". Weather Underground. Retrieved 18 July 2022.
- ^ "Germany Breaks its All-Time Heat Record | Category 6". Weather Underground. Retrieved 18 July 2022.
- ^ a b "(Meteorologiniai rekordai Lietuvoje)" (in Lithuanian). Lithuanian Hydrometeorological Service. Archived from the original on 2 October 2016. Retrieved 28 September 2016.
- ^ "40,8 °C: Neuer offizieller Temperaturrekord in Luxemburg" (in German). AgriMeteo. 25 July 2019. Archived from the original on 26 July 2019. Retrieved 25 July 2019.
- ^ "40,8 °C: Neuer offizieller Temperaturrekord in Luxemburg" (in German). Ministerium für Landwirtschaft, Weinbau und ländliche Entwicklung. 26 July 2019. Retrieved 13 August 2023.
- ^ a b "The Second Communication of Malta to the United Nations Framework Convention on Climate Xhange" (PDF). Ministry of Resources and Rural Affairs. May 2010. pp. 40–41. Archived (PDF) from the original on 5 March 2017. Retrieved 24 October 2016.
- ^ a b Galdies, Charles (2011). "The Climate of Malta: statistics, trends, and analysis 1951–2010" (PDF). National Statistics Office. pp. 6–7. Archived (PDF) from the original on 5 April 2016. Retrieved 26 February 2013.
- ^ a b "Recorduri meteorologice în Republica Moldova" (in Romanian). Serviciul Hidrometeorologic de Stat. Archived from the original on 20 March 2017. Retrieved 25 October 2016.
- ^ Masters, Jeff (12 January 2023). "2022: Earth's 5th- or 6th-warmest year on record » Yale Climate Connections". Yale Climate Connections. Retrieved 4 December 2023.
- ^ Masters, Jeff. "2012: Earth's 10th warmest year on record, and warmest with a La Niña". Weather Underground. Archived from the original on 17 January 2013. Retrieved 17 January 2013.
- ^ "Het was dus wel 42,9 graden, waar kwam die mysterieuze hitte in Deelen vandaan?" (in Dutch). Algemeen Dagblad. 3 December 2019. Retrieved 5 December 2019.
- ^ "'Heel, heel, heel uitzonderlijk': 40+ gemeten in vijf provincies". nos.nl. 25 July 2019.
- ^ "Second National Communication on Climate Change" (PDF). Ministry of Environment and Physical Planning. December 2008. p. 24. Archived from the original (PDF) on 24 November 2016. Retrieved 23 November 2016.
- ^ a b "Klima". met.no. Archived from the original on 29 November 2007. Retrieved 20 August 2010.
- ^ "Polskie Rekordy". MeteoModel.pl. 31 May 2011. Archived from the original on 13 April 2019. Retrieved 12 February 2016.
- ^ a b "Rekordy klimatyczne w Polsce". Klimat.Geo.UJ.edu.pl (in Polish). Zakład Klimatologii – Uniwersytet Jagielloński, Kraków. Archived from the original on 29 May 2010. Retrieved 20 August 2010.
- ^ Extremes Archived 21 June 2017 at the Wayback Machine Instituto Português do Mar e da Atmosfera, IPMA
- ^ THERMAL EXTREMES Archived 9 September 2008 at the Wayback Machine Administratiei Nationale de Meteorologie
- ^ "Погода и Климат – В России установлен новый абсолютный температурный максимум". Pogoda.ru.net. Archived from the original on 16 July 2011. Retrieved 28 January 2011.
- ^ "TEMPERATURE REGIME IN SERBIA, Republic Hydrometeorological Service of Serbia". Hidmet.gov.rs. Archived from the original on 26 August 2012. Retrieved 4 September 2012.
- ^ a b "Historical Extremes: Review of historical extremes (extreme values) of selected meteorological elements at the territory of Slovak republic". Slovak Hydrometeorological Institute. Archived from the original on 14 October 2016. Retrieved 9 October 2016.
- ^ "V Cerkljah ob Krki namerili rekordnih 40,8 stopinje Celzija" (in Slovenian). 24ur.com. Archived from the original on 8 August 2013. Retrieved 8 August 2013.
- ^ "14 de agosto de 2021,se batió el récord de temperatura más alta registrada en España" (in Spanish). Agencia Estatal de Meteorología. 2 August 2022. Retrieved 2 August 2022.
- ^ a b "Svenska temperaturrekord". Sveriges meteorologiska och hydrologiska institut. Archived from the original on 15 August 2017. Retrieved 15 August 2017.
- ^ a b "Records Suisse". MeteoSwiss. Archived from the original on 16 August 2016. Retrieved 25 July 2016.
- ^ a b Кліматичні рекорди (in Ukrainian). Central Observatory for Geophysics. Archived from the original on 4 August 2016. Retrieved 4 August 2016.
- ^ Andersson, Jasmine; Faulkner, Doug (19 July 2022). "UK heatwave sees temperatures above 40C for first time". BBC. Retrieved 19 July 2022.
- ^ Masters, Jeff (12 January 2023). "2022: Earth's 5th- or 6th-warmest year on record » Yale Climate Connections". Yale Climate Connections. Retrieved 4 December 2023.
- ^ a b Masters, Jeff (27 January 2016). "Sixteen National/Territorial All-Time Extreme Heat Records Set in 2015". Wunderground. Archived from the original on 4 February 2018. Retrieved 19 July 2017.
- ^ a b "Our Climate". Antigua and Barbuda Meteorological Service. Archived from the original on 5 March 2017. Retrieved 30 October 2016.
- ^ a b "Normal Daily Temperature: TEMPERATURE AT V.C. Bird International Airport". Antigua and Barbuda Meteorological Service. Archived from the original on 31 October 2016. Retrieved 30 October 2016.
- ^ a b c d e f g Masters, Jeff; Henson, Bob (18 January 2017). "Confirmed: 2016 the Warmest Year in History of Global Recordkeeping". Wunderground. Archived from the original on 7 May 2018. Retrieved 7 May 2018.
- ^ @ECCCWeatherBC (29 June 2021). "At 4:20pm, Lytton Climate Station reported 49.5 °C, once again, breaking the daily and all-time temperature records for the 3rd straight day. Final numbers and all other temperature records will be posted later this afternoon. #BCStorm" (Tweet) – via Twitter.
- ^ Zeidler, Maryse (27 June 2021). "B.C. heat wave shatters Canadian record for highest temperature ever recorded". CBC News. Retrieved 27 June 2021.
- ^ a b Samenow, Jason (30 June 2021). "'Hard to comprehend': Experts react to record 121 degrees in Canada". Washington Post. Archived from the original on 30 June 2021. Retrieved 4 July 2021.
- ^ a b Hopper, Tristin (2 July 2021). "Literally hotter than the Sahara: How Western Canada became one of the hottest corners of the globe". National Post. Archived from the original on 3 July 2021. Retrieved 4 July 2021.
- ^ a b "State of the Global Climate 2021 WMO Provisional report". World Meteorological Organization. Retrieved 4 November 2021.
- ^ "State of the Global Climate 2020". World Meteorological Organization. Retrieved 5 November 2021.
- ^ Mejía, Mariela (7 January 2011). "Frío extremo, calor agobiante" (in Spanish). Diario Libre. Archived from the original on 4 November 2013. Retrieved 2 May 2017.
- ^ "Greenland witnessed its highest June temperature ever recorded on Thursday". The Washington Post. 10 June 2016. Archived from the original on 19 May 2019. Retrieved 22 February 2019.
- ^ "Greenland -Dnk- - Ivigtut". Pendientedemigracion.ucm.es. Archived from the original on 26 January 2016. Retrieved 22 February 2019.
- ^ "More record lows since 1937 than record highs". Iceagenow.info. 27 June 2017. Archived from the original on 5 October 2018. Retrieved 22 February 2019.
- ^ a b "Datos metorologicos de los departamentos" (in Spanish). INSIVUMEH. Archived from the original on 15 October 2011. Retrieved 26 October 2011.
- ^ "Sube la temperatura media" (in Spanish). 21 May 2016. Retrieved 19 July 2022.
- ^ a b "Le climat en Martinique" (in French). Météo-France. Archived from the original on 1 January 2019. Retrieved 31 December 2018.
- ^ Christopher Burt. "Early Summer Heat Broils Northern Hemisphere". Archived from the original on 19 March 2018. Retrieved 19 March 2018.
- ^ García Cueto, O.R.; Santillán Soto, N.; Quintero Núñez, M.; Ojeda Benítez, S.; Velázquez Limón, N. (October 2013). "Extreme temperature scenarios in Mexicali, Mexico under climate change conditions". Atmósfera. 26 (4): 509–520. Bibcode:2013Atmo...26..509G. doi:10.1016/S0187-6236(13)71092-0.
- ^ a b "Extreme Temperatures". Empresa de Transmisión Eléctrica S.A. Archived from the original on 31 October 2016. Retrieved 30 October 2016.
- ^ a b c d e "All Time Extremes for PR and VI". National Weather Service. Archived from the original on 19 January 2017. Retrieved 19 January 2017.
- ^ World: Highest Temperature Archived 4 January 2013 at the Wayback Machine World Meteorological Organization. Retrieved 13 September 2012.
- ^ Global Measured Extremes of Temperature and Precipitation. Archived 25 May 2012 at archive.today National Climatic Data Center. Retrieved 13 August 2023
- ^ "Australian Temperature Extremes" (PDF). Bureau of Meteorology. 1 April 2009. Archived (PDF) from the original on 10 November 2010. Retrieved 13 August 2023.
- ^ "50.5 °C – W.A.'s Highest Ever Temperature". Bureau of Meteorology. 20 February 1998. Archived from the original on 6 July 2011. Retrieved 13 August 2023.
- ^ "Australia matches its hottest day on record as Western Australia town goes above 50C". The Guardian. 13 January 2022. Retrieved 13 August 2023.
- ^ Birch, Laura (13 January 2022). "Onslow in the Pilbara reaches 50.7C, equalling Australia's hottest day on record". ABC News. Retrieved 13 August 2023.
- ^ "Australia equals hottest day on record at 50.7C". BBC News. 13 January 2022. Retrieved 13 August 2023.
- ^ "Carl Walrond. 'Natural environment', Te Ara – the Encyclopedia of New Zealand, updated 25-Sep-2007". Teara.govt.nz. Archived from the original on 16 August 2009. Retrieved 20 August 2010.
- ^ Masters, Jeff (18 April 2018). "March 2018: Earth's 5th Warmest March on Record". Wunderground. Archived from the original on 30 April 2018. Retrieved 29 April 2018.
- ^ a b "Environmental and Social Management Framework for the Samoa Agriculture Competitiveness Enhancement Project" (PDF). World Bank. 2 December 2011. p. 53. Archived from the original (PDF) on 5 November 2016. Retrieved 5 November 2016.
- ^ Global Measured Extremes of Temperature and Precipitation. Archived 25 May 2012 at archive.today National Climatic Data Center. Retrieved 21 June 2007.
- ^ "Continental Weather & Climate Extremes: Based on World Meteorological Organization Defined Regions". World Meteorological Organization. Archived from the original on 2 October 2015. Retrieved 17 October 2015.
- ^ The record of 49.1 °C (120.4 °F) in Villa de María, Córdoba Province, Argentina, on 2 January 1920, is disputed and considered dubious"Servicio Meteorólogico Nacional (Argentina)". Archived from the original on 24 September 2015. Retrieved 31 March 2014.
- ^ "Calor de 44,8 °C: Araçuaí (MG) tem o dia mais quente no histórico de medições do Brasil, diz Inmet". G1. 20 November 2023. Retrieved 20 November 2023.
- ^ "En Bío Bío se registró temperatura máxima de la historia de Chile" (in Spanish). Biobiochile.cl. 27 January 2017. Archived from the original on 15 June 2017. Retrieved 19 June 2017.
- ^ "Quillón tuvo hoy la temperatura más alta de la historia de Chile: 44.9 grados a la sombra". The Clinic. 26 January 2017. Archived from the original on 2 February 2017. Retrieved 15 June 2017.
- ^ "Informe Técnico Diario N°364". IDEAM. 30 December 2015. Archived from the original on 29 January 2016. Retrieved 15 January 2016.
- ^ Masters, Jeff (12 January 2023). "2022: Earth's 5th- or 6th-warmest year on record » Yale Climate Connections". Yale Climate Connections. Retrieved 4 December 2023.
- ^ Masters, Jeff (15 November 2023). "Last month was by far the world's hottest October on record » Yale Climate Connections". Yale Climate Connections. Retrieved 4 December 2023.
- ^ a b "Clima del Uruguay" (in Spanish). Red Académica Uruguaya. Archived from the original on 13 December 2016. Retrieved 13 December 2016.
- ^ a b "Boletín meteorológico" [Meteorologic records of Uruguay] (in Spanish). Dirección Nacional de Meteorología. Archived from the original on 6 December 2010. Retrieved 1 October 2010.
- ^ diaria, la (14 January 2022). "Ola de calor: Florida registró un récord histórico de temperatura". la diaria (in Spanish). Retrieved 16 January 2022.
- ^ "Marble Bar heatwave, 1923–1924". Australian Climate Extremes. Bureau of Meteorology. Archived from the original on 17 March 2009. Retrieved 21 September 2008.
- ^ "Weather and Climate Death Valley National Park" (PDF). U.S. National Park Service. July 2007. Archived (PDF) from the original on 27 March 2009. Retrieved 16 April 2009.
- ^ "The world's hottest rain fell in California, setting new world record". Newsweek. 5 August 2018. Retrieved 28 December 2019.
- ^ Masters, Jeff (21 June 2017). "A World Record Low Humidity? 116 °F With a 0.36% Humidity in Iran". Wunderground. Archived from the original on 12 June 2018. Retrieved 31 July 2018.
- ^ "July Daily Normals And Records" (PDF). The Death Valley Climate Book. National Weather Service. Archived (PDF) from the original on 15 July 2017. Retrieved 26 March 2017.
- ^ Burt, Christopher (13 July 2018). "Heat Records Falling Around the World in 2018". Wunderground. Archived from the original on 17 July 2018. Retrieved 31 July 2018.
- ^ Ian, Livingston. "Death Valley Sets New Global Record for Hottest Single Month". Wunderground. Archived from the original on 1 May 2018. Retrieved 1 May 2018.
- ^ Fritz, Angela (7 August 2017). "Death Valley just experienced the hottest month ever recorded on Earth". The Washington Post. Archived from the original on 1 May 2018. Retrieved 1 May 2018.
- ^ a b c "WMO verifies -69.6 °C Greenland temperature as Northern hemisphere record". World Meteorological Organization. 22 September 2020. Archived from the original on 18 December 2023. Retrieved 23 September 2020.
- ^ Sinclare, Terry (22 June 2020). "A small town in Siberia has likely broken the Arctic high temperature record". Webcenter11. Gray Television, Inc. Archived from the original on 26 June 2020. Retrieved 22 June 2020.
- ^ "Arctic Temperatures Hit Record High in Russia Amid Heat Wave". The Moscow Times. 22 June 2020. Retrieved 22 June 2020.
- ^ a b "Greatest temperature range on Earth". Guinness World Records. Retrieved 19 April 2020.
- ^ a b "Iranian city soars to record 129 degrees: Near hottest on Earth in modern measurements". Washington Post. Archived from the original on 2 July 2017. Retrieved 3 July 2017.
- ^ "Iran city hits suffocating heat index of 165 degrees, near world record". Klean Industries. 4 August 2015. Retrieved 25 August 2020.
- ^ "Seconde Communication Nationale de L'Algerie Sur Les Changements Climatiques a la CCNUCC" (PDF) (in French). Ministere de L'Amenagement du Territoire et de L'Environnement. 2010. p. 27. Archived (PDF) from the original on 5 March 2017. Retrieved 23 October 2016.
- ^ "St. Katrine Climate Normals 1961-1990". National Oceanic and Atmospheric Administration. Retrieved 26 January 2023.
- ^ "Global Surface Summary of the Day - GSOD". National Oceanic and Atmospheric Administration. Retrieved 26 January 2023.
- ^ "Botswana's Climate". Meteorological Services Botswana. Archived from the original on 3 December 2008. Retrieved 19 April 2020.
- ^ "Climatology". Ghana Meteorological Services Department. Archived from the original on 11 October 2008. Retrieved 31 December 2018.
- ^ "Quelques Records en Guinée" (in French). Météorologie Nationale, République de Guinée. Archived from the original on 9 January 2007. Retrieved 31 December 2018.
- ^ "Lesotho – National report on climate change" (PDF). Ministry of Natural Resources. April 2000. Archived (PDF) from the original on 4 March 2016. Retrieved 25 December 2016.
- ^ "WMO Region I (Africa): Lowest Temperature". World Meteorological Organization. Archived from the original on 26 December 2016. Retrieved 25 December 2016.
- ^ "New minimum temperature record for South Africa". Archived from the original on 14 July 2014. Retrieved 12 June 2014.
- ^ "Canarias a 15 grados bajo cero: las insólitas cifras del histórico temporal". El Español (in Spanish). 31 January 2018. Retrieved 22 July 2022.
- ^ "Sudan". Country Pasture/Forage Resource Profiles. Food and Agriculture Organization. Archived from the original on 16 October 2016. Retrieved 22 October 2016.
- ^ a b c d e f g h Lyons, Walter A (1997). The Handy Weather Answer Book (2nd ed.). Detroit, Michigan: Visible Ink press. ISBN 978-0-7876-1034-0.
- ^ Budretsky, A.B. (1984). "New absolute minimum of air temperature". Bulletin of the Soviet Antarctic Expedition (in Russian) (105). Leningrad: Gidrometeoizdat. Archived from the original on 27 February 2009. Retrieved 11 May 2008.
- ^ Mahmudov, Rza. "Water Resources of the Azerbaijan Republic". Ministry of Ecology and Natural Resources of Azerbaijan Republic. Archived from the original on 24 May 2007. Retrieved 27 November 2016.
- ^ "Dinajpur district map". Archived from the original on 13 July 2011. Retrieved 8 December 2020.
- ^ "Climate". en.chinaculture.org. Retrieved 19 December 2018.
- ^ "China just saw its coldest temperature on record: Minus-63 degrees". The Washington Post. 23 January 2023. Retrieved 25 January 2023.
- ^ "China's northernmost city just saw its coldest day ever". CNN Travel. 24 January 2023. Retrieved 25 January 2023.
- ^ Sisovann, Pin; Kinetz, Erika (29 January 2007). "Cambodia Sees Record Low Temperatures Reach Record Lows History". The Cambodia Daily. Archived from the original on 7 July 2019. Retrieved 19 April 2020.
- ^ "Climate of Jammu and Kashmir" (PDF). p. 86. Retrieved 8 December 2020.
- ^ Zain, Fadlan Mukhtar (24 June 2019). Belarminus, Robertus (ed.). "Pagi Ini Suhu Dieng Mencapai Minus 9 Derajat Celsius, Embun Es Muncul sejak Malam" (in Indonesian). Kompas. Retrieved 2 May 2021.
- ^ "رکورد گرمترین و سردترین نقطه ایران مربوط به کی و کجاست؟ / ثبت دمای بالای 71 درجه تا 46 درجه زیر صفر". danakhabar.com. Archived from the original on 19 March 2016. Retrieved 22 March 2016.
- ^ Judah Ari Gross, "Golan sees record low temperatures during storm" Archived 30 June 2016 at the Wayback Machine, The Times of Israel, 12 January 2015.
- ^ "Climate History". Kuwait Meteorological Department. Archived from the original on 13 February 2019. Retrieved 13 February 2019.
- ^ "Weather Data: Kuwait, Salmy, 2009, January". geographic.org. Retrieved 27 June 2020.
- ^ "Country profile". mineconom.gov.kg. Ministry of Economy of the Kyrgyz Republic. Archived from the original on 20 December 2016. Retrieved 13 January 2017.
- ^ "Climate details in Lebanon". 26 July 2023. Retrieved 27 July 2023.
- ^ "Climate of Maldives". Maldives Meteorological Service. Archived from the original on 27 November 2016. Retrieved 22 October 2016.
- ^ "Mongolia Third National Communication" (PDF). Ministry of Environment and Tourism. Archived from the original (PDF) on 15 October 2018. Retrieved 14 October 2018.
- ^ Cho, Myo. "High of 40C, low of 13C in Yangon for 2003". Government of Myanmar. Archived from the original on 27 September 2007. Retrieved 23 October 2016.
- ^ 선종일 (1 August 1942). "Korean Climate". User.chollian.net. Archived from the original on 29 December 2011. Retrieved 29 January 2012.
- ^ "Snow blankets Jabel Shams in Oman". Oman Daily Observer. 24 January 2023. Retrieved 13 August 2023.
- ^ Hamayoon Janjua (30 January 2019). "Pakistan Climate". crayon.pk. Archived from the original on 30 January 2019. Retrieved 11 May 2018.
- ^ Luces, Kim (31 January 2014). "'Abnormally cold' temperatures recorded in January". GMA News. Archived from the original on 2 April 2015. Retrieved 2 March 2015.
However, these are nothing compared to the all-time lowest temperature ever felt in Baguio City and in the Philippines – the 6.3-degree cold felt on January 18, 1961.
- ^ Dumlao, Artemio (29 December 2013). "Mt. Pulag freezes below zero". Philippine Daily Inquirer. Archived from the original on 1 August 2019. Retrieved 1 August 2019.
- ^ "Northern Hemisphere: Lowest Temperature". World Meteorological Organization. Archived from the original on 26 December 2016. Retrieved 25 December 2016.
- ^ "Second National Communication" (PDF). Kingdom of Saudi Arabia. p. 2. Archived (PDF) from the original on 24 October 2016. Retrieved 24 October 2016.
- ^ "Climate of Korea". Korea Meteorological Administration. Archived from the original on 1 July 2012. Retrieved 24 July 2010.
- ^ "Station Nuwara Eliya" (in French). Meteo Climat. Retrieved 26 August 2021.
- ^ "أبرد شتاء مر على سوريا منذ عام 1950 !". طقس سوريا – طقس العرب. Archived from the original on 6 October 2016. Retrieved 27 December 2016.
- ^ "世界最低溫是幾度? 臺灣最低溫是幾度?" (in Chinese). Central Weather Bureau. 25 October 2021. Retrieved 5 November 2021.
- ^ "The Climate". Yushan National Park. Archived from the original on 22 April 2018. Retrieved 22 April 2018.
- ^ "The Climate of Thailand" (PDF). Thai Meteorological Department. Archived (PDF) from the original on 1 August 2016. Retrieved 31 July 2016.
- ^ "Vì sao miền Bắc lạnh bất thường?" (in Vietnamese). Vietnam Institute of Meteorology and Hydrology. Archived from the original on 12 March 2012. Retrieved 13 October 2016.
- ^ "BULETINI MUJOR KLIMATIK" (PDF). www.geo.edu.al. Archived from the original (PDF) on 8 July 2021. Retrieved 22 July 2022.
- ^ "TEMPERATURE COMPARISON BETWEEN SOME ALPINE DOLINES IN WINTER TIME" (PDF). Archived (PDF) from the original on 12 November 2013. Retrieved 2 August 2013.
- ^ Baglasov Andrey; Belov Alexandr; Sinitsa Valentina; Bychenkov Alexandr. "Department of Hydrometeorology". Pogoda.by. Archived from the original on 22 August 2010. Retrieved 20 August 2010.
- ^ "KMI (Belgian Royal Meteorological Institute) site". Kmi.be. Archived from the original on 24 March 2012. Retrieved 29 January 2012.
- ^ "Interview with the Federal Hydrometeorological Institute of BiH". Klix.ba. Archived from the original on 8 January 2017. Retrieved 8 January 2017.
- ^ a b "Najniže izmjerene temperature zraka u Hrvatskoj za razdoblje od kada postoje mjerenja" (in Croatian). Croatian Meteorological and Hydrological Service. Retrieved 11 December 2019.
- ^ "Αυτή είναι η χαμηλότερη θερμοκρασία που καταγράφηκε ποτέ στην Κύπρο!". Newsbomb. Archived from the original on 28 January 2016. Retrieved 7 September 2020.
- ^ Geographic.org. "Weather Data: Finland, Kittila Pokka, 1999, January". Retrieved 25 July 2020.
- ^ "MétéoFrance". Comprendre.meteofrance.com. Archived from the original on 13 May 2009. Retrieved 29 January 2012.
- ^ Andreas Wagner (August 2009). "Wetterextreme (Temperaturspanne von bis zu 146,5 °C)". MeteoGroup. Archived from the original on 31 August 2014. Retrieved 11 August 2014.
- ^ "The Meteorologist's book" (PDF). HNMS. Retrieved 22 July 2020.
- ^ "Record di freddo in Italia: -49.6 °C sulle Pale di San Martino". 10 May 2013.
- ^ "Normal- und Extremwerte" (in German). Meteolux. Retrieved 13 August 2023.
- ^ |url=https://web.archive.org/web/20230815143830/https://donneespubliques.meteofrance.fr/FichesClim/FICHECLIM_99138001.pdf
- ^ "Recordkoude februari van 1956". KNMI.nl.
- ^ "Климатски екстреми" (in Macedonian). Hydrometeorological Service. Archived from the original on 19 August 2007. Retrieved 4 February 2010.
- ^ "Terras da Beira – "Reveillon" português sem chuva, mas a bater o dente de frio" (in Portuguese). 27 March 2014. Archived from the original on 12 August 2010. Retrieved 31 March 2014.
- ^ infoTURIST (25 January 1942). "Romania". Infoturist.ro. Archived from the original on 23 August 2010. Retrieved 20 August 2010.
- ^ "Minus trideset za početak". arhiva.vesti-online. November 2015.
- ^ "Slovenski vremenski rekordi" (PDF) (in Slovenian). Slovenian Environment Agency. p. 2. Archived from the original (PDF) on 4 March 2016. Retrieved 22 October 2016.
- ^ "El récord de frío de -34º C no será reconocido por la agencia de meteorología". La Vanguardia (in Spanish). 8 January 2021. Retrieved 16 August 2021.
- ^ "Погодные рекорды Украины | Новости Украины | СЕГОДНЯ". Segodnya.ua. Archived from the original on 1 August 2009. Retrieved 20 August 2010.
- ^ "UK climate – Extremes". Met Office. Archived from the original on 21 December 2016. Retrieved 25 December 2016.
- ^ "WMO Region IV (North America): Lowest Temperature". World Meteorological Organization. Archived from the original on 1 November 2016. Retrieved 31 October 2016.
- ^ "Climate". National Weather Service (Cayman Islands Government). Archived from the original on 31 October 2016. Retrieved 30 October 2016.
- ^ "III Congreso Cubano de Meteorología" [Third Cuban Congress of Meteorology] (PDF) (in Spanish). ACQ & Asociados. p. 36. Archived (PDF) from the original on 6 May 2012. Retrieved 27 October 2011.
Desde el punto de vista sinóptico, se realizó un estudio del día 18 de febrero de 1996, cuando se registraron temperaturas notablemente frías en la región occidental, y muy frías en el resto del país. Ese día, en la estación meteorológica de Bainoa se registró el record nacional de 0.6 °C.
- ^ Cassá Bernaldo de Quirós, Constancio (July 2012). "Valle Nuevo: su historia y naturaleza" (PDF). Clío (in Spanish) (184). Academia Dominicana de la Historia: 222. Archived from the original (PDF) on 16 February 2015. Retrieved 29 January 2015.
- ^ "¡Bajo cero! Ésta es la temperatura más baja registrada en la historia de México". Milenio. 29 January 2022. Archived from the original on 21 April 2022. Retrieved 20 April 2022.
- ^ "National Climate Extremes Committee: Existing Records". National Climatic Data Center. Archived from the original on 26 December 2016. Retrieved 25 December 2016.
- ^ "Top Ten Montana Weather Events of the 20th Century". National Weather Service Unveils Montana's Top Ten Weather/Water/Climate Events of the 20th Century. National Weather Service. Archived from the original on 13 March 2013. Retrieved 9 March 2007.
- ^ "World Meteorological Organization Global Weather & Climate Extremes Archive". Arizona State University. Archived from the original on 18 June 2015. Retrieved 7 June 2015.
- ^ "História de Caçador" [Quarta-feira pode ter recorde de temperatura mínima neste ano em Santa Catarina] (in Portuguese). A Notícia. 2010. Archived from the original on 29 June 2011. Retrieved 22 December 2010.
Caçador has the lowest recorded temperature, officially, in Brazil, of −14 °C in 1952. Another record, unofficial, of −17.8 °C in 1996-06-29, at the summit of Morro da Igreja, Urubici, also in Santa Catarina, would give the record to this locality.
- ^ "Recordes de Frio em SC". Archived from the original on 15 February 2019. Retrieved 17 October 2014.
- ^ "¿Sobrevivirías a -28,5°Celsius? Conoce los récords de frío en Chile". 26 May 2021. Retrieved 12 July 2022.
- ^ "Promedios 71-00" (in Spanish). IDEAM. Archived from the original on 17 October 2015. Retrieved 18 October 2011.
- ^ "Koud op Curaçao". www.antilliaansdagblad.com (in Dutch). 12 December 2017. Retrieved 7 January 2021.
- ^ "Le Climat Guyanais" (in French). Météo-France. Archived from the original on 1 January 2019. Retrieved 31 December 2018.
- ^ (in Spanish) Con 1,2 grados bajo cero en Asunción, la ola polar llegó para quedarse Archived 2 January 2013 at the Wayback Machine, La Nación. Retrieved 12 February 2012.
- ^ Programa de Capacitación Para la Estimación del Riesgo Archived 25 July 2011 at the Wayback Machine, Biblioteca Virtual en Prevención y Atención de Desastres (BVPAD). Retrieved 30 August 2009.
- ^ "Australian Temperature Extremes" (PDF). Bureau of Meteorology. 1 April 2009. Archived (PDF) from the original on 10 November 2010. Retrieved 16 December 2009.
- ^ "1301.0 – Year Book Australia, 2008". Australian Bureau of Statistics. 7 February 2008. Retrieved 30 April 2008.
- ^ "State Climate Extremes Committee (SCEC): Records by State". National Climatic Data Center. Archived from the original on 21 February 2018. Retrieved 21 February 2018.
- ^ "New record for New Zealand's coldest day". TVNZ. 12 July 2011. Archived from the original on 15 July 2011. Retrieved 12 July 2011.
- ^ "Rennell record lowest temperature - Ministry of Environment, Climate Change and Disaster Management".
- ^ "*Impressive cold in Greenland and near record accumulations of snow and ice". vencore weather. 6 July 2017. Archived from the original on 29 July 2017. Retrieved 29 July 2017.
- ^ "A NATIONAL TEMPERATURE RECORD AT LOMA, MONTANA" (PDF).
- ^ "Установлена в честь 120-летия регистраций абсолютного минимума температуры в Северном полушарии Земли" (JPG).
- ^ "Погода в Верхоянске. Температура воздуха и осадки. Февраль 1892 г." pogodaiklimat.ru (in Russian). Retrieved 19 April 2020.
- ^ "Погода в Верхоянске. Температура воздуха и осадки. Июль 1988 г." pogodaiklimat.ru (in Russian). Retrieved 19 April 2020.
- ^ Christopher C. Burt. "Time to Update World's Driest and Wettest Locations?". Weather Underground. Archived from the original on 29 March 2013. Retrieved 10 June 2013.
- ^ Christopher C. Burt (8 September 2013). "World's greatest 1-minute Precipitation Record". Weather Underground. Archived from the original on 16 June 2020. Retrieved 4 May 2021.
- ^ a b Ch. Péguy (1970)
- ^ a b Sepúlveda, Sílvia Maria Ferreira. "Avaliação da Precipitação Extrema na Ilha da Madeira" (PDF). p. 19. Retrieved 28 August 2021.
- ^ Quetelard, Hubert; Bessemoulin, Pierre; Cerveny, Randall S.; Peterson, Thomas C.; Burton, Andrew; Boodhoo, Yadowsun (1 May 2009). "Extreme Weather: World-Record Rainfalls During Tropical Cyclone Gamede". Bulletin of the American Meteorological Society. 90 (5): 603–608. Bibcode:2009BAMS...90..603Q. doi:10.1175/2008BAMS2660.1. ISSN 0003-0007. S2CID 122555985.
- ^ "Précipitations extrêmes (report)". www.meteo.fr. Retrieved 17 December 2022.
- ^ Christopher Burt, New Wettest Place on Earth Discovered?, 18 March 2013
- ^ "Where It Rained for 331 Days in a Row in the U.S." The Weather Channel.
- ^ Fritz, Angela (11 March 2015). "World record? 100 inches of snow may have clobbered Italy in 18 hours, review pending". The Washington Post. Archived from the original on 31 December 2020. Retrieved 31 December 2020.
- ^ a b Burt, Christopher (2004), Extreme Weather: A Guide and Record Book, W.W. Norton & Co., p. 77, ISBN 978-0-393-32658-1
- ^ Frank H. Forrester, 1001 Questions Answered about the Weather (ISBN 0486242188), page 235: "The greatest amount of snowfall for a calendar month occurred at Tamarack, California, in January, 1911–390 inches."
- ^ "News". The Weather Channel. 10 February 2015. Archived from the original on 26 January 2016. Retrieved 18 January 2016.
- ^ Extreme Weather: A Guide and Record Book; Christopher Burt; 2007
- ^ "Answers archive: Winter, snow, ice". USA Today. Archived from the original on 8 October 2012.
- ^ Center for Severe Weather Research (2006). "Doppler On Wheels". Archived from the original on 5 February 2007. Retrieved 18 February 2007.
- ^ a b "World: Maximum Surface Wind Gust (3-Second)". World Meteorological Organization. Archived from the original on 30 December 2016. Retrieved 30 December 2016.
- ^ a b "Info note No. 58 – World Record Wind Gust: 408 km/h". World Meteorological Organization. 5 November 2015. Archived from the original on 18 December 2023. Retrieved 30 December 2016.
- ^ "Tornadoes in Bangladesh". Tornadoproject.com. Archived from the original on 19 September 2012. Retrieved 20 August 2010.
- ^ "Research: Tornado Extremes". TORRO. Archived from the original on 14 August 2007. Retrieved 20 August 2010.
- ^ "A 39 años del tornado en San Justo, el único F5 en toda Sudamérica y Latinoamérica". Uno Santa Fe. Archived from the original on 30 May 2019. Retrieved 18 March 2014.
- ^ National Climate Centre. "Australian Climate Extremes-Storm". BOM. Archived from the original on 17 March 2009. Retrieved 3 September 2012.
- ^ World: Largest tornado Outbreak Archived 26 September 2013 at the Wayback Machine at the World Meteorological Organization website
- ^ "Catastrophic Landfall Expected in Mexico Friday; Patricia Becomes Strongest Hurricane Ever Recorded". weather.com. Archived from the original on 23 October 2015. Retrieved 23 October 2015.
- ^ American Meteorological Society, Journal of Climate, 15 August 2014, A Reanalysis of the 1931–43 Atlantic Hurricane Database Archived 4 May 2017 at the Wayback Machine, Landsea et al., pg. 6114
- ^ Diamond, Howard (5 July 2017). "Southwest Pacific Enhanced Archive for Tropical Cyclones (SPEArTC)". Archived from the original on 18 June 2017. Retrieved 6 July 2017.
- ^ a b "Appendix I – Weather Extremes" (PDF). San Diego, California: National Weather Service. Archived from the original (PDF) on 28 May 2008. Retrieved 1 June 2010.
- ^ NWS (30 July 2010). "Record Setting Hail Event in Vivian, South Dakota on July 23, 2010". Aberdeen, South Dakota: National Weather Service. Archived from the original on 5 August 2010. Retrieved 3 August 2010.
- ^ "Largest Hailstone in U.S. History Found". National Geographic. Archived from the original on 20 April 2010. Retrieved 20 August 2010.
- ^ a b "Megaflash: Longest lightning flash ever breaks record". Guinness World Records. 14 February 2022. Retrieved 23 June 2023.
- ^ "Blazing World Record: Strongest UV Rays Measured in South America". LiveScience.com. 8 July 2014. Archived from the original on 4 July 2015. Retrieved 24 May 2015.
- ^ a b "World: Highest Sea Level Air Pressure Above 750 meters". Arizona State University. Archived from the original on 13 October 2012. Retrieved 7 October 2012.
- ^ a b "World: Highest Sea Level Air Pressure Below 750 meters". Arizona State University. Archived from the original on 13 October 2012. Retrieved 7 October 2012.
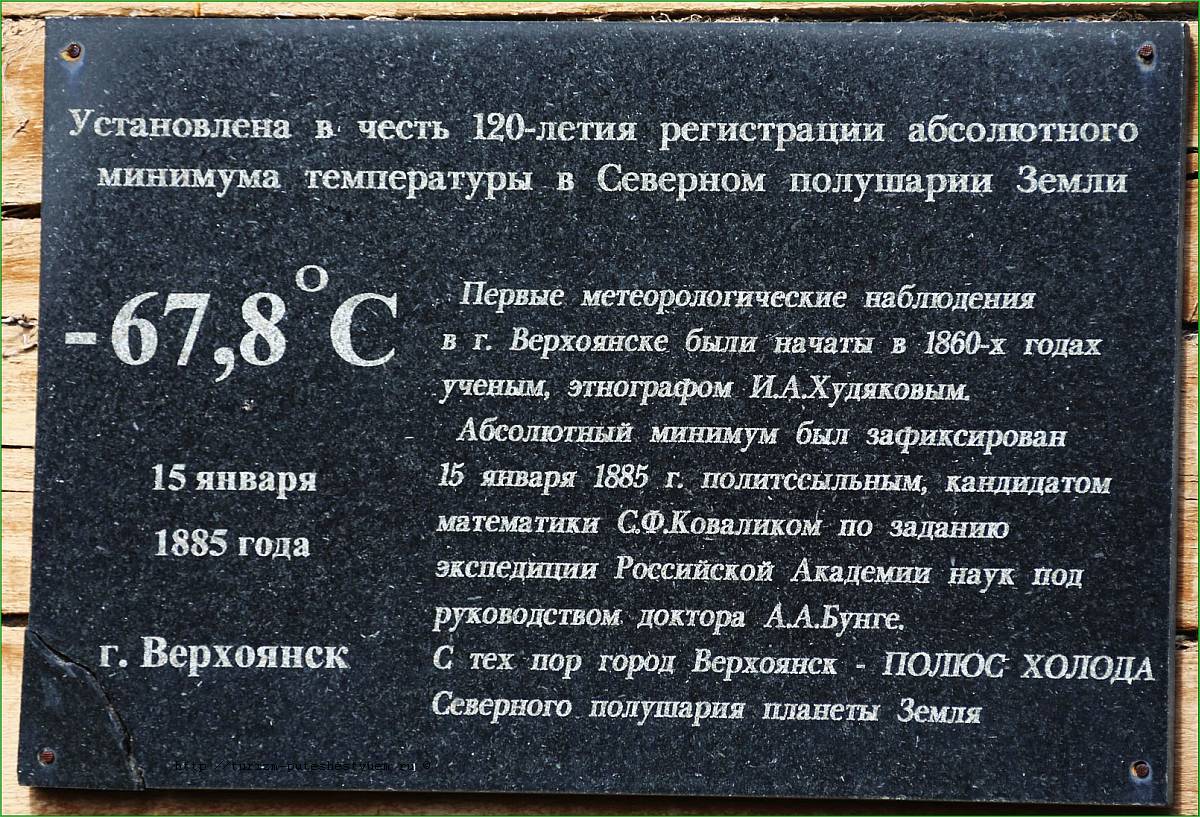
External links
- National Climate Extremes Committee Archived 29 August 2009 at the Wayback Machine
- Global Weather & Climate Extremes (Arizona State University)
- Weather and Climate Extremes from US Army Corps of Engineers