
In 2001, stock prices took a sharp downturn (some say "stock market crash" or "the Internet bubble bursting") in stock markets across the United States, Canada, Asia, and Europe. After recovering from lows reached following the September 11 attacks, indices slid steadily starting in March 2002, with dramatic declines in July and September leading to lows last reached in 1997 and 1998. The U.S. dollar increased in value relative to the euro, reaching a 1-to-1 valuation not seen since the euro's introduction.
YouTube Encyclopedic
-
1/5Views:3042 1811 6331 204 162571 024
-
October 9th - This Day in Stock Market History - 2002 Tech Bubble Low, 2007 Pre-Crisis Market High
-
The Stock Market Is Reliving The 2002 Tech Crash
-
FANG STOCKS ARE DEAD – 2002 Stock Market Crash All Over Again
-
"How To Make Millions In A Market Crash" — Peter Lynch
-
Is A Stock Market Crash an Overdue Reality Check? | Economics Explained
Transcription
Background
This downturn can be viewed as part of a larger bear market or correction that began in 2000 after a decade-long bull market had led to unusually high stock valuations, according to a report by the Cleveland Federal Reserve.[1] The collapse of Enron is a prime example. Many internet companies (Webvan, Exodus Communications, and Pets.com) went bankrupt. Others (Amazon.com, eBay, and Yahoo!) went down dramatically in value, but remain in business to this day and have generally good long-term growth prospects. An outbreak of accounting scandals, (Arthur Andersen, Adelphia, Enron, and WorldCom) was also a factor in the speed of the fall, as numerous large corporations were forced to restate earnings (or lack thereof) and investor confidence suffered. The September 11 attacks also contributed heavily to the stock market downturn, as investors became unsure about the prospect of terrorism affecting the United States economy.
The International Monetary Fund had expressed concern about instability in United States stock markets in the months leading up to the sharp downturn. The technology-heavy NASDAQ stock market peaked on March 10, 2000, hitting an intra-day high of 5,132.52 and closing at 5,048.62. The Dow Jones Industrial Average, a price-weighted average (adjusted for splits and dividends) of 30 large companies on the New York Stock Exchange, peaked on January 14, 2000, with an intra-day high of 11,750.28 and a closing price of 11,722.98. In 2001, the DJIA was largely unchanged overall but had reached a secondary peak of 11,337.92 (11,350.05 intra-day) on May 21.
The downturn may be viewed as a reversion to average stock market performance in a longer-term context. From 1987 to 1995, the Dow rose each year by about 10%, but from 1995 to 2000, the Dow rose 15% a year. While the bear market began in 2000, by July and August 2002, the index had only dropped to the same level it would have achieved if the 10% annual growth rate followed during 1987–1995 had continued up to 2002.
Seeking a bottom
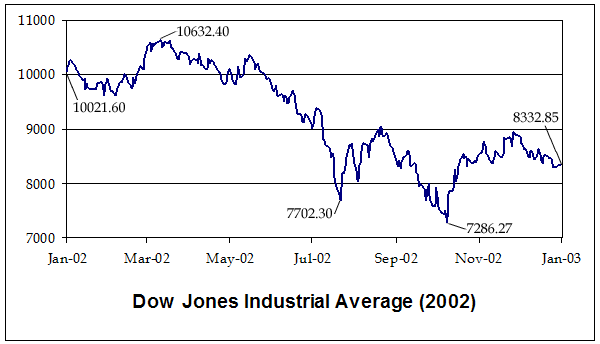
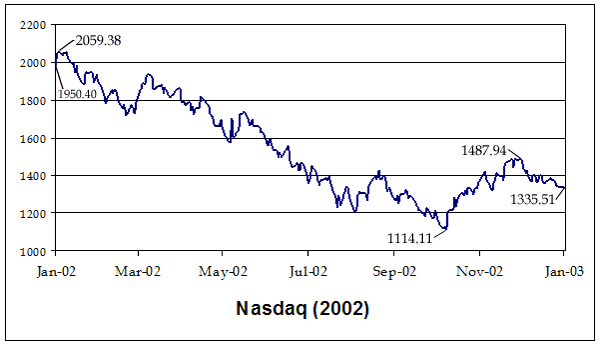
After falling for 11 of 12 consecutive days closing below Dow 8000 on July 23, 2002, the market rallied. The Dow rose 13% over the next four trading days, but then fell sharply again in early August. On August 5, the NASDAQ fell below its July 23 low. However, the markets rose sharply over the rest of the week, and eventually surpassed Dow 9000 during several trading sessions in late August. After that, the Dow dropped to a four-year low on September 24, 2002, while the NASDAQ reached a 6-year low. The markets continued their declines, breaking the September low to five-year lows on October 7 and reaching a bottom (below Dow 7200 and just above 1100 on the NASDAQ) on October 9. Stocks recovered slightly from their October lows to year-end, with the Dow remaining in the mid-8000s from November 2002 to mid-January 2003. The markets reached a final low below Dow 7500 in mid-March 2003.
Scale
As of September 24, 2002, the Dow Jones Industrial Average had lost 27% of the value it held on January 1, 2001: a total loss of 5 trillion dollars. The Dow Jones had already lost 9% of its peak value at the start of 2001, while the Nasdaq had lost 44%. At the March 2000 top, the sum in valuation of all NYSE-listed companies stood at $12.9 trillion, and the valuation sum of all NASDAQ-listed companies stood at $5.4 trillion, for a total market value of $18.3 trillion. The NASDAQ subsequently lost nearly 80% and the S&P 500 lost 50% to reach the October 2002 lows. The total market value of NYSE (7.2) and NASDAQ (1.8) companies at that time was only $9 trillion, for an overall market loss of $9.3 trillion.
Index levels
To put the downturn of 2002 in perspective, here is a look at annual U.S. stock market declines in 2000, 2001, and 2002:
- Nasdaq
- In 2000, the Nasdaq lost 39.28% of its value (4,069.31 to 2,470.52).
- In 2001, the Nasdaq lost 21.05% of its value (2,470.52 to 1,950.40).
- In 2002, the Nasdaq lost 31.53% of its value (1,950.40 to 1,335.51).
- Dow Jones Industrial Average
- In 2000, the Dow lost 6.17% of its value (11,497.10 to 10,788.00)
- In 2001, the Dow lost 5.35% of its value (10,788.00 to 10,021.60)
- In 2002, the Dow lost 16.76% of its value (10,021.60 to 8,341.63)
Here is a historical view of the stock market downturn of 2002 including figures from the stock market bubble of the late 1990s:
| Date | Nasdaq | % Chng.§ | Dow Jones | % Chng.§ | Notes |
|---|---|---|---|---|---|
| January 1, 1997 | 1,291.03 | — | 6,448.30 | — | |
| January 1, 1998 | 1,570.35 | +21.63% | 7,908.30 | +22.64% | |
| January 1, 1999 | 2,192.69 | +39.63% | 9,181.40 | +16.10% | |
| January 1, 2000 | 4,069.31 | +85.58% | 11,497.10 | +25.22% | |
| January 14, 2000 | 4,064.27 | −0.12% | 11,722.98 | +1.97% | The day the DJIA peaked. |
| March 10, 2000 | 5,048.62 | +24.22% | 9,928.80 | −15.31% | The day the Nasdaq peaked. |
| January 1, 2001 | 2,470.52 | −51.07% | 10,788.00 | +8.65% | |
| January 20, 2001 | 2,770.38 | +12.14% | 10,587.60 | −1.86% | President Bush takes office. |
| September 10, 2001 | 1,695.38 | −38.80% | 9,605.51 | −9.28% | Levels before September 11, 2001 attacks. |
| September 21, 2001 | 1,423.19 | −16.05% | 8,235.81 | −14.26% | Lows after markets reopened. |
| January 1, 2002 | 1,950.40 | +37.04% | 10,021.60 | +21.68% | |
| October 9, 2002 | 1,114.11 | −42.88% | 7,286.27 | −27.29% | 2002 lows. |
| January 1, 2003 | 1,335.51 | +19.87% | 8,341.63 | +14.48% | |
| January 1, 2004 | 2,003.37 | +50.01% | 10,453.92 | +25.32% |
- §Values represent percent change from previous date listed in table.
See also
References
- ^ "A Retrospective on the Stock Market in 2000" (PDF). Archived from the original (PDF) on 2012-04-04. Retrieved 2012-03-28.
External links
NB: Registration required for all links
- "Rally Sends Major Gauges to Gains of More Than 5%", The New York Times, July 30, 2002
- "NEWS ANALYSIS: What Will Halt the Skid on Wall Street?", The New York Times, July 22, 2002
- "The Confidence Crisis", The New York Times, July 21, 2002
- "Stocks Continue Four-Month Rout; Dow Plunges 390", The New York Times, July 20, 2002
- "MARKET PLACE: Adding to Loss of Investments, a Loss of Faith in the Market", The New York Times, July 20, 2002
- "SCREAM! Hold On for a Wild Ride", The New York Times, July 21, 2002
- "S.&P. 500 Index Drops to Its Lowest Level Since 1997", Bloomberg News, July 19, 2002