

South Ribble Borough Council elections are held every four years. South Ribble Borough Council is the local authority for the non-metropolitan district of South Ribble in Lancashire, England. Since the last boundary changes in 2015, 50 councillors have been elected from 23 wards.[1] The next borough council elections are due to take place in 2027 as part of the wider 2027 United Kingdom local elections.[2]
Council elections
- 1973 South Ribble Borough Council election
- 1976 South Ribble Borough Council election (New ward boundaries)[3]
- 1979 South Ribble Borough Council election
- 1983 South Ribble Borough Council election
- 1987 South Ribble Borough Council election (New ward boundaries & borough boundary changes also took place)[4][5]
- 1991 South Ribble Borough Council election
- 1995 South Ribble Borough Council election
- 1999 South Ribble Borough Council election
- 2003 South Ribble Borough Council election (New ward boundaries increased the number of seats by 1)[6][7][8]
- 2007 South Ribble Borough Council election
- 2011 South Ribble Borough Council election
- 2015 South Ribble Borough Council election (New ward boundaries)[1]
- 2019 South Ribble Borough Council election
- 2023 South Ribble Borough Council election
- 2027 South Ribble Borough Council election
Election results

Council composition
| Overall control | Conservative | Labour | Lib Dems [a] | Idle Toad | Independents | ||||||
| 2023 | Labour | 16 | 29 | 5 | - | - | |||||
| 2019 | NOC | 23 | 22 | 5 | - | 0 | |||||
| 2015 | Conservative | 29 | 19 | 2 | - | - | |||||
| 2011 | Conservative | 33 | 21 | 1 | - | - | |||||
| 2007 | Conservative | 44 | 8 | 1 | 2 | 0 | |||||
| 2003 | NOC | 19 | 17 | 15 | 4 | 0 | |||||
| 1999 | NOC | 18 | 21 | 12 | - | 3 | |||||
| 1995 | Labour | 16 | 29 | 9 | - | - | |||||
| 1991 | Conservative | 33 | 15 | 6 | - | 0 | |||||
| 1987 | Conservative | 37 | 11 | 6 | - | 0 | |||||
| 1983 | Conservative | 39 | 11 | 4 | - | 0 | |||||
| 1979 | Conservative | 42 | 10 | 1 | - | 1 | |||||
| 1976 | Conservative | 45 | 8 | 0 | - | 1 | |||||
| 1973 | Conservative | 30 | 16 | 2 | - | 1 | |||||
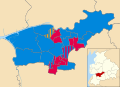
Borough result maps
-
 2003 results map
 -
 2007 results map
 -
 2011 results map
 -
 2015 results map
 -
 2019 results map
 -
 2023 results map


By-election results
1995-1999
| Party | Candidate | Votes | % | ±% | |
|---|---|---|---|---|---|
| Labour | 1,600 | 45.2 | -0.1 | ||
| Conservative | 1,334 | 37.7 | +2.6 | ||
| Liberal Democrats | 608 | 17.2 | -2.4 | ||
| Majority | 266 | 7.5 | |||
| Turnout | 3,542 | ||||
| Labour hold | Swing | ||||
| Party | Candidate | Votes | % | ±% | |
|---|---|---|---|---|---|
| Conservative | 507 | 57.5 | +15.8 | ||
| Labour | 260 | 29.5 | -5.0 | ||
| Liberal Democrats | 115 | 13.0 | -10.5 | ||
| Majority | 247 | 28.0 | |||
| Turnout | 882 | 22.5 | |||
| Conservative hold | Swing | ||||
| Party | Candidate | Votes | % | ±% | |
|---|---|---|---|---|---|
| Labour | 398 | 47.6 | -17.3' | ||
| Conservative | 267 | 31.9 | +7.0 | ||
| Idle Toad | 98 | 11.7 | +11.7 | ||
| Liberal Democrats | 74 | 8.8 | -1.4 | ||
| Majority | 131 | 15.7 | |||
| Turnout | 837 | 20.0 | |||
| Labour hold | Swing | ||||
1999-2003
| Party | Candidate | Votes | % | ±% | |
|---|---|---|---|---|---|
| Conservative | 356 | 42.2 | -10.3 | ||
| Liberal Democrats | 323 | 38.3 | +20.2 | ||
| Labour | 165 | 19.5 | -9.9 | ||
| Majority | 33 | 3.9 | |||
| Turnout | 844 | ||||
| Conservative hold | Swing | ||||
| Party | Candidate | Votes | % | ±% | |
|---|---|---|---|---|---|
| Labour | 347 | 65.7 | -12.3 | ||
| Liberal Democrats | 121 | 22.9 | +22.9 | ||
| Conservative | 60 | 11.4 | -10.6 | ||
| Majority | 226 | 42.8 | |||
| Turnout | 528 | ||||
| Labour hold | Swing | ||||
| Party | Candidate | Votes | % | ±% | |
|---|---|---|---|---|---|
| Liberal Democrats | 823 | 70.6 | +30.2 | ||
| Labour | 342 | 29.4 | -7.8 | ||
| Majority | 481 | 41.2 | |||
| Turnout | 1,165 | 24.8 | |||
| Liberal Democrats gain from Labour | Swing | ||||
2003-2007
| Party | Candidate | Votes | % | ±% | |
|---|---|---|---|---|---|
| Liberal Democrats | Christine Leeming | 316 | 41.1 | +41.1 | |
| Conservative | John Cannon | 283 | 36.8 | -26.1 | |
| Labour | Graham Davies | 92 | 12.0 | -25.1 | |
| Idle Toad | Michael Nathan | 78 | 10.1 | +10.1 | |
| Majority | 33 | 4.3 | |||
| Turnout | 769 | 25.0 | |||
| Liberal Democrats gain from Conservative | Swing | ||||
| Party | Candidate | Votes | % | ±% | |
|---|---|---|---|---|---|
| Liberal Democrats | James Leeming | 406 | 49.4 | -18.7 | |
| Conservative | Frances Thompson | 264 | 32.1 | +22.8 | |
| Labour | Donald Smith | 152 | 18.5 | -4.1 | |
| Majority | 142 | 17.3 | |||
| Turnout | 822 | 32.2 | |||
| Liberal Democrats hold | Swing | ||||
| Party | Candidate | Votes | % | ±% | |
|---|---|---|---|---|---|
| Conservative | Michael McNulty | 594 | 51.5 | +11.5 | |
| Liberal Democrats | Richard Bridge | 431 | 37.4 | -6.4 | |
| Labour | Michaek Titherington | 128 | 11.1 | -5.1 | |
| Majority | 163 | 14.1 | |||
| Turnout | 1,153 | 40.0 | |||
| Conservative gain from Liberal Democrats | Swing | ||||
| Party | Candidate | Votes | % | ±% | |
|---|---|---|---|---|---|
| Idle Toad | James Marsh | 364 | 44.0 | -16.4 | |
| Conservative | Frances Walker | 349 | 42.1 | +10.1 | |
| Labour | Houston Lowe | 91 | 11.0 | +3.4 | |
| Liberal Democrats | Karen Cairns | 24 | 2.9 | +2.9 | |
| Majority | 15 | 1.9 | |||
| Turnout | 828 | 28.6 | |||
| Idle Toad hold | Swing | ||||
| Party | Candidate | Votes | % | ±% | |
|---|---|---|---|---|---|
| Labour | Michael Titherington | 1,051 | 61.2 | +7.6 | |
| Liberal Democrats | Richard Bridge | 342 | 20.0 | -7.7 | |
| Conservative | John Otter | 323 | 18.8 | +0.1 | |
| Majority | 709 | 41.2 | |||
| Turnout | 1,716 | ||||
| Labour hold | Swing | ||||
2007-2011
| Party | Candidate | Votes | % | ±% | |
|---|---|---|---|---|---|
| Labour | Caleb Tomlinson | 371 | 34.5 | +1.1 | |
| Conservative | Phillip Hamman | 355 | 33.0 | -7.6 | |
| Liberal Democrats | Derek Forrest | 350 | 32.5 | +6.5 | |
| Majority | 16 | 1.5 | |||
| Turnout | 1,076 | ||||
| Labour gain from Conservative | Swing | ||||
| Party | Candidate | Votes | % | ±% | |
|---|---|---|---|---|---|
| Conservative | Michael Nelson | 531 | 54.3 | -21.7 | |
| Labour | Daniel McDermott | 241 | 24.6 | +24.6 | |
| Liberal Democrats | Martin Cassell | 206 | 21.1 | -3.0 | |
| Majority | 290 | 29.7 | |||
| Turnout | 978 | ||||
| Conservative hold | Swing | ||||
| Party | Candidate | Votes | % | ±% | |
|---|---|---|---|---|---|
| Conservative | Philip Hamman | 709 | '74.9 | +6.3 | |
| Labour | Peter Holker | 237 | 25.1 | +6.1 | |
| Majority | 472 | 49.8 | |||
| Turnout | 946 | ||||
| Conservative hold | Swing | ||||
2011-2015
| Party | Candidate | Votes | % | ±% | |
|---|---|---|---|---|---|
| Labour | Mick Higgins | 481 | 55.0 | -2.4 | |
| Conservative | Barbara Nathan | 393 | 45.0 | +2.4 | |
| Majority | 88 | 10.1 | |||
| Turnout | 874 | 23.4 | |||
| Labour hold | Swing | ||||
| Party | Candidate | Votes | % | ±% | |
|---|---|---|---|---|---|
| Liberal Democrats | David Howarth | 469 | 39.0 | +7.2 | |
| Conservative | Angela Turner | 390 | 32.4 | -12.8 | |
| Labour | Robert Taylor | 185 | 15.4 | -7.6 | |
| UKIP | David Duxbury | 159 | 13.2 | +13.2 | |
| Majority | 79 | 6.6 | |||
| Turnout | 1,203 | ||||
| Liberal Democrats gain from Conservative | Swing | ||||
| Party | Candidate | Votes | % | ±% | |
|---|---|---|---|---|---|
| Labour | Ken Jones | 534 | 48.4 | +0.2 | |
| Conservative | Paul Wharton | 440 | 39.9 | -3.2 | |
| Liberal Democrats | Gareth Armstrong | 129 | 11.7 | +3.0 | |
| Majority | 94 | 8.5 | |||
| Turnout | 1,103 | ||||
| Labour hold | Swing | ||||
| Party | Candidate | Votes | % | ±% | |
|---|---|---|---|---|---|
| Conservative | Alan Ogilvie | 744 | 60.0 | -6.8 | |
| Labour | Carole Titherington | 401 | 32.3 | -0.9 | |
| Liberal Democrats | Charlotte Ashworth | 95 | 7.7 | +7.7 | |
| Majority | 343 | 27.7 | |||
| Turnout | 1,240 | ||||
| Conservative hold | Swing | ||||
2015-2019
| Party | Candidate | Votes | % | ±% | |
|---|---|---|---|---|---|
| Labour | Malcolm Donoghue | 625 | 55.2 | -3.0 | |
| Conservative | Anthony Green | 405 | 35.8 | +6.0 | |
| Liberal Democrats | James Pattison | 102 | 9.0 | +9.0 | |
| Majority | 220 | 19.4 | |||
| Turnout | 1,132 | ||||
| Labour hold | Swing | ||||
| Party | Candidate | Votes | % | ±% | |
|---|---|---|---|---|---|
| Conservative | Carol Chisholm | 359 | 49.4 | -5.1 | |
| Labour | Alex Watson | 262 | 36.0 | -9.5 | |
| Liberal Democrats | Alison Hesketh-Holt | 106 | 14.6 | +14.6 | |
| Majority | 97 | 13.3 | |||
| Turnout | 727 | ||||
| Conservative hold | Swing | ||||
2019-2023
| Party | Candidate | Votes | % | ±% | |
|---|---|---|---|---|---|
| Conservative | Gareth Watson | 437 | 49.1 | -0.8 | |
| Independent | Graham Dixon | 343 | 38.5 | +38.5 | |
| Liberal Democrats | Stephanie Portersmith | 110 | 12.4 | +12.4 | |
| Majority | 94 | 10.6 | |||
| Turnout | 890 | ||||
| Conservative hold | Swing | ||||
| Party | Candidate | Votes | % | ±% | |
|---|---|---|---|---|---|
| Conservative | Julie Buttery | 1,301 | 67.2 | +15.4 | |
| Labour | Amy Dwyer | 353 | 18.2 | +0.6 | |
| Liberal Democrats | Simon Carter | 151 | 7.8 | -10.2 | |
| Reform UK | Jonathan Kay | 70 | 3.6 | +3.6 | |
| Green | Heike McMurray | 61 | 3.2 | +3.2 | |
| Majority | 948 | 49.0 | |||
| Turnout | 1,936 | ||||
| Conservative hold | Swing | ||||
| Party | Candidate | Votes | % | ±% | |
|---|---|---|---|---|---|
| Labour | Kath Unsworth | 517 | 44.4 | -16.8 | |
| Conservative | Andrew Ashton | 398 | 34.2 | +12.3 | |
| Liberal Democrats | Paul Valentine | 249 | 21.4 | +4.4 | |
| Majority | 119 | 10.2 | |||
| Turnout | 1,164 | ||||
| Labour hold | Swing | ||||
| Party | Candidate | Votes | % | ±% | |
|---|---|---|---|---|---|
| Labour | Patricia Hunter | 376 | 53.7 | +7.1 | |
| Conservative | Matthew Forshaw | 275 | 39.3 | +9.5 | |
| Green | Rachel Knowles | 49 | 7.0 | +7.0 | |
| Majority | 101 | 14.4 | |||
| Turnout | 700 | ||||
| Labour hold | Swing | ||||
| Party | Candidate | Votes | % | ±% | |
|---|---|---|---|---|---|
| Labour | Lou Jackson | 626 | 53.4 | +8.9 | |
| Conservative | Craige Southern | 460 | 39.2 | -2.0 | |
| Liberal Democrats | Simon Thomson | 86 | 7.3 | -7.0 | |
| Majority | 166 | 14.2 | |||
| Turnout | 1,172 | ||||
| Labour hold | Swing | ||||
Notes
- ^ Includes Alliance and Liberal Party.
References
- ^ a b "The South Ribble (Electoral Changes) Order 2014", legislation.gov.uk, The National Archives, SI 2014/3288, retrieved 25 August 2022
- ^ "Election timetable in England". Gov.UK. Retrieved 17 October 2023.
- ^ The Borough of South Ribble (Electoral Arrangements) Order 1975
- ^ The Lancashire (District Boundaries) Order 1986
- ^ legislation.gov.uk - The Borough of South Ribble (Electoral Arrangements) Order 1987. Retrieved on 4 November 2015.
- ^ "Local elections". BBC News Online. Retrieved 16 October 2009.
- ^ legislation.gov.uk - The Borough of South Ribble (Electoral Changes) Order 2001. Retrieved on 4 October 2015.
- ^ legislation.gov.uk - The Borough of South Ribble (Electoral Changes) (Amendment) Order 2002. Retrieved on 4 October 2015.
- ^ "Election of a councillor for the Walton-le-Dale ward" (PDF). South Ribble Borough Council. Retrieved 16 October 2009.
- ^ "Election of a councillor for the Leyland St Ambrose ward" (PDF). South Ribble Borough Council. Retrieved 16 October 2009.
- ^ "Election of a councillor for the Leyland St Mary's ward" (PDF). South Ribble Borough Council. Retrieved 16 October 2009.
- ^ "Twin council win for Tories". guardian.co.uk. 15 October 2004. Retrieved 16 October 2009.
- ^ "Election of a councillor for the Coupe Green & Gregson Lane ward" (PDF). South Ribble Borough Council. Retrieved 16 October 2009.
- ^ "Golden Hill ward" (PDF). South Ribble Borough Council. Retrieved 16 October 2009.
- ^ a b "Declaration of result of poll" (PDF). South Ribble Borough Council. Retrieved 16 October 2009.
- ^ "New councillor for Leyland". Lancashire Evening Post. 16 October 2009. Retrieved 16 October 2009.
- ^ "Bamber Bridge East by-election result". South Ribble Borough Council. 14 October 2011. Retrieved 15 October 2011.
- ^ "Local Elections Archive Project — Howick and Priory Ward". www.andrewteale.me.uk. Retrieved 18 September 2022.
- ^ "Local Elections Archive Project — Leyland St Ambrose Ward". www.andrewteale.me.uk. Retrieved 18 September 2022.
- ^ "Local Elections Archive Project — Leyland St Mary's Ward". www.andrewteale.me.uk. Retrieved 18 September 2022.
- ^ "Local Elections Archive Project — Seven Stars Ward". www.andrewteale.me.uk. Retrieved 18 September 2022.
- ^ "Local Elections Archive Project — Walton-le-Dale East Ward". www.andrewteale.me.uk. Retrieved 18 September 2022.
- ^ "Local Elections Archive Project — Coupe Green and Gregson Lane Ward". www.andrewteale.me.uk. Retrieved 18 September 2022.
- ^ "Local Elections Archive Project — Longton and Hutton West Ward". www.andrewteale.me.uk. Retrieved 18 September 2022.
- ^ "Local Elections Archive Project — St Ambrose Ward". www.andrewteale.me.uk. Retrieved 18 September 2022.
- ^ "Local Elections Archive Project — Bamber Bridge East Ward". www.andrewteale.me.uk. Retrieved 18 September 2022.
- ^ "Local Elections Archive Project — Earnshaw Bridge Ward". www.andrewteale.me.uk. Retrieved 18 September 2022.