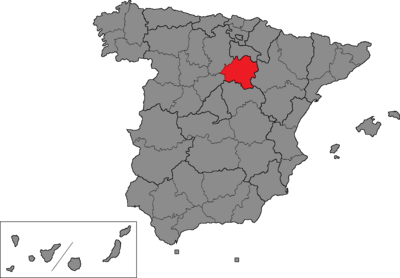
Soria is one of the 52 constituencies (Spanish : circunscripciones ) represented in the Congress of Deputies , the lower chamber of the Spanish parliament, the Cortes Generales . The constituency currently elects two deputies . Its boundaries correspond to those of the Spanish province of Soria . The electoral system uses the D'Hondt method and a closed-list proportional representation , with a minimum threshold of three percent.
Electoral system The constituency was created as per the Political Reform Act 1977 and was first contested in the 1977 general election . The Act provided for the provinces of Spain to be established as multi-member districts in the Congress of Deputies ,[2] Spanish Constitution of 1978 . Additionally, the Constitution requires for any modification of the provincial limits to be approved under an organic law , needing an absolute majority in the Cortes Generales .[3]
Voting is on the basis of universal suffrage , which comprises all nationals over eighteen and in full enjoyment of their political rights. The only exception was in 1977, when this was limited to nationals over twenty-one and in full enjoyment of their political and civil rights. Amendments to the electoral law in 2011 required for Spaniards abroad to apply for voting before being permitted to vote, a system known as "begged" or expat vote (Spanish : Voto rogado ).[4] D'Hondt method and a closed list proportional representation , with an electoral threshold of three percent of valid votes—which includes blank ballots—being applied in each constituency. Each provincial constituency is entitled to an initial minimum of two seats, with the remaining 248 being distributed in proportion to their populations. Ceuta and Melilla are allocated the two remaining seats, which are elected using plurality voting .[3] [5] [6] district magnitude .[7]
The electoral law allows for parties and federations registered in the interior ministry , coalitions and groupings of electors to present lists of candidates. Parties and federations intending to form a coalition ahead of an election are required to inform the relevant Electoral Commission within ten days of the election call—fifteen before 1985—whereas groupings of electors need to secure the signature of at least one percent of the electorate in the constituencies for which they seek election—one-thousandth of the electorate, with a compulsory minimum of 500 signatures, until 1985—disallowing electors from signing for more than one list of candidates. Also since 2011, parties, federations or coalitions that have not obtained a mandate in either chamber of the Cortes at the preceding election are required to secure the signature of at least 0.1 percent of electors in the aforementioned constituencies.[5] [6]
Deputies Elections 2023 general election
Summary of the 23 July 2023 Congress of Deputies election results in Soria
Parties and alliances
Popular vote
Seats
Votes
%
±pp
Total
+/−
People's Party (PP)
18,895
37.22
+4.37
1 ±0
Spanish Socialist Workers' Party (PSOE)
14,966
29.48
–5.09
1 ±0
Soria Now! (SY)
9,697
19.10
New
0
±0
Vox (Vox)
4,978
9.81
–3.69
0
±0
Unite (Sumar)1
1,711
3.37
–4.21
0
±0
Animalist Party with the Environment (PACMA)2
94
0.19
–0.25
0
±0
Workers' Front (FO)
68
0.13
New
0
±0
Communist Party of the Workers of Spain (PCTE)
43
0.08
–0.11
0
±0
For a Fairer World (PUM+J)
23
0.05
–0.15
0
±0
Zero Cuts (Recortes Cero)
9
0.02
–0.18
0
±0
Blank ballots
285
0.56
–0.99
Total
50,769
2
±0
Valid votes
50,769
99.24
+1.01
Invalid votes
388
0.76
–1.01
Votes cast / turnout
51,157
67.52
+6.02
Abstentions
24,611
32.48
-6.02
Registered voters
75,768
Sources[8]
November 2019 general election
Summary of the 10 November 2019 Congress of Deputies election results in Soria
Parties and alliances
Popular vote
Seats
Votes
%
±pp
Total
+/−
Spanish Socialist Workers' Party (PSOE)
16,043
34.57
+2.86
1 ±0
People's Party (PP)
15,247
32.85
+6.18
1 ±0
Vox (Vox)
6,264
13.50
+4.16
0
±0
United We Can (Podemos –IU )
3,517
7.58
–1.02
0
±0
Citizens–Party of the Citizenry (Cs)
2,670
5.75
–10.57
0
±0
Sorian People's Platform (PPSO)
1,466
3.16
–1.95
0
±0
Animalist Party Against Mistreatment of Animals (PACMA)
205
0.44
–0.07
0
±0
Zero Cuts –Green Group –PCAS –TC (Recortes Cero–GV–PCAS–TC)
95
0.20
±0.00
0
±0
For a Fairer World (PUM+J)
95
0.20
+0.05
0
±0
Communist Party of the Workers of Spain (PCTE)
87
0.19
+0.03
0
±0
Blank ballots
721
1.55
+0.32
Total
46,410
2
±0
Valid votes
46,410
98.23
–0.23
Invalid votes
838
1.77
+0.23
Votes cast / turnout
47,248
61.50
–7.32
Abstentions
29,579
38.50
+7.32
Registered voters
76,827
Sources[9]
April 2019 general election
Summary of the 28 April 2019 Congress of Deputies election results in Soria
Parties and alliances
Popular vote
Seats
Votes
%
±pp
Total
+/−
Spanish Socialist Workers' Party (PSOE)
16,513
31.71
+5.99
1 ±0
People's Party (PP)
13,887
26.67
–18.20
1 ±0
Citizens–Party of the Citizenry (Cs)
8,501
16.32
+4.87
0
±0
Vox (Vox)
4,866
9.34
+9.10
0
±0
United We Can (Podemos –IU –Equo )
4,481
8.60
–6.72
0
±0
Sorian People's Platform (PPSO)
2,663
5.11
New
0
±0
Animalist Party Against Mistreatment of Animals (PACMA)
263
0.51
–0.01
0
±0
Zero Cuts –Green Group –PCAS –TC (Recortes Cero–GV–PCAS–TC)
103
0.20
+0.02
0
±0
Communist Party of the Workers of Spain (PCTE)
81
0.16
New
0
±0
For a Fairer World (PUM+J)
77
0.15
New
0
±0
Blank ballots
642
1.23
+0.02
Total
52,077
2
±0
Valid votes
52,077
98.46
–0.11
Invalid votes
815
1.54
+0.11
Votes cast / turnout
52,892
68.82
+3.29
Abstentions
23,969
31.18
–3.29
Registered voters
76,861
Sources[9]
2016 general election
Summary of the 26 June 2016 Congress of Deputies election results in Soria
Parties and alliances
Popular vote
Seats
Votes
%
±pp
Total
+/−
People's Party (PP)
22,264
44.87
+6.23
1 ±0
Spanish Socialist Workers' Party (PSOE)
12,762
25.72
+1.93
1 ±0
United We Can (Podemos –IU –Equo )1
7,599
15.32
–4.29
0
±0
Citizens–Party of the Citizenry (C's)
5,679
11.45
–3.74
0
±0
Animalist Party Against Mistreatment of Animals (PACMA)
260
0.52
+0.15
0
±0
Union, Progress and Democracy (UPyD)
125
0.25
–0.38
0
±0
Vox (Vox)
119
0.24
New
0
±0
Zero Cuts –Green Group (Recortes Cero–GV)
90
0.18
+0.01
0
±0
Spanish Phalanx of the CNSO (FE–JONS)
63
0.13
New
0
±0
Communist Party of the Peoples of Spain (PCPE)
57
0.11
+0.01
0
±0
Blank ballots
600
1.21
–0.10
Total
49,618
2
±0
Valid votes
49,618
98.57
–0.20
Invalid votes
719
1.43
+0.20
Votes cast / turnout
50,337
65.53
–2.64
Abstentions
26,477
34.47
+2.64
Registered voters
76,814
Sources[9]
2015 general election
Summary of the 20 December 2015 Congress of Deputies election results in Soria
Parties and alliances
Popular vote
Seats
Votes
%
±pp
Total
+/−
People's Party (PP)
20,030
38.64
–16.29
1 ±0
Spanish Socialist Workers' Party (PSOE)
12,331
23.79
–7.66
1 ±0
We Can (Podemos)
8,328
16.07
New
0
±0
Citizens–Party of the Citizenry (C's)
7,872
15.19
New
0
±0
United Left –Popular Unity in Common (IU–UPeC)
1,836
3.54
–1.13
0
±0
Union, Progress and Democracy (UPyD)
327
0.63
–3.66
0
±0
Animalist Party Against Mistreatment of Animals (PACMA)
192
0.37
+0.07
0
±0
National Democracy (DN)
101
0.19
–0.16
0
±0
Zero Cuts –Green Group (Recortes Cero–GV)
86
0.17
New
0
±0
Communist Party of the Peoples of Spain (PCPE)
54
0.10
New
0
±0
Blank ballots
679
1.31
–1.22
Total
51,836
2
±0
Valid votes
51,836
98.77
+0.99
Invalid votes
647
1.23
–0.99
Votes cast / turnout
52,483
68.17
+0.62
Abstentions
24,503
31.83
–0.62
Registered voters
76,986
Sources[9]
2011 general election
Summary of the 20 November 2011 Congress of Deputies election results in Soria
Parties and alliances
Popular vote
Seats
Votes
%
±pp
Total
+/−
People's Party (PP)
28,063
54.93
+5.13
1 ±0
Spanish Socialist Workers' Party (PSOE)
16,066
31.45
–11.15
1 ±0
United Left of Castile and León : Plural Left (IUCyL)
2,385
4.67
+2.43
0
±0
Union, Progress and Democracy (UPyD)
2,190
4.29
+2.32
0
±0
Equo (Equo)
559
1.09
New
0
±0
National Democracy (DN)
181
0.35
+0.25
0
±0
Animalist Party Against Mistreatment of Animals (PACMA)
152
0.30
+0.14
0
±0
For a Fairer World (PUM+J)
127
0.25
+0.13
0
±0
Communist Unification of Spain (UCE)
73
0.14
New
0
±0
Blank ballots
1,295
2.53
+0.80
Total
51,091
2
±0
Valid votes
51,091
97.78
+0.19
Invalid votes
1,161
2.22
–0.19
Votes cast / turnout
52,252
67.55
–6.66
Abstentions
25,103
32.45
+6.66
Registered voters
77,355
Sources[9]
2008 general election
Summary of the 9 March 2008 Congress of Deputies election results in Soria
Parties and alliances
Popular vote
Seats
Votes
%
±pp
Total
+/−
People's Party (PP)
27,905
49.80
–1.00
1 –1
Spanish Socialist Workers' Party (PSOE)
23,868
42.60
+3.81
1 ±0
United Left–Alternative (IU)
1,253
2.24
+0.10
0
±0
Union, Progress and Democracy (UPyD)
1,106
1.97
New
0
±0
Citizens–Party of the Citizenry (C's)
187
0.33
New
0
±0
The Greens (LV)
107
0.19
New
0
±0
The Greens of Europe (LVdE)
96
0.17
New
0
±0
Anti-Bullfighting Party Against Mistreatment of Animals (PACMA)
91
0.16
New
0
±0
Social Democratic Party (PSD)
83
0.15
New
0
±0
Commoners' Land (TC)
83
0.15
+0.03
0
±0
For a Fairer World (PUM+J)
66
0.12
New
0
±0
National Democracy (DN)
55
0.10
+0.06
0
±0
Communist Party of the Castilian People (PCPC–PCPE)
50
0.09
+0.04
0
±0
Spanish Phalanx of the CNSO (FE–JONS)
48
0.09
+0.03
0
±0
Family and Life Party (PFyV)
27
0.05
New
0
±0
Spanish Alternative (AES)
20
0.04
New
0
±0
Spain 2000 (E–2000)
16
0.03
New
0
±0
Blank ballots
972
1.73
–0.45
Total
56,033
2
–1
Valid votes
56,033
97.59
+0.32
Invalid votes
1,386
2.41
–0.32
Votes cast / turnout
57,419
74.21
–1.01
Abstentions
19,951
25.79
+1.01
Registered voters
77,370
Sources[9]
2004 general election
Summary of the 14 March 2004 Congress of Deputies election results in Soria
Parties and alliances
Popular vote
Seats
Votes
%
±pp
Total
+/−
People's Party (PP)
29,187
50.80
–7.67
2 ±0
Spanish Socialist Workers' Party (PSOE)
22,287
38.79
+6.81
1 ±0
Initiative for the Development of Soria (IDES)
2,934
5.11
New
0
±0
United Left (IU)
1,230
2.14
–2.19
0
±0
Citizens for Blank Votes (CenB)
100
0.17
New
0
±0
Democratic and Social Centre (CDS)
89
0.15
–1.15
0
±0
Commoners' Land–Castilian Nationalist Party (TC–PNC)
71
0.12
–0.31
0
±0
Family and Life Party (PFyV)
39
0.10
New
0
±0
Humanist Party (PH)
35
0.06
New
0
±0
Republican Left (IR)
34
0.06
New
0
±0
Spanish Phalanx of the CNSO (FE–JONS)
32
0.06
New
0
±0
Carlist Party (PC)
28
0.05
New
0
±0
Communist Party of the Castilian People (PCPC–PCPE)
28
0.05
New
0
±0
Spanish Democratic Party (PADE)
25
0.04
–0.06
0
±0
National Democracy (DN)
23
0.04
New
0
±0
The Phalanx (FE)
20
0.03
–0.07
0
±0
Spanish Absolute Honesty Political Group (GPHAE)
17
0.03
New
0
±0
Authentic Phalanx (FA)
17
0.03
New
0
±0
Republican Social Movement (MSR)
8
0.01
New
0
±0
Blank ballots
1,255
2.18
–0.62
Total
57,459
3
±0
Valid votes
57,459
97.27
–1.66
Invalid votes
1,612
2.73
+1.66
Votes cast / turnout
59,071
75.22
+5.92
Abstentions
19,460
24.78
–5.92
Registered voters
78,531
Sources[9]
2000 general election 1996 general election 1993 general election 1989 general election 1986 general election
Summary of the 22 June 1986 Congress of Deputies election results in Soria
Parties and alliances
Popular vote
Seats
Votes
%
±pp
Total
+/−
People's Coalition (AP –PDP –PL )1
23,949
42.12
+4.85
2 +1
Spanish Socialist Workers' Party (PSOE)
20,373
35.83
+0.49
1 ±0
Democratic and Social Centre (CDS)
8,014
14.09
+9.38
0
±0
United Left (IU)2
1,500
2.64
+1.47
0
±0
Democratic Reformist Party (PRD)
1,237
2.18
New
0
±0
Communists' Unity Board (MUC)
400
0.70
New
0
±0
Workers' Socialist Party (PST)
354
0.62
+0.17
0
±0
Communist Unification of Spain (UCE)
277
0.49
+0.22
0
±0
Party of the Communists of Catalonia (PCC)
167
0.29
New
0
±0
Union of the Democratic Centre (UCD)
n/a n/a –18.70
0
–1
Blank ballots
592
1.04
–0.22
Total
56,863
3
±0
Valid votes
56,863
96.79
+0.30
Invalid votes
1,888
3.21
–0.30
Votes cast / turnout
58,751
72.08
–8.38
Abstentions
22,760
27.92
+8.38
Registered voters
81,511
Sources[9]
1982 general election
Summary of the 28 October 1982 Congress of Deputies election results in Soria
Parties and alliances
Popular vote
Seats
Votes
%
±pp
Total
+/−
People's Alliance–People's Democratic Party (AP –PDP )1
22,820
37.27
+27.24
1 +1
Spanish Socialist Workers' Party (PSOE)
21,639
35.34
+9.79
1 ±0
Union of the Democratic Centre (UCD)
11,453
18.70
–38.50
1 –1
Democratic and Social Centre (CDS)
2,881
4.71
New
0
±0
Communist Party of Spain (PCE)
715
1.17
–1.62
0
±0
New Force (FN)2
405
0.66
–0.54
0
±0
Workers' Socialist Party (PST)
278
0.45
New
0
±0
Communist Unification of Spain (UCE)
168
0.27
New
0
±0
Falangist Movement of Spain (MFE)
102
0.17
New
0
±0
Revolutionary Communist League (LCR)
0
0.00
New
0
±0
Communist Movement of Castile and León (MC–CL)
0
0.00
New
0
±0
Blank ballots
769
1.26
+0.20
Total
61,230
3
±0
Valid votes
61,230
96.49
–1.01
Invalid votes
2,228
3.51
+1.01
Votes cast / turnout
63,458
80.46
+10.81
Abstentions
15,413
19.54
–10.81
Registered voters
78,871
Sources[9]
1979 general election
Summary of the 1 March 1979 Congress of Deputies election results in Soria
Parties and alliances
Popular vote
Seats
Votes
%
±pp
Total
+/−
Union of the Democratic Centre (UCD)
31,756
57.20
–1.40
2 –1
Spanish Socialist Workers' Party (PSOE)1
14,187
25.55
+2.87
1 +1
Democratic Coalition (CD)2
5,567
10.03
+3.74
0
±0
Communist Party of Spain (PCE)
1,550
2.79
+0.81
0
±0
National Union (UN)
664
1.20
New
0
±0
Party of Labour of Spain (PTE)3
341
0.61
+0.35
0
±0
Workers' Revolutionary Organization (ORT)
320
0.58
New
0
±0
Communist Movement –Organization of Communist Left (MC–OIC)
301
0.54
New
0
±0
Communist Organization of Spain (Red Flag) (OCE–BR)
246
0.44
New
0
±0
Blank ballots
588
1.06
+0.59
Total
55,520
3
±0
Valid votes
55,520
97.50
–0.95
Invalid votes
1,426
2.50
+0.95
Votes cast / turnout
56,946
69.65
–13.10
Abstentions
24,818
30.35
+13.10
Registered voters
81,764
Sources[9]
1977 general election
Summary of the 15 June 1977 Congress of Deputies election results in Soria
Parties and alliances
Popular vote
Seats
Votes
%
±pp
Total
+/−
Union of the Democratic Centre (UCD)
35,324
58.60
n/a 3 n/a
Spanish Socialist Workers' Party (PSOE)
10,757
17.85
n/a
0
n/a
Independent (INDEP)
4,530
7.52
n/a
0
n/a
People's Alliance (AP)
3,792
6.29
n/a
0
n/a
People's Socialist Party –Socialist Unity (PSP–US)
2,911
4.83
n/a
0
n/a
Federation of Christian Democracy (FPD –ID )
1,331
2.21
n/a
0
n/a
Communist Party of Spain (PCE)
1,196
1.98
n/a
0
n/a
Democratic Left Front (FDI)
156
0.26
n/a
0
n/a
Blank ballots
282
0.47
n/a
Total
60,279
3
n/a
Valid votes
60,279
98.45
n/a
Invalid votes
951
1.55
n/a
Votes cast / turnout
61,230
82.75
n/a
Abstentions
12,762
17.25
n/a
Registered voters
73,992
Sources[9]
References
^ "Real Decreto 1037/2022, de 20 de diciembre, por el que se declaran oficiales las cifras de población resultantes de la revisión del Padrón municipal referidas al 1 de enero de 2022" (PDF) . Boletín Oficial del Estado (in Spanish) (305): 178928–178933. 21 December 2022. ISSN 0212-033X .^ "Ley 1/1977, de 4 de enero, para la Reforma Política ". Law No. 1 of 4 January 1977 . Retrieved 27 December 2016 . ^ a b "Constitución Española ". Act of 29 December 1978 . Retrieved 27 December 2016 . ^ Reig Pellicer, Naiara (16 December 2015). "Spanish elections: Begging for the right to vote" . cafebabel.co.uk . Retrieved 17 July 2017 . ^ a b "Real Decreto-ley 20/1977, de 18 de marzo, sobre Normas Electorales". Royal Decree-Law No. 20 of 18 March 1977 . Retrieved 14 December 2019 . ^ a b "Ley Orgánica 5/1985, de 19 de junio, del Régimen Electoral General". Organic Law No. 5 of 19 June 1985 . Retrieved 30 January 2020 . ^ Gallagher, Michael (30 July 2012). "Effective threshold in electoral systems" . Trinity College, Dublin. Archived from the original on 30 July 2017. Retrieved 22 July 2017 . ^ "Resolución de 30 de agosto de 2023, de la Presidencia de la Junta Electoral Central, por la que se publica el resumen de los resultados de las elecciones al Congreso de los Diputados y al Senado convocadas por Real Decreto 400/2023, de 29 de mayo, y celebradas el 23 de julio de 2023, conforme a las actas de escrutinio general y de proclamación de electos remitidas por las correspondientes Juntas Electorales Provinciales y por las Juntas Electorales de Ceuta y de Melilla" (PDF) . Boletín Oficial del Estado (in Spanish) (209): 122201–122274. 1 September 2023. ISSN 0212-033X .^ a b c d e f g h i j k l m n o "Elecciones celebradas. Resultados electorales" . Ministry of the Interior . Retrieved 15 April 2022 .
41°40′N 2°40′W / 41.667°N 2.667°W / 41.667; -2.667
This page was last edited on 12 October 2023, at 08:40