
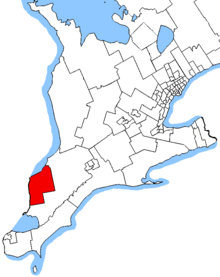
 Sarnia—Lambton in relation to other southwestern Ontario electoral districts | |||
| Provincial electoral district | |||
| Legislature | Legislative Assembly of Ontario | ||
| MPP |
Progressive Conservative | ||
| District created | 1999 | ||
| First contested | 1999 | ||
| Last contested | 2022 | ||
| Demographics | |||
| Population (2016) | 105,335 | ||
| Electors (2018) | 84,296 | ||
| Area (km²) | 1,755 | ||
| Pop. density (per km²) | 60 | ||
| Census division(s) | Lambton County | ||
| Census subdivision(s) | Sarnia, St. Clair, Plympton-Wyoming, Petrolia, Enniskillen, Point Edward | ||
Sarnia—Lambton is a provincial electoral district in southwestern Ontario, Canada. It elects one member to the Legislative Assembly of Ontario.
The riding was created in 1999 from Sarnia and from part of Lambton when ridings in Ontario were redrawn to match federal ridings.
From 1999 to 2007, the riding consisted of the municipalities of Sarnia, Point Edward, St. Clair and Sarnia 45. For the 2007 election, it gained the municipalities of Petrolia, Plympton-Wyoming, Oil Springs and Enniskillen.
YouTube Encyclopedic
-
1/1Views:24 220
-
Your Vote 2014: Election Night
Transcription
Members of Provincial Parliament
| Sarnia—Lambton | ||||
|---|---|---|---|---|
| Assembly | Years | Member | Party | |
| Riding created from Sarnia and Lambton | ||||
| 37th | 1999–2003 | Caroline Di Cocco | Liberal | |
| 38th | 2003–2007 | |||
| 39th | 2007–2011 | Bob Bailey | Progressive Conservative | |
| 40th | 2011–2014 | |||
| 41st | 2014–2018 | |||
| 42nd | 2018–2022 | |||
| 43rd | 2022–present | |||
Election results
| 2022 Ontario general election | ||||||||
|---|---|---|---|---|---|---|---|---|
| Party | Candidate | Votes | % | ±% | Expenditures | |||
| Progressive Conservative | Bob Bailey | 21,184 | 52.72 | −0.02 | $29,549 | |||
| New Democratic | Dylan Stelpstra | 9,489 | 23.62 | −13.75 | $34,373 | |||
| Liberal | Mark Russell | 4,200 | 10.45 | +6.03 | $0 | |||
| New Blue | Keith Benn | 2,719 | 6.77 | $13,739 | ||||
| Green | Mason Bourdeau | 1,266 | 3.15 | −0.50 | $0 | |||
| Populist | Carla Olson | 972 | 2.42 | $0 | ||||
| Ontario Party | Ian Orchard | 351 | 0.87 | $0 | ||||
| Total valid votes/Expense limit | 40,181 | 99.22 | +0.19 | $121,429 | ||||
| Total rejected, unmarked, and declined ballots | 315 | 0.78 | -0.19 | |||||
| Turnout | 40,496 | 46.69 | -14.20 | |||||
| Eligible voters | 86,320 | |||||||
| Progressive Conservative hold | Swing | +6.86 | ||||||
Source(s)
| ||||||||
| 2018 Ontario general election | ||||||||
|---|---|---|---|---|---|---|---|---|
| Party | Candidate | Votes | % | ±% | ||||
| Progressive Conservative | Bob Bailey | 26,811 | 52.75 | |||||
| New Democratic | Kathy Alexander | 18,995 | 37.37 | |||||
| Liberal | Neil Wereley | 2,246 | 4.42 | |||||
| Green | Kevin Shaw | 1,856 | 3.65 | |||||
| Trillium | Andy Bruziewicz | 601 | 1.18 | |||||
| None of the Above | Jeff Lozier | 250 | 0.49 | |||||
| Independent | Fanina R. Kodre | 71 | 0.14 | |||||
| Total valid votes | 50,830 | 100.0 | ||||||
| Turnout | 61.56 | |||||||
| Eligible voters | 82,566 | |||||||
| Source: Elections Ontario[1] | ||||||||
| 2014 Ontario general election | ||||||||
|---|---|---|---|---|---|---|---|---|
| Party | Candidate | Votes | % | ±% | ||||
| Progressive Conservative | Bob Bailey | 18,722 | 41.01 | -7.23 | ||||
| New Democratic | Brian White | 16,327 | 35.77 | +10.28 | ||||
| Liberal | Anne Marie Gillis | 8,152 | 17.86 | -3.97 | ||||
| Green | Kevin Shaw | 2,109 | 4.62 | +3.22 | ||||
| Libertarian | Andrew K. Falby | 340 | 0.74 | +0.35 | ||||
| Total valid votes | 45,650 | 100.00 | ||||||
| Progressive Conservative hold | Swing | -8.76 | ||||||
| Source: Elections Ontario[2] | ||||||||
| 2011 Ontario general election | ||||||||
|---|---|---|---|---|---|---|---|---|
| Party | Candidate | Votes | % | ±% | ||||
| Progressive Conservative | Bob Bailey | 19,570 | 48.32 | +10.16 | ||||
| New Democratic | Brian White | 10,307 | 25.45 | -1.37 | ||||
| Liberal | Stephanie Barry | 8,819 | 21.78 | -7.63 | ||||
| Independent | Andy Bruziewicz | 1,077 | 2.66 | |||||
| Green | Jason Vermette | 567 | 1.40 | -4.22 | ||||
| Freedom | Andrew K. Falby | 160 | 0.40 | |||||
| Total valid votes | 40,500 | 100.00 | ||||||
| Total rejected, unmarked and declined ballots | 199 | 0.49 | ||||||
| Turnout | 40,699 | 51.75 | ||||||
| Eligible voters | 78,646 | |||||||
| Progressive Conservative hold | Swing | +5.77 | ||||||
| Source: Elections Ontario[3] | ||||||||
| 2007 Ontario general election | ||||||||
|---|---|---|---|---|---|---|---|---|
| Party | Candidate | Votes | % | ±% | ||||
| Progressive Conservative | Bob Bailey | 16,145 | 38.16 | +6.29 | ||||
| Liberal | Caroline Di Cocco | 12,443 | 29.41 | -16.80 | ||||
| New Democratic | Barb Millitt | 11,349 | 26.82 | +10.36 | ||||
| Green | Tim van Bodegom | 2,376 | 5.62 | |||||
| Total valid votes | 42,313 | 100.00 | ||||||
| Progressive Conservative gain from Liberal | Swing | +11.54 | ||||||
^ Change is from redistributed results
| 2003 Ontario general election | ||||||||
|---|---|---|---|---|---|---|---|---|
| Party | Candidate | Votes | % | ±% | ||||
| Liberal | Caroline Di Cocco | 18,179 | 47.54 | -1.37 | ||||
| Progressive Conservative | Henk Vanden Ende | 11,852 | 30.99 | -10.97 | ||||
| New Democratic | Glenn Sonier | 6,482 | 16.95 | +9.13 | ||||
| Green | Bradley Gray | 1,414 | 3.70 | |||||
| Freedom | Andrew K. Falby | 316 | 0.83 | -0.47 | ||||
| Total valid votes | 38,243 | 100.00 | ||||||
Swing: 4.80% from PC to Lib (Lib hold)
| 1999 Ontario general election | ||||||||
|---|---|---|---|---|---|---|---|---|
| Party | Candidate | Votes | % | |||||
| Liberal | Caroline Di Cocco | 19,440 | 48.91 | |||||
| Progressive Conservative | David Boushy | 16,679 | 41.96 | |||||
| New Democratic | Mark Kotanen | 3,110 | 7.82 | |||||
| Freedom | Andrew K. Falby | 517 | 1.30 | |||||
| Total valid votes | 39,746 | 100.00 | ||||||
2007 electoral reform referendum
| 2007 Ontario electoral reform referendum | |||
|---|---|---|---|
| Side | Votes | % | |
| First Past the Post | 27,801 | 67.2 | |
| Mixed member proportional | 13,594 | 32.8 | |
| Total valid votes | 41,395 | 100.0 | |
Sources
- ^ "Summary of Valid Votes Cast for each Candidate" (PDF). Elections Ontario. p. 9. Retrieved 20 January 2019.
- ^ Elections Ontario. "General Election Results by District, 078 Sarnia-Lambton". Archived from the original on 14 June 2014. Retrieved 13 June 2014.
- ^ Elections Ontario (2011). "Official return from the records / Rapports des registres officiels - Sarnia—Lambton" (PDF). Retrieved 2 June 2014.
42°54′N 82°10′W / 42.90°N 82.17°W