
Robust Regression and Outlier Detection is a book on robust statistics, particularly focusing on the breakdown point of methods for robust regression. It was written by Peter Rousseeuw and Annick M. Leroy, and published in 1987 by Wiley.
Background
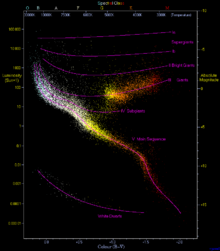
Linear regression is the problem of inferring a linear functional relationship between a dependent variable and one or more independent variables, from data sets where that relation has been obscured by noise. Ordinary least squares assumes that the data all lie near the fit line or plane, but depart from it by the addition of normally distributed residual values. In contrast, robust regression methods work even when some of the data points are outliers that bear no relation to the fit line or plane, possibly because the data draws from a mixture of sources or possibly because an adversarial agent is trying to corrupt the data to cause the regression method to produce an inaccurate result.[1] A typical application, discussed in the book, involves the Hertzsprung–Russell diagram of star types, in which one wishes to fit a curve through the main sequence of stars without the fit being thrown off by the outlying giant stars and white dwarfs.[2] The breakdown point of a robust regression method is the fraction of outlying data that it can tolerate while remaining accurate. For this style of analysis, higher breakdown points are better.[1] The breakdown point for ordinary least squares is near zero (a single outlier can make the fit become arbitrarily far from the remaining uncorrupted data)[2] while some other methods have breakdown points as high as 50%.[1] Although these methods require few assumptions about the data, and work well for data whose noise is not well understood, they may have somewhat lower efficiency than ordinary least squares (requiring more data for a given accuracy of fit) and their implementation may be complex and slow.[3]
Topics
The book has seven chapters.[1][4] The first is introductory; it describes simple linear regression (in which there is only one independent variable), discusses the possibility of outliers that corrupt either the dependent or the independent variable, provides examples in which outliers produce misleading results, defines the breakdown point, and briefly introduces several methods for robust simple regression, including repeated median regression.[1][2] The second and third chapters analyze in more detail the least median of squares method for regression (in which one seeks a fit that minimizes the median of the squared residuals) and the least trimmed squares method (in which one seeks to minimize the sum of the squared residuals that are below the median). These two methods both have breakdown point 50% and can be applied for both simple regression (chapter two) and multivariate regression (chapter three).[1][5] Although the least median has an appealing geometric description (as finding a strip of minimum height containing half the data), its low efficiency leads to the recommendation that the least trimmed squares be used instead; least trimmed squares can also be interpreted as using the least median method to find and eliminate outliers and then using simple regression for the remaining data,[4] and approaches simple regression in its efficiency.[6] As well as describing these methods and analyzing their statistical properties, these chapters also describe how to use the authors' software for implementing these methods.[1] The third chapter also includes descriptions of some alternative estimators with high breakdown points.[7]
The fourth chapter describes one-dimensional estimation of a location parameter or central tendency and its software implementation, and the fifth chapter goes into more detail about the algorithms used by the software to compute these estimates efficiently. The sixth chapter concerns outlier detection, comparing methods for identifying data points as outliers based on robust statistics with other widely used methods, and the final chapter concerns higher-dimensional location problems as well as time series analysis and problems of fitting an ellipsoid or covariance matrix to data.[1][4][5][7] As well as using the breakdown point to compare statistical methods, the book also looks at their equivariance: for which families of data transformations does the fit for transformed data equal the transformed version of the fit for the original data?[6]
In keeping with the book's focus on applications, it features many examples of analyses done using robust methods, comparing the resulting estimates with the estimates obtained by standard non-robust methods.[3][7] Theoretical material is included, but set aside so that it can be easily skipped over by less theoretically inclined readers. The authors take the position that robust methods can be used both to check the applicability of ordinary regression (when the results of both methods agree) and to supplant them in cases where the results disagree.[5]
Audience and reception
The book is aimed at applied statisticians, with the goal of convincing them to use the robust methods that it describes.[1] Unlike previous work in robust statistics, it makes robust methods both understandable by and (through its associated software) available to practitioners.[3] No prior knowledge of robust statistics is required,[4] although some background in basic statistical techniques is assumed.[5] The book could also be used as a textbook,[5] although reviewer P. J. Laycock calls the possibility of such a use "bold and progressive"[4] and reviewers Seheult and Green point out that such a course would be unlikely to fit into British statistical curricula.[6]
Reviewers Seheult and Green complain that too much of the book acts as a user guide to the authors' software, and should have been trimmed.[6] However, reviewer Gregory F. Piepel writes that "the presentation is very good", and he recommends the book to any user of statistical methods.[1] And, while suggesting the reordering of some material, Karen Kafadar strongly recommends the book as a textbook for graduate students and a reference for professionals.[5] And reviewer A. C. Atkinson concisely summarizes the book as "interesting and important".[8]
Related books
There have been multiple previous books on robust regression and outlier detection, including:[5][7]
- Identification of Outliers by D. M. Hawkins (1980)
- Robust Statistics by Peter J. Huber (1981)
- Introduction to Robust and Quasi-Robust Statistical Methods by W. J. J. Rey (1983)
- Understanding Robust and Exploratory Data Analysis by David C. Hoaglin, Frederick Mosteller, and John Tukey (1983)
- Robust Statistics by Hampel, Ronchetti, Rousseeuw, and Stahel (1986)
In comparison, Robust Regression and Outlier Detection combines both robustness and the detection of outliers.[5] It is less theoretical, more focused on data and software, and more focused on the breakdown point than on other measures of robustness.[7] Additionally, it is the first to highlight the importance of "leverage", the phenomenon that samples with outlying values of the independent variable can have a stronger influence on the fit than samples where the independent variable has a central value.[8]
References
- ^ a b c d e f g h i j Piepel, Gregory F. (May 1989), "Review of Robust Regression and Outlier Detection", Technometrics, 31 (2): 260–261, doi:10.2307/1268828, JSTOR 1268828
- ^ a b c Sonnberger, Harold (July–September 1989), "Review of Robust Regression and Outlier Detection", Journal of Applied Econometrics, 4 (3): 309–311, JSTOR 2096530
- ^ a b c Weisberg, Stanford (July–August 1989), "Review of Robust Regression and Outlier Detection", American Scientist, 77 (4): 402–403, JSTOR 27855903
- ^ a b c d e Laycock, P. J. (1989), "Review of Robust Regression and Outlier Detection", Journal of the Royal Statistical Society, Series D (The Statistician), 38 (2): 138, doi:10.2307/2348319, JSTOR 2348319
- ^ a b c d e f g h Kafadar, Karen (June 1989), "Review of Robust Regression and Outlier Detection", Journal of the American Statistical Association, 84 (406): 617–618, doi:10.2307/2289958, JSTOR 2289958
- ^ a b c d Seheult, A. H.; Green, P. J. (1989), "Review of Robust Regression and Outlier Detection", Journal of the Royal Statistical Society, Series A (Statistics in Society), 152 (1): 133–134, doi:10.2307/2982847, JSTOR 2982847
- ^ a b c d e Yohai, V. J. (1989), "Review of Robust Regression and Outlier Detection", Mathematical Reviews and zbMATH, MR 0914792, Zbl 0711.62030
- ^ a b Atkinson, A. C. (June 1988), "Review of Robust Statistics and Robust Regression and Outlier Detection", Biometrics, 44 (2): 626–627, doi:10.2307/2531877, JSTOR 2531877