
The risk difference (RD), excess risk, or attributable risk[1] is the difference between the risk of an outcome in the exposed group and the unexposed group. It is computed as , where is the incidence in the exposed group, and is the incidence in the unexposed group. If the risk of an outcome is increased by the exposure, the term absolute risk increase (ARI) is used, and computed as . Equivalently, if the risk of an outcome is decreased by the exposure, the term absolute risk reduction (ARR) is used, and computed as .[2][3]


The inverse of the absolute risk reduction is the number needed to treat, and the inverse of the absolute risk increase is the number needed to harm.[2]
YouTube Encyclopedic
-
1/5Views:18 70434 85936 47366 239329 564
-
Relative risk and risk ratios
-
Calculating the risk ratio, odds ratio and risk difference in a randomised controlled trial
-
Odds Ratio, Relative Risk, Risk Difference | Statistics Tutorial #30| MarinStatsLectures
-
Epidemiology: Calculating Relative Risk
-
Relative Risk & Odds Ratios
Transcription
Usage in reporting
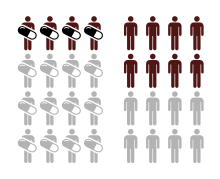
It is recommended to use absolute measurements, such as risk difference, alongside the relative measurements, when presenting the results of randomized controlled trials.[4] Their utility can be illustrated by the following example of a hypothetical drug which reduces the risk of colon cancer from 1 case in 5000 to 1 case in 10,000 over one year. The relative risk reduction is 0.5 (50%), while the absolute risk reduction is 0.0001 (0.01%). The absolute risk reduction reflects the low probability of getting colon cancer in the first place, while reporting only relative risk reduction, would run into risk of readers exaggerating the effectiveness of the drug.[5]
Authors such as Ben Goldacre believe that the risk difference is best presented as a natural number - drug reduces 2 cases of colon cancer to 1 case if you treat 10,000 people. Natural numbers, which are used in the number needed to treat approach, are easily understood by non-experts.[6]
Inference
Risk difference can be estimated from a 2x2 contingency table:
| Group | ||
|---|---|---|
| Experimental (E) | Control (C) | |
| Events (E) | EE | CE |
| Non-events (N) | EN | CN |
The point estimate of the risk difference is

The sampling distribution of RD is approximately normal, with standard error

The confidence interval for the RD is then


where is the standard score for the chosen level of significance[3]

Bayesian interpretation
We could assume a disease noted by , and no disease noted by , exposure noted by , and no exposure noted by . The risk difference can be written as


Numerical examples
Risk reduction
| Quantity | Experimental group (E) | Control group (C) | Total |
|---|---|---|---|
| Events (E) | EE = 15 | CE = 100 | 115 |
| Non-events (N) | EN = 135 | CN = 150 | 285 |
| Total subjects (S) | ES = EE + EN = 150 | CS = CE + CN = 250 | 400 |
| Event rate (ER) | EER = EE / ES = 0.1, or 10% | CER = CE / CS = 0.4, or 40% | — |
| Variable | Abbr. | Formula | Value |
|---|---|---|---|
| Absolute risk reduction | ARR | CER − EER | 0.3, or 30% |
| Number needed to treat | NNT | 1 / (CER − EER) | 3.33 |
| Relative risk (risk ratio) | RR | EER / CER | 0.25 |
| Relative risk reduction | RRR | (CER − EER) / CER, or 1 − RR | 0.75, or 75% |
| Preventable fraction among the unexposed | PFu | (CER − EER) / CER | 0.75 |
| Odds ratio | OR | (EE / EN) / (CE / CN) | 0.167 |
Risk increase
| Quantity | Experimental group (E) | Control group (C) | Total |
|---|---|---|---|
| Events (E) | EE = 75 | CE = 100 | 175 |
| Non-events (N) | EN = 75 | CN = 150 | 225 |
| Total subjects (S) | ES = EE + EN = 150 | CS = CE + CN = 250 | 400 |
| Event rate (ER) | EER = EE / ES = 0.5, or 50% | CER = CE / CS = 0.4, or 40% | — |
| Variable | Abbr. | Formula | Value |
|---|---|---|---|
| Absolute risk increase | ARI | EER − CER | 0.1, or 10% |
| Number needed to harm | NNH | 1 / (EER − CER) | 10 |
| Relative risk (risk ratio) | RR | EER / CER | 1.25 |
| Relative risk increase | RRI | (EER − CER) / CER, or RR − 1 | 0.25, or 25% |
| Attributable fraction among the exposed | AFe | (EER − CER) / EER | 0.2 |
| Odds ratio | OR | (EE / EN) / (CE / CN) | 1.5 |
See also
References
- ^ Porta M, ed. (2014). Dictionary of Epidemiology (6th ed.). Oxford University Press. p. 14. doi:10.1093/acref/9780199976720.001.0001. ISBN 978-0-19-939006-9.
- ^ a b Porta, Miquel, ed. (2014). "Dictionary of Epidemiology - Oxford Reference". Oxford University Press. doi:10.1093/acref/9780199976720.001.0001. ISBN 9780199976720. Retrieved 2018-05-09.
- ^ a b J., Rothman, Kenneth (2012). Epidemiology : an introduction (2nd ed.). New York, NY: Oxford University Press. pp. 66, 160, 167. ISBN 9780199754557. OCLC 750986180.
{{cite book}}: CS1 maint: multiple names: authors list (link) - ^ Moher D, Hopewell S, Schulz KF, Montori V, Gøtzsche PC, Devereaux PJ, Elbourne D, Egger M, Altman DG (March 2010). "CONSORT 2010 explanation and elaboration: updated guidelines for reporting parallel group randomised trials". BMJ. 340: c869. doi:10.1136/bmj.c869. PMC 2844943. PMID 20332511.
- ^ Stegenga, Jacob (2015). "Measuring Effectiveness". Studies in History and Philosophy of Biological and Biomedical Sciences. 54: 62–71. doi:10.1016/j.shpsc.2015.06.003. PMID 26199055.
- ^ Ben Goldacre (2008). Bad Science. New York: Fourth Estate. pp. 239–260. ISBN 978-0-00-724019-7.