
| |||||||||||||||||||||||||||||||||||||||||||||||||||||||||||||||||||||
All 646 seats in the House of Commons of the United Kingdom 324 seats needed for a majority | |||||||||||||||||||||||||||||||||||||||||||||||||||||||||||||||||||||
| Turnout | 61.4% | ||||||||||||||||||||||||||||||||||||||||||||||||||||||||||||||||||||
|---|---|---|---|---|---|---|---|---|---|---|---|---|---|---|---|---|---|---|---|---|---|---|---|---|---|---|---|---|---|---|---|---|---|---|---|---|---|---|---|---|---|---|---|---|---|---|---|---|---|---|---|---|---|---|---|---|---|---|---|---|---|---|---|---|---|---|---|---|---|
This lists parties that won seats. See the complete results below.
| |||||||||||||||||||||||||||||||||||||||||||||||||||||||||||||||||||||

This is the results breakdown of the 2005 general election.
YouTube Encyclopedic
-
1/5Views:106 24416 2196 928 7521 761251 900
-
United Kingdom General Election Results (1945-2017)
-
UK Parliamentary Elections, 1832 - 2005
-
Why the UK Election Results are the Worst in History.
-
Understanding the 2017 UK General Election
-
The 1945 UK General Election
Transcription
England

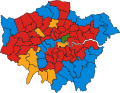
The average Labour vote in England declined by approximately 7% and by varying amounts in every English Region, but with sharp variations locally. The Labour vote fell sharply in safe Labour seats and in areas with large Muslim populations, yet a few constituencies saw slight Labour increases. In particular, the Labour vote declined dramatically in the northern half of London, where 11% of voters abandoned Labour for other parties; and in Bethnal Green and Bow, London, former Labour MP George Galloway, running as a candidate for the anti-war Respect Party, defeated Oona King (Labour) who in the previous General Election had a majority of 10,057. Following the result, a hostile interview with Jeremy Paxman attracted press attention. Labour lost the fewest votes in South West England, only 2.5%—but Labour's vote in South West England is historically poor. Notably, the Labour Party failed to take a single seat from another party. Labour polled seventy thousand fewer votes in England than the Conservatives, yet won ninety-two more seats,[1] attributed to the smaller average electorate in urban (usually pro-Labour) constituencies.
Labour regained one of its by-election losses, Leicester South, but saw an increased Liberal Democrat majority in the other, Brent East.
The Conservatives made gains in most regions of England, though their vote declined in some areas, notably East Midlands and Yorkshire (2% and 1.5% declines, respectively). However, even in regions where the Conservative vote declined, the Labour vote declined by a greater margin, allowing the Conservatives to make gains against Labour. Overall, the Conservatives gained approximately 1% of the vote in England from 2001. In Enfield Southgate, Conservative David Burrowes ousted Labour Stephen Twigg, who had famously defeated Michael Portillo for that seat in the 1997 elections.
The Liberal Democrats made modest gains in all regions of England, improving by at least 1% in every region. No particular region showed greatly expanded support for the Liberal Democrats though, continuing the trend of approximately equal showings in all regions of England for them and their "decapitation strategy" that targeted Conservative front-benchers failed, removing only Tim Collins in Westmorland and Lonsdale.
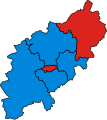
Former BBC presenter, Robert Kilroy-Silk, who had joined the UK Independence Party (UKIP) before leaving to set up Veritas, came fourth in Erewash in what was the best performance by Veritas, receiving 2,957 votes. The seat was won by Labour's Liz Blackman.
There were also regional surges in support for the British National Party, who however failed to win any seats, their highest poll being 16.9% in the Labour stronghold of Barking, East London. The party fielded 119 candidates in seats throughout the country, gaining 0.7% of the total votes cast. The 119 candidates fielded represented a significant rise as in 2001, the BNP only fielded 33 candidates, many of these constituencies such as Elmet no longer attracted UKIP, attracting other parties to take their former share of the vote.
The Green Party came third in Brighton Pavilion (with Keith Taylor as candidate) behind Labour and the Conservatives, taking 21.9% of the votes cast. Despite this unprecedented high share of the vote Taylor was not selected to contest the seat in the 2010 general election, losing his prospective position to Caroline Lucas.
The English Democrats gained their highest percentage of the vote, when former Sun newspaper columnist, Gary Bushell stood in Greenwich and Woolwich and gained 3.4% of votes cast.
The Independent Working Class Association stood for the first time in a general election, having previously only stood in local council elections. The party gained 2.1% of the vote in Oxford East, while the Official Monster Raving Loony Party took 3.6% of the vote in the same constituency.


Wales
The Labour Party lost approximately 6% of the vote across Wales, with losses varying by region. However, Labour managed to mitigate their losses in losing only five seats. The Conservatives returned MPs from Wales for the first time since 1997 with three Welsh seats on a slightly increased share of the vote. The Conservatives gained Clwyd West, Monmouth and Preseli Pembrokeshire.
The Liberal Democrats also improved their share of the vote slightly and won two additional seats, Cardiff Central from Labour and Ceredigion from Plaid Cymru. Plaid Cymru, the Welsh nationalist party, saw a slight decline in its vote, losing Ceredigion to the Liberal Democrats.
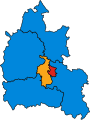
Peter Law, standing as an independent candidate in protest at the imposition of an all-women candidate shortlist by the national Labour Party, managed to overturn a Labour majority of 19,313 to win Blaenau Gwent.

Scotland
Changes
Several years after the Scottish Parliament had been established by the Scotland Act 1998, the target electorate (population) size of Westminster Parliamentary seats in Scotland was adjusted to bring it in line with England's constituencies. Before this reform Scotland had a smaller target electoral size per constituency resulting in more seats per head of population, which had been intended to compensate Scotland for its status as a nation, its lower population density (which causes larger constituencies geographically), its distance from the seat of Parliament in Westminster and finally, because prior to 1999 Scottish law had been wholly determined by the Westminster Parliament. These problems were perceived to have been addressed with the establishment of the Scottish Parliament in 1999.

The Boundary Commission for Scotland therefore produced a plan in 2003 in which there would be 59 constituencies, reduced from 72. In 2004, Parliament passed the Scottish Parliament (Constituencies) Act 2004 which instituted these changes and broke the link between British and Scottish Parliamentary constituencies.
Three constituencies were left unchanged — the island seats of Orkney and Shetland, the Western Isles, though the latter changed its official name to the Gaelic "Na h-Eileanan an Iar", and Eastwood, which changed its name to "East Renfrewshire". Several other new constituency names were also implemented; in all these cases the new seats had altered boundaries.
Predictions
Although it was impossible to guarantee a wholly accurate prediction of the strength of the parties within the 59 new Scottish constituencies, estimates had been made prior to the poll on 5 May on the basis of a ward-by-ward breakdown of local council election results. An agreed set used by all media reports and most political commentators suggested that had the new boundaries been in effect in the 2001 election, Labour would have won forty-six seats, the Liberal Democrats nine, the Scottish National Party four, and the Conservatives none. This would have represented a loss of ten seats for Labour and one each for the Liberal Democrats, Scottish National Party and the Conservatives. The arithmetic was however complicated by the fact that the boundary revision had produced some seats that were notionally highly marginal.
The results of the 2005 election showed some of the highest changes of the share of the vote for particular parties occurring in Scottish seats, leading some commentators to speculate that either the notional results were in error and/or they were unable to take into account factors such as tactical voting and people voting differently between General and Local Elections.
Results
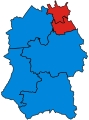
Labour won 41 seats, the Liberal Democrats 11, the Scottish National Party six, and in Dumfriesshire, Clydesdale and Tweeddale the Conservatives won their only Scottish seat.[2] Compared to the actual results of 2001 this meant a loss of fourteen seats for Labour, a gain of one seat for the SNP and Liberal Democrats, and no change for the Conservatives.[3]
Results in Scotland for Labour were also down, though less so than in England. Labour lost approximately 4% of the vote in East Scotland and approximately 6% of the vote in West Scotland. Labour's vote declined the most in the Edinburgh area and in the north of Scotland (where Labour lost all of its rural seats).
The Conservative vote declined marginally in both East and West Scotland, but the Conservatives nonetheless managed to win a seat in the South (Dumfriesshire, Clydesdale and Tweeddale), so maintaining their one Scottish seat in the Westminster Parliament. Having once been the largest party in Scotland (most recently in 1959), the 2001 and 2005 General Elections have done very little to reverse the downward trend that culminated in the 1997 loss of all eleven Conservative seats.
The Liberal Democrats made gains against Labour in both regions of Scotland and picked up a modest number of seats. On average, their vote rose approximately 5% across Scotland, though again this translated into few gains as the Liberal Democrat vote was not particularly concentrated.
The Scottish National Party's vote declined slightly across Scotland, but they managed to win one rural and one urban seat from Labour.
See also the list of parties standing in Scotland.
The Socialist Labour Party achieved its highest ever result in one constituency, gaining 14.5% of the votes cast in Glasgow North East

Northern Ireland
In Northern Ireland, the election was dominated in the unionist community by a battle between the Ulster Unionist Party (UUP) and the Democratic Unionist Party (DUP). In the nationalist community, the contest was largely between the Social Democratic and Labour Party (SDLP) and Sinn Féin.
The DUP and Sinn Féin emerged as the largest unionist and nationalist parties respectively, at the expense of the UUP and SDLP who both stood on a platform more favourable towards the Labour government's position on power sharing in Northern Ireland devolution. The UUP fared particularly badly, with leader David Trimble losing Upper Bann and resigning as party leader on 7 May, and the party's representation reduced to one seat, North Down, held by Sylvia Hermon continuing a trend of consolidation of the Unionist, especially UUP support to the DUP. Although the UUP won more MPs at the 2001 general election, the defection of Lagan Valley MP Jeffrey Donaldson to the DUP in January 2004 had already reversed the position.
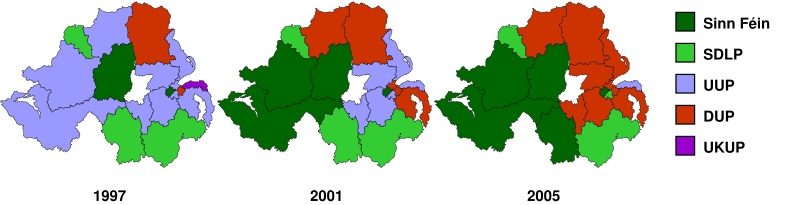
In the nationalist community, elections since 1992 have shown a clear shift in support from the SDLP to Sinn Féin. Two of the three SDLP MPs elected in 2001 had retired, while all four of the Sinn Féin MPs stood again. Sinn Féin's victory over the SDLP in Newry and Armagh, giving it a fifth seat, reduced the number of Northern Ireland MPs at Westminster as Sinn Féin members do not take their Westminster seats. The largest surprise in Northern Ireland came in South Belfast where the SDLP won the traditionally unionist seat, aided by a split between the two main unionist parties. This, together with their retention of two other seats did much to boost the SDLP's fortunes and morale when many commentators had been predicting a disaster as great as that which met the UUP.
References
- ^ "Election 2005 - Results, England". BBC News. 10 May 2005. Retrieved 21 July 2009.
- ^ "Election 2005 | Results | Scotland". BBC News. 23 May 2005. Retrieved 21 July 2009.
- ^ "General Election results, 7 June 2001" (PDF). Archived from the original (PDF) on 25 March 2009. Retrieved 21 July 2009.