
Reported Road Casualties Great Britain (RRCGB), formerly Road Casualties Great Britain (RCGB) and before that Road Accidents Great Britain (RAGB), is the official statistical publication of the UK Department for Transport (DfT) on traffic casualties, fatalities and related road safety data. This publication, first produced in 1951, is the primary source for data on road casualties in Great Britain. It is based primarily on police STATS19 data. Data has been collected since 1926.
The remainder of the UK casualty statistics, those from Northern Ireland, are reported separately by the PSNI.[1]
YouTube Encyclopedic
-
1/2Views:30750 059
-
Transportation is broken, Here's how we could fix it
-
Most SHOCKING Military Casualties of World War 2 - Episode 4 [Western Front]
Transcription
Published data
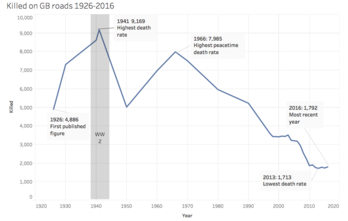
Data has been collected since 1926, in which year there were 4,886 fatalities in some 124,000 crashes.[n 1] Between 1951 and 2006 a total of 309,144 people were killed and 17.6 million were injured in accidents on British roads.[n 2] The highest number of deaths in any one year was 9,169 people in 1941 during World War II. The highest figure during peacetime was 7,985 in 1966.[n 3]
Figures for reported deaths, serious injuries and slight injuries have generally decreased since 1966. Since 1992, the ten-year drop in killed or seriously injured casualty numbers reported to the police, compared with the previous five-year average, has been about 40%.[2]
In 1987, the government set the first national casualty reduction target. The target set was that road casualties should drop by one-third by the year 2000 in comparison to the average numbers for the years 1981 to 1985. The target was exceeded, with the number of fatalities dropping by 39% and the number of serious injuries dropping by 45% over that period.[3]
In 1999, when Great Britain had the safest roads in Europe apart from Sweden, the government set a new national casualty reduction target, to be met by the year 2010. The target for 2010, compared to the average for the years 1994 to 1998, was a reduction of 40% in the number of people Killed or Seriously Injured (KSI) casualties, a reduction of 50% the number of children KSI casualties and a reduction of 10% in the rate of people slightly injured per 100 million vehicle kilometres.[3] By 2009, the results were: killed or seriously injured 44% lower; children killed or seriously injured 61% lower and the slight casualty rate was 37% lower.[n 4]
There is some concern about the completeness of the injury data and what can be concluded from it (see the Criticism section below). This table gives data for sample years:-
Annual summary
| Year | Killed | Serious injury | Slight injury | Total injury | ref | Note |
|---|---|---|---|---|---|---|
| 1926 | 4,886 | [n 1] | First year that national figures were published. | |||
| 1930 | 7,305 | 178,000 | [n 3] | |||
| 1940 | 8,609 | [n 3] | No figures for injured during World War II. | |||
| 1941 | 9,169 | [n 3] | Highest recorded fatality rate. | |||
| 1950 | 5,012 | 49,000 | 148,000 | 196,000 | [n 3][4] | |
| 1960 | 6,970 | 341,000 | [n 3] | |||
| 1966 | 7,985 | [n 3] | Highest recorded peacetime fatality rate. | |||
| 1970 | 7,499 | 356,000 | [n 3] | |||
| 1980 | 5,953 | 323,000 | [n 3] | |||
| 1990 | 5,217 | 60,000 | 275,000 | 336,000 | [n 3][4] | |
| 1997 | 3,599 | 324,000 | [n 3] | |||
| 1998 | 3,421 | 41,000 | 281,000 | 322,000 | [n 3][4] | |
| 1999 | 3,423 | 39,000 | 278,000 | 317,000 | [n 3][4] | |
| 2000 | 3,409 | 38,000 | 279,000 | 317,000 | [n 3][4] | |
| 2001 | 3,450 | 37,000 | 273,000 | 310,000 | [n 3][4] | |
| 2002 | 3,431 | 36,000 | 263,000 | 299,000 | [n 3][4] | |
| 2003 | 3,508 | 34,000 | 253,000 | 287,000 | [n 3][4] | |
| 2004 | 3,221 | 31,000 | 245,000 | 278,000 | [n 3][4] | |
| 2005 | 3,201 | 29,000 | 238,862 | 268,000 | [5] | |
| 2006 | 3,172 | 29,000 | 226,559 | 255,000 | [n 5] | |
| 2007 | 2,946 | 28,000 | 217,060 | 245,000 | [n 5] | |
| 2008 | 2,538 | 26,000 | 202,333 | 228,000 | [n 5] | |
| 2009 | 2,222 | 24,690 | 195,234 | 222,146 | [n 6] | |
| 2010 | 1,857 | 20,803 | 185,995 | 206,798 | [6] | Traffic levels fell by 2%. |
| 2011 | 1,901 | 23,122 | 178,927 | 203,950 | [7] | First increase in fatalities since 2001. Pedestrian fatalities increased by 12%, car occupants by 6%. They were lower for all other groups. |
| 2012 | 1,754 | 23,039 | 170,930 | 193,969 | [8] | 10% increase in deaths of cyclists[9] and increasing serious injuries of pedestrians. |
| 2013 | 1,713 | 21,657 | 160,300 | 181,957 | [10] | Lowest death rate since records began. |
| 2014 | 1,775 | 22,807 | 169,895 | 194,477 | [11] | Death and KSI rate rise for a 2nd time since 2001. |
| 2015 | 1,732 | 22,137 | 162,340 | 186,209 | [12] | Second lowest annual total on record after 2013. |
| 2016 | 1,792 | 24,101 | 155,491 | 179,592 | [13] | 4% rise in deaths to highest level since 2011.[14] |
| 2017 | 1,793 | 24,831 | 144,369 | 170,993 | [15] | |
| 2018 | 1,782 | 25,484 | 133,112 | 160,378 | [16] | |
| 2019 | 1,752 | 25,945 (30,144) | 125,461 (121,262) | 153,158 | [17] | Comparison of this figure with earlier years should be interpreted with caution due to changes in systems for severity reporting by some police forces. The numbers given in bold are adjusted estimates following methodology from the Office for National Statistics Methodology Advisory Service analysis accounting for change in severity reporting (see page 7).[18] |
| 2020 | 1,460 | 20,102 (22,069) | 92,055 (94,022) | 115,584 | [19] | Figures affected by Covid19 pandemic |
| 2021 | 1,558 | 23,363 (25,892) | 103,288 (100,759) | 128,209 | [20] | |
| 2022 (provisional) | 1,695 | (28,101) | (106,206) | 136,002 | [21] |
Casualties by road type in 2008
Casualties by severity, built-up, non built-up and on motorways.[n 7]
| Road type | Killed | Serious injury | Slight injury | Total injury | Ref. | Note |
|---|---|---|---|---|---|---|
| Non built-up (excludes motorways) | 1,323 | 8,342 | 48,810 | 58,475 | 52% of the total killed, 32% of total seriously injured, 25% of total with slight injuries | |
| Built-up | 1,057 | 16,823 | 143,079 | 160,959 | 42% of the total killed, 65% of total seriously injured, 70% of total with slight injuries | |
| Motorway | 158 | 869 | 10,444 | 11,471 | [citation needed] | "6% of the total killed, 3% of total seriously injured, 5% of total with slight injuries. Fatalities on motorways have decreased by 9% since 1994–98 in a period with traffic levels increased by 28%"[22] |
| All casualties | 2,538 | 26,034 | 202,333 | 230,905 | [23] |
STATS19 data collection system
The police collect details of all incidents which they attend or become aware of within 30 days which occur on the highway in which one or more person is killed or injured and involving one or more vehicles using the STATS19 data collection system.
STATS19 is the reference number for the police form used to record incidents.[24] STATS20 describes how to complete the form giving examples of how to correctly record different situations.[24] STATS21 describes how STATS19 data should be checked for accuracy.[24]
Additional information for RCGB is gathered from death registrations, coroners' reports and traffic and vehicle registrations.[25]
STATS19 data is used in European Union road safety studies.[26]
Criticism
Reported reduction in injury levels
The accuracy of the police STATS19 statistics, and thus much of the data published in the RCGB, and therefore its suitability for measuring trends in road casualties was examined in two studies in 2006 and has subsequently been commented on by the Department for Transport who concluded that the figures for deaths were accurate, however the actual total injuries is likely considerably higher than the reported figure, possibly three times higher.
A report published in the British Medical Journal in 2006 by M.Gill et al. compared police and Hospital Episode Statistics between 1996 and 2004 and concluded that although the police statistics showed a reduction in KSIs from 85.9 to 59.4 per 100,000 for the period the statistics for hospital admissions related to traffic accidents requiring hospital admission for the period did not. It concluded that the overall fall in police figures represented a fall in completeness of reporting of these injuries rather than an actual reduction of casualties.[27]
Also in 2006 a report prepared for the DfT by H. Ward et al. noted that although the figures for fatalities were normally accurate, with no significant under-reporting there was more uncertainty in the statistics relating to injury. They recommended that it was insufficient to rely solely on the STATS19 data or any other single data source because different databases showed different elements of the story and that "A system of data triangulation should be used to compare and understand trends in road casualties." They noted that the definition of seriously injured in police reports was at least partially subjective, and there was some under-reporting (though less than is the case for lesser injuries). The report also noted that there were changes to the method used to estimate vehicle mileages in 1995 which would affect direct comparisons of figures spanning this year.[28]
The Department for Transport acknowledged in their report for the year 2008 that a considerable proportion of non-fatal casualties are not known to the police. Based on additional sources including hospital records, surveys and compensation claims they estimate that the total number of road casualties in Great Britain each year is nearer to 800,000 (although this figure itself may be influenced by the growth in the so-called 'compensation culture'[according to whom?]). The UK government is not convinced however that the reductions in reported injury levels do not reflect an actual decline.[n 8] In 2008 the department changed the title of the report from "Road Casualties Great Britain" to "Reported Road Casualties Great Britain".[29]
Suppression of activity by vulnerable road users
Another independent report challenged the government's claim that falling casualty rates meant that roads were becoming "much safer". Mayer Hillman, John Adams and John Whitelegg suggest that roads may actually be felt to be sufficiently dangerous as to deter pedestrians from using them. They compared rates for those whose transport options are most limited, the elderly and children and found that:[30]
- Britain's child pedestrian safety record is worse than the average for Europe, in contrast to the better than average all-ages figure.
- Children's independent mobility is increasingly curtailed, with fear of traffic being cited as a dominant cause.
- Distances walked have declined more than in other European countries.
- Similar (though less well-defined) observations can be made regarding the elderly.
Notes
- ^ a b Department for Transport (2006), p. 92 'Road accident and casualty data was first collect on a national level in 1926. That year there were 4,886 recorded deaths in some 124,000 accidents'
- ^ Department for Transport (2006) p. 1 'Between 1951 and 2006, 309,144 people were killed and 17.6 million persons were injured in accidents on British roads'
- ^ a b c d e f g h i j k l m n o p q r Department for Transport (2008), p. 106 table 2
- ^ Department for Transport (2009) p. 8 Compared with the 1994 to 1998 average, in 2009: The number killed was 38% lower; The number of reported killed or seriously injured casualties was 44% lower; The number of children killed or seriously injured was 61% lower; and the slight casualty rate was 37% lower. In contrast, traffic rose by an estimated 15% over this period
- ^ a b c Department for Transport (2008), p. 6
- ^ Department for Transport (2009), p. 8 There were a total of 222,146 reported casualties of all severities, 4% lower than in 2008. 2,222 people were killed, 12% lower than in 2008, 24,690 were seriously injured (down 5%) and 195,234 were slightly injured (down 4%)
- ^ Department for Transport (2008), p. 121 table 12 'Reported accidents, vehicles and casualties: casualties by severity: by road class, built-up and non built-up roads: 2008'
- ^ Department for Transport (2008), p. 62. "It has long been known that a considerable proportion of non-fatal casualties are not known to the police and hospital, survey and compensation claims data all indicate a higher number of casualties than are reported ... Police data on road accidents (STATS19), whilst not perfect, remains the most detailed, complete and reliable single source of information on road casualties covering the whole of Great Britain, in particular for monitoring trends over time".
References
- References relating to Notes (above)
- Department for Transport (2006). "Road Casualties Great Britain: 2006 - Annual Report" (PDF). Road Casualties Great Britain. Archived from the original (PDF) on 9 February 2010. Retrieved 5 October 2010.
- Department for Transport (2008). "Reported Road Casualties Great Britain: 2008 Annual Report" (PDF). Road Casualties Great Britain. Archived from the original (PDF) on 12 September 2011. Retrieved 9 January 2010.
- Department for Transport (2009). "Reported Road Casualties Great Britain: 2009 Annual Report" (PDF). Road Casualties Great Britain. Retrieved 11 October 2010.
- Other references
- ^ "Road Traffic Collision Statistics". Police Service of Northern Ireland. Retrieved 11 July 2017.
- ^ Transport Statistics Great Britain: 2007 Edition (Report). Department for Transport.
- ^ a b Tomorrow's Roads: Safer for Everyone (Report). Department for Transport. 1999.
- ^ a b c d e f g h i "TSGB 2009 Chapter 8: Casualties by Type - data tables". Department for Transport. Retrieved 11 January 2010.
- ^ "Road Casualties Great Britain: 2005". Department for Transport. p. 6. Archived from the original on 9 February 2010. Retrieved 9 January 2010.
- ^ "Reported road casualties in Great Britain: main results 2010".
The number of people killed in road accidents reported to the police fell by 16% from 2,222 in 2009 to 1,857 in 2010. This the lowest figure since national records began in 1926. A total of 22,660 people were reported killed or seriously injured in 2010, 8% less than in 2009. There were 208,655 casualties (slight injuries, serious injuries and fatalities) in road accidents reported to the police in Great Britain in 2010, 6% less than in 2009. Motor vehicle traffic levels fell by 2% compared to 2009.
- ^ "Reported road casualties Great Britain: main results 2011". Department for Transport. Retrieved 28 June 2012.
- ^ "Reported road casualties Great Britain: main results 2012". Department for Transport. Retrieved 28 June 2012.
- ^ More Or Less, BBC Radio 4
- ^ "Reported road casualties Great Britain: main results 2013". Department for Transport. Retrieved 25 July 2014.
- ^ "Reported road casualties in Great Britain: main results 2014 - Publications - GOV.UK". www.gov.uk. Retrieved 14 April 2016.
- ^ "Reported road casualties in Great Britain, main results: 2015". www.gov.uk. Retrieved 9 October 2016.
- ^ "Reported road casualties Great Britain, annual report: 2016". www.gov.uk. Retrieved 29 September 2017.
- ^ "'Daily carnage' sees 4% rise in road deaths". Highways Magazine. 28 September 2017.
- ^ "Reported road casualties Great Britain, annual report: 2017" (PDF). www.gov.uk. Retrieved 10 November 2018.
- ^ "Reported road casualties Great Britain, annual report: 2018" (PDF). www.gov.uk. Retrieved 27 July 2019.
- ^ "Reported road casualties in Great Britain: 2019 annual report" (PDF). www.gov.uk. Retrieved 18 March 2021.
- ^ "Reported road casualties in Great Britain: 2019 annual report" (PDF). www.gov.uk. Retrieved 18 March 2021.
- ^ "Reported road casualties Great Britain, annual report: 2020". www.gov.uk. Retrieved 29 October 2021.
- ^ "Reported road casualties Great Britain, annual report: 2021". www.gov.uk. Retrieved 25 May 2023.
- ^ "Reported road casualties Great Britain, annual report: 2021". www.gov.uk. Retrieved 25 May 2023.
- ^ "Fatalities 2008" (PDF).
- ^ "Road Casualties in Great Britain Main Results: 2008" (PDF). Department for Transport. p. 6. Retrieved 21 April 2010.
- ^ a b c "STATS20" (PDF). Department for Transport. October 2004. Retrieved 19 January 2010.
- ^ "Road accident casualties: a comparison of STATS19 data with Hospital Episode Statistics" (PDF). Department for Transport. Retrieved 19 January 2010.
- ^ https://dspace.lboro.ac.uk/dspace-jspui/bitstream/2134/23705/1/Study%20on%20Serious%20Road%20Traffic%20Injuries%20in%20the%20EU.pdf[bare URL PDF]
- ^ Gill, Mike; Goldacre, Michael J.; Yeates, David G. R. (23 June 2006). "Changes in safety on England's roads: analysis of hospital statistics" (PDF). BMJ.
- ^ Ward, Heather; Lyons, Ronan; Thoreau, Roselle (June 2006). Road Safety Research Report No. 69: Under-reporting of Road Casualties – Phase 1 (PDF) (Report). UK Department for Transport.
- ^ "Road casualties in Great Britain: Annual reports". Department for Transport. Retrieved 22 April 2010.
- ^ One False Move. 1990. ISBN 0-85374-494-7. Retrieved 24 April 2012.
External links
- Road casualties in Great Britain: Annual reports
- STATS 19 defined at Office for National Statistics
- Department for Transport - Statistics