

In computational geometry, a power diagram, also called a Laguerre–Voronoi diagram, Dirichlet cell complex, radical Voronoi tesselation or a sectional Dirichlet tesselation, is a partition of the Euclidean plane into polygonal cells defined from a set of circles. The cell for a given circle C consists of all the points for which the power distance to C is smaller than the power distance to the other circles. The power diagram is a form of generalized Voronoi diagram, and coincides with the Voronoi diagram of the circle centers in the case that all the circles have equal radii.[1][2][3][4]
YouTube Encyclopedic
-
1/3Views:1 899 937209 8994 981 619
-
How Computers Calculate - the ALU: Crash Course Computer Science #5
-
SOLVING PER UNIT SYSTEM NUMERICAL AND IMPEDANCE DIAGRAM IN POWER YSTEM ANALYSIS
-
Lesson 1 - Voltage, Current, Resistance (Engineering Circuit Analysis)
Transcription
Definition

If C is a circle and P is a point outside C, then the power of P with respect to C is the square of the length of a line segment from P to a point T of tangency with C. Equivalently, if P has distance d from the center of the circle, and the circle has radius r, then (by the Pythagorean theorem) the power is d2 − r2. The same formula d2 − r2 may be extended to all points in the plane, regardless of whether they are inside or outside of C: points on C have zero power, and points inside C have negative power.[2][3][4]
The power diagram of a set of n circles Ci is a partition of the plane into n regions Ri (called cells), such that a point P belongs to Ri whenever circle Ci is the circle minimizing the power of P.[2][3][4]
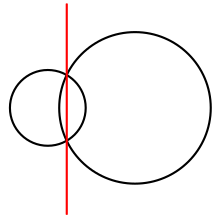
In the case n = 2, the power diagram consists of two halfplanes, separated by a line called the radical axis or chordale of the two circles. Along the radical axis, both circles have equal power. More generally, in any power diagram, each cell Ri is a convex polygon, the intersection of the halfspaces bounded by the radical axes of circle Ci with each other circle. Triples of cells meet at vertices of the diagram, which are the radical centers of the three circles whose cells meet at the vertex.[2][3][4]
Related constructions
The power diagram may be seen as a weighted form of the Voronoi diagram of a set of point sites, a partition of the plane into cells within which one of the sites is closer than all the other sites. Other forms of weighted Voronoi diagram include the additively weighted Voronoi diagram, in which each site has a weight that is added to its distance before comparing it to the distances to the other sites, and the multiplicatively weighted Voronoi diagram, in which the weight of a site is multiplied by its distance before comparing it to the distances to the other sites. In contrast, in the power diagram, we may view each circle center as a site, and each circle's squared radius as a weight that is subtracted from the squared Euclidean distance before comparing it to other squared distances. In the case that all the circle radii are equal, this subtraction makes no difference to the comparison, and the power diagram coincides with the Voronoi diagram.[3][4]
A planar power diagram may also be interpreted as a planar cross-section of an unweighted three-dimensional Voronoi diagram. In this interpretation, the set of circle centers in the cross-section plane are the perpendicular projections of the three-dimensional Voronoi sites, and the squared radius of each circle is a constant K minus the squared distance of the corresponding site from the cross-section plane, where K is chosen large enough to make all these radii positive.[5]
Like the Voronoi diagram, the power diagram may be generalized to Euclidean spaces of any dimension. The power diagram of n spheres in d dimensions is combinatorially equivalent to the intersection of a set of n upward-facing halfspaces in d + 1 dimensions, and vice versa.[3]
Algorithms and applications
Two-dimensional power diagrams may be constructed by an algorithm that runs in time O(n log n).[2][3] More generally, because of the equivalence with higher-dimensional halfspace intersections, d-dimensional power diagrams (for d > 2) may be constructed by an algorithm that runs in time .[3]

The power diagram may be used as part of an efficient algorithm for computing the volume of a union of spheres. Intersecting each sphere with its power diagram cell gives its contribution to the total union, from which the volume may be computed in time proportional to the complexity of the power diagram.[6]
Other applications of power diagrams include data structures for testing whether a point belongs to a union of disks,[2] algorithms for constructing the boundary of a union of disks,[2] and algorithms for finding the closest two balls in a set of balls.[7] It is also used for solving the semi-discrete optimal transportation problem[8] which in turn has numerous applications, such as early universe reconstruction[9] or fluid dynamics.[10]
History
Aurenhammer (1987) traces the definition of the power distance to the work of 19th-century mathematicians Edmond Laguerre and Georgy Voronoy.[3] Fejes Tóth (1977) defined power diagrams and used them to show that the boundary of a union of n circular disks can always be illuminated from at most 2n point light sources.[11] Power diagrams have appeared in the literature under other names including the "Laguerre–Voronoi diagram", "Dirichlet cell complex", "radical Voronoi tesselation" and "sectional Dirichlet tesselation".[12]
References
- ^ Linhart, J. (1981), "Dirichletsche Zellenkomplexe mit maximaler Eckenzahl", Geometriae Dedicata, 11 (3): 363–367, doi:10.1007/BF00149360, MR 0627538, S2CID 120072781.
- ^ a b c d e f g Imai, Hiroshi; Iri, Masao; Murota, Kazuo (1985), "Voronoĭ diagram in the Laguerre geometry and its applications", SIAM Journal on Computing, 14 (1): 93–105, doi:10.1137/0214006, MR 0774929.
- ^ a b c d e f g h i Aurenhammer, F. (1987), "Power diagrams: properties, algorithms and applications", SIAM Journal on Computing, 16 (1): 78–96, doi:10.1137/0216006, MR 0873251.
- ^ a b c d e Edelsbrunner, Herbert (1987), "13.6 Power Diagrams", Algorithms in Combinatorial Geometry, EATCS Monographs on Theoretical Computer Science, vol. 10, Springer-Verlag, pp. 327–328.
- ^ Ash, Peter F.; Bolker, Ethan D. (1986), "Generalized Dirichlet tessellations", Geometriae Dedicata, 20 (2): 209–243, doi:10.1007/BF00164401, MR 0833848, S2CID 120383767.
- ^ Avis, David; Bhattacharya, Binay K.; Imai, Hiroshi (1988), "Computing the volume of the union of spheres" (PDF), The Visual Computer, 3 (6): 323–328, doi:10.1007/BF01901190.
- ^ Guibas, Leonidas; Zhang, Li (1998), "Euclidean proximity and power diagrams", 10th Canadian Conference on Computational Geometry.
- ^ Aurenhammer, F.; Hoffmann, F.; Aronov, B. (January 1998). "Minkowski-Type Theorems and Least-Squares Clustering". Algorithmica. 20 (1): 61–76. doi:10.1007/PL00009187. ISSN 0178-4617. S2CID 5409198.
- ^ Levy, Bruno; Mohayaee, Roya; von Hausegger, Sebastian (2021-07-13). "A fast semidiscrete optimal transport algorithm for a unique reconstruction of the early Universe". Monthly Notices of the Royal Astronomical Society. 506 (1): 1165–1185. arXiv:2012.09074. doi:10.1093/mnras/stab1676. ISSN 0035-8711.
- ^ Lévy, Bruno (February 2022). "Partial optimal transport for a constant-volume Lagrangian mesh with free boundaries". Journal of Computational Physics. 451: 110838. arXiv:2106.03936. Bibcode:2022JCoPh.45110838L. doi:10.1016/j.jcp.2021.110838. S2CID 235406800.
- ^ Fejes Tóth, L. (1977), "Illumination of convex discs", Acta Mathematica Academiae Scientiarum Hungaricae, 29 (3–4): 355–360, doi:10.1007/BF01895856, MR 0464065, S2CID 122510545.
- ^ Aurenhammer, F.; Imai, H. (1988), "Geometric relations among Voronoĭ diagrams", Geometriae Dedicata, 27 (1): 65–75, doi:10.1007/BF00181613, MR 0950323.