

Power analysis is a form of side channel attack in which the attacker studies the power consumption of a cryptographic hardware device. These attacks rely on basic physical properties of the device: semiconductor devices are governed by the laws of physics, which dictate that changes in voltages within the device require very small movements of electric charges (currents). By measuring those currents, it is possible to learn a small amount of information about the data being manipulated.
Simple power analysis (SPA) involves visually interpreting power traces, or graphs of electrical activity over time. Differential power analysis (DPA) is a more advanced form of power analysis, which can allow an attacker to compute the intermediate values within cryptographic computations through statistical analysis of data collected from multiple cryptographic operations. SPA and DPA were introduced to the open cryptography community in 1998 by Paul Kocher, Joshua Jaffe and Benjamin Jun.[1]
YouTube Encyclopedic
-
1/3Views:75 46335 47422 874
-
Type I and II Errors, Power, Effect Size, Significance and Power Analysis in Quantitative Research
-
Power, Type II error, and Sample Size
-
01 - Instantaneous Power in AC Circuit Analysis (Electrical Engineering)
Transcription
Quantitative research is driven by research questions and hypotheses. For every hypothesis there is an unstated null hypothesis. The null hypothesis does not need to be explicitly stated because it is always the opposite of the hypothesis. In order to demonstrate that a hypothesis is likely true researchers need to compare it to the opposite situation. The research hypothesis will be about some kind of relationship between variables. The null hypothesis is the assertion that the variables being tested are not related and the results are the product of random chance events. Remember that null is kind of like no so a null hypothesis means there is no relationship. For example, if a researcher asks the question "Does having class for 12 hours in one day lead to nursing student burnout?" The hypothesis would indicate the researcher's best guess of the results: "A 12 hour day of classes causes nursing students to burn out." Therefore the null hypothesis would be that "12 hours of class in one day has nothing to do with student burnout." The only way of backing up a hypothesis is to refute the null hypothesis. Instead of trying to prove the hypothesis that 12 hours of class causes burnout the researcher must show that the null hypothesis is likely to be wrong. This rule means assuming that there is not relationship until there is evidence to the contrary. In every study there is a chance for error. There are two major types of error in quantitative research -- type 1 and 2. Logically, since they are defined as errors, both types of error focus on mistakes the researcher may make. Sometimes talking about type 1 and type 2 errors can be mentally tricky because it seems like you are talking in double and even triple negatives. It is because both type 1 and 2 errors are defined according to the researcher's decision regarding the null hypothesis, which assumes no relationship among variables. Instead of remembering the entire definition of each type of error just remember which type has to do with rejecting and which one is about accepting the null hypothesis. A type I error occurs when the researcher mistakenly rejects the null hypothesis. If the null hypothesis is rejected it means that the researcher has found a relationship among variables. So a type I error happens when there is no relationship but the researcher finds one. A type II error is the opposite. A type II error occurs when the researcher mistakenly accepts the null hypothesis. If the null hypothesis is accepted it means that the researcher has not found a relationship among variables. So a type II error happens when there is a relationship but the researcher does not find it. To remember the difference between these errors think about a stubborn person. Remember that your first instinct as a researcher may be to reject the null hypothesis because you want your prediction of an existing relationship to be correct. If you decide that your hypothesis is right when you are actually wrong a type I error has occurred. A type II error happens when you decide your prediction is wrong when you are actually right. It is much harder to convince a stubborn person that they are wrong, therefore it is the number 2 possibility. One way to help you remember the meaning of type 1 and 2 error is to find an example or analogy that helps you remember. As a nurse you may identify most with the idea of thinking about medical tests. A lot of teachers use the analogy of a court room when explaining type 1 and 2 errors. I thought students may appreciate our example study analogy regarding class schedules. It is impossible to know for sure when an error occurs, but researchers can control the likelihood of making an error in statistical decision making. The likelihood of making an error is related to statistical considerations that are used to determine the needed sample size for a study. When determining a sample size researchers need to consider the desired Power, expected Effect Size and the acceptable Significance level. Power is the probability that the researcher will make a correct decision to reject the null hypothesis when it is in reality false, therefore, avoiding a type II error. It refers to the probability that your test will find a statistically significant difference when such a difference actually exists. Another way to think about it is the ability of a test to detect an effect if the effect really exists. The more power a study has the lower the risk of a type II error is. If power is low the risk of a type II error is high. Logically, power increases as the sample size increases since you have collected more information, which makes it easier to correctly reject a null hypothesis. Other factors including the effect size and significance level also influence power. Usually power is set at 0.8 or greater before a study begins, meaning that you should have an 80% or greater chance of finding a statistically significant difference when there is one. This value is used to calculate the needed sample size for a study before it begins. A statistically significant result does not mean that there is an important or meaningful difference in the influence of one variable on another variable. It simply indicates that the researcher can be confident a difference exists. Particularly with large sample sizes even very small differences can be statistically significant. To determine how meaningful or important the difference is the effect size needs to be calculated. Effect sizes are a standardized measure of how large the influence of one variable is on another variable. Another way to look at it is the degree to which the null hypothesis is false. Before a study begins an effect size (either known or estimated) is used as a part of the power analysis in order to determine how large of a sample is needed to achieve a power ≥0.80. There are a variety of ways to calculate the effect size, which is measured in standard deviations. When interpreting or critiquing research the guidelines developed by Cohen are often used. However, keep in mind that these are simply guidelines. Effect sizes need to be interpreted within the context of the research. Statistical significance is used to determine how likely it is that the results of a study are due to chance. Before a study begins the alpha level is set at a value that represents the error rate that a researcher is willing to accept. Typically 0.05 is used, which means that if the null hypothesis is true it would only be rejected in 5 out of 100 trials. If a smaller risk of rejecting the null hypothesis is needed an alpha of 0.01 may also be used. You might wonder why we don't always use the lowest possible alpha value. It is because type 1 and type 2 errors are inversely related. If you decrease one you increase the other. People consider a type 1 error more serious which is why 0.05 is the minimum conventionally accepted level in most disciplines. Researchers need to accept a certain level of chance that they may be wrong. Before a study begins a balancing act occurs where researchers decide what values are appropriate for the study. Don't confuse alpha with p. Alpha levels are determined before the study begins. P values are calculated from sample data after the study has been completed. If the P value is less than the alpha value the null hypothesis is rejected and the results are statistically significant. Just because a study has statistically significant results does not mean the results will have practical significance. Statistically significant differences can always be found even for very small differences if the sample size is large enough. Practical significance relates to how relevant the findings are to the question being asked. For example, a study may find that there is a statistically significant difference in the lifespan of people who take a new drug compared to the old one. The statistically significant difference may be only a few hours and come with very severe side effects. Most people would say that the improvement in lifespan is not practically significant. Make sure you consider if the differences are big enough to have real meaning. It may help to go back and consider the effect size, among other things, to help you answer this question. A power analysis is most often used to calculate what sample size is needed. However, it can be used to calculate sample size, effect size, significance level or power if you have three of the four values. Since alpha is usually 0.5 and power is usually 0.8 researchers need to pay the most attention to the effect size in order to calculate the needed sample size. Thank you for watching. If you are looking for more information you are welcome to check out my eBook, website and related videos. Links are provided in the description.
Background
In cryptography, a side channel attack is used to extract secret data from some secure device (such as a smart card, tamper-resistant "black box", or integrated circuit). Side-channel analysis is typically trying to non-invasively extract cryptographic keys and other secret information from the device. A simple example of this is the German tank problem: the serial numbers of tanks provide details of the production data for tanks. In physical security, a non-invasive attack would be similar to lock-picking, where a successful attack leaves no trace of the attacker being present.
Simple power analysis
Simple power analysis (SPA) is a side-channel attack which involves visual examination of graphs of the current used by a device over time. Variations in power consumption occur as the device performs different operations. For example, different instructions performed by a microprocessor will have differing power consumption profiles.
Codeflow that depends on a secret value will thus leak the code-flow via the power consumption monitoring (and thus also leak the secret value). As a simple example, consider a password check as follows:
bool check_password(const char input[]){
  const char correct_password[] = "hunter2";

   if (strlen(input) != strlen(correct_password)) return false;

   for (int i = 0; i < strlen(correct_password); i++){
       if (input[i] != correct_password[i]) {
           return false;
       }
   }

   return true;
}
This password check potentially contains a Timing attack, since the execution time is not constant. The function may not output to the user an exploitable result however, as for example there could be a compensating delay before the response is returned. Observing the power consumption will make clear the number of loops executed.
Similarly, squaring and multiplication operations in RSA implementations can often be distinguished, enabling an adversary to compute the secret key. Even if the magnitude of the variations in power consumption are small, standard digital oscilloscopes can easily show the data-induced variations. Frequency filters and averaging functions (such as those built into oscilloscopes) are often used to filter out high-frequency components.
Differential power analysis
Differential power analysis (DPA) is a side-channel attack which involves statistically analyzing power consumption measurements from a cryptosystem. The attack exploits biases varying power consumption of microprocessors or other hardware while performing operations using secret keys. DPA attacks have signal processing and error correction properties which can extract secrets from measurements which contain too much noise to be analyzed using simple power analysis. Using DPA, an adversary can obtain secret keys by analyzing power consumption measurements from multiple cryptographic operations performed by a vulnerable smart card or other device.
High-order differential power analysis
High-Order Differential Power Analysis (HO-DPA) is an advanced form of DPA attack. HO-DPA enables multiple data sources and different time offsets to be incorporated in the analysis. HO-DPA is less widely practiced than SPA and DPA, as the analysis is complex and most vulnerable devices can be broken more easily with SPA or DPA.[2]
Power analysis and algorithmic security
Power analysis provides a way to "see inside" otherwise 'tamperproof' hardware. For example, DES's key schedule involves rotating 28-bit key registers. Many implementations check the least significant bit to see if it is a 1. If so, the device shifts the register right and prepends the 1 at the left end. If the bit is a zero, the register is shifted right without prepending a 1. Power analysis can distinguish between these processes, enabling an adversary to determine the bits of the secret key.
Implementations of algorithms such as AES and triple DES that are believed to be mathematically strong may be trivially breakable using power analysis attacks. As a result, power analysis attacks combine elements of algorithmic cryptanalysis and implementation security.
Standards and practical security concerns
For applications where devices may fall into the physical possession of an adversary, protection against power analysis is generally a major design requirement. Power analyses have also been reportedly used against conditional access modules used in pay television systems.[3]
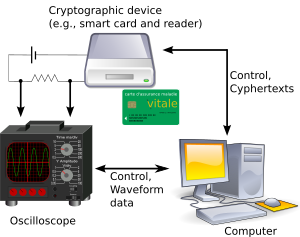
The equipment necessary for performing power analysis attacks is widely available. For example, most digital storage oscilloscopes provide the necessary data collection functionality, and the data analysis is typically performed using conventional PCs. Commercial products designed for testing labs are also available.[4] The open-source ChipWhisperer project was the first complete toolchain of open-source hardware & software for power analysis experiments.[5]
Preventing simple and differential power analysis attacks
Power analysis attacks cannot generally be detected by a device, since the adversary's monitoring is normally passive. In addition, the attack is non-invasive. As a result, physical enclosures, auditing capabilities, and attack detectors are ineffective. Instead, cryptosystem engineers must ensure that devices' power variations do not reveal information usable by adversaries.
Simple power analysis can easily distinguish the outcome of conditional branches in the execution of cryptographic software, since a device does different things (consuming different power) depending on whether the conditional branch is taken. For this reason, care should be taken to ensure there are no secret values which affect the conditional branches within cryptographic software implementations. Other sources of variation, such as microcode differences, branches introduced by compilers, and power consumption variations in multipliers, also commonly lead to SPA vulnerabilities.
Differential power analysis is more difficult to prevent, since even small biases in the power consumption can lead to exploitable weaknesses. Some countermeasure strategies involve algorithmic modifications such that the cryptographic operations occur on data that is related to the actual value by some mathematical relationship that survives the cryptographic operation. One approach involves blinding parameters to randomize their value. Other countermeasure strategies to reduce the effectiveness of DPA attacks involve hardware modifications: varying the chip internal clock frequency has been considered to desynchronize electric signals, which lead in return to algorithmic enhancements of traditional DPA.[6][7]
Patents
Many techniques to prevent SPA and DPA attacks have been proposed in the academic literature. While public key systems like RSA are typically protected by exploiting properties of the underlying algebraic structures (in the case of RSA this would be its multiplicatively homomorphic property), symmetrically keyed primitives like blockciphers require different methods, e.g., "masking".
Some companies, like RamBus claim intellectual property on DPA defense mechanisms.[8]
References
- ^ P. Kocher, J. Jaffe, B. Jun, Differential Power Analysis, technical report, 1998; later published in Advances in Cryptology – Crypto 99 Proceedings, Lecture Notes in Computer Science Vol. 1666, M. Wiener, ed., Springer-Verlag, 1999.
- ^ Paul Kocher, Joshua Jaffe, Benjamin Jun, "Introduction to Differential Power Analysis and Related Attacks (1998)"
- ^ "Home Page - Cyber-Piracy: The Truth". Archived from the original on 2002-11-13.
- ^ "DPA Workstation Analysis Platform". Rambus.
- ^ ChipWhisperer: An Open-Source Platform for Hardware Embedded Security Research
- ^ Xavier Charvet, Herve Pelletier, "Improving the DPA attack using wavelet transform (2005) Archived 2016-03-04 at the Wayback Machine"
- ^ Jasper van Woudenberg, Marc Witteman, Bram Bakker "Improving differential power analysis by elastic alignment (2011)"
- ^ "Licensed Countermeasures". Rambus.