
Papineau | |
|---|---|
 | |
| Coordinates: 45°53′N 75°03′W / 45.883°N 75.050°W[1] | |
| Country | |
| Province | |
| Region | Outaouais |
| Effective | January 1, 1983 |
| County seat | Papineauville |
| Government | |
| • Type | Prefecture |
| • Prefect | M. Benoit Lauzon |
| Area | |
| • Total | 3,205.90 km2 (1,237.80 sq mi) |
| • Land | 3,016.78 km2 (1,164.79 sq mi) |
| Population (2021)[3] | |
| • Total | 25,149 |
| • Density | 8.3/km2 (21/sq mi) |
| • Change 2016-2021 | |
| • Dwellings | 16,537 |
| Time zone | UTC−5 (EST) |
| • Summer (DST) | UTC−4 (EDT) |
| Area code | 819 |
| Website | www |
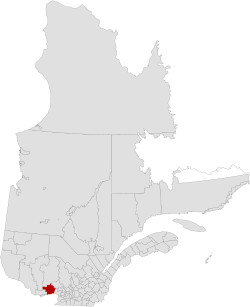
Papineau is a regional county municipality in the Outaouais region of Quebec, Canada. The seat is Papineauville.
YouTube Encyclopedic
-
1/5Views:2 2314275114 1293 881
-
Hauntings of the Manoir Papineau National Historic Site
-
Manoir Papineau: 360-degree bedroom view
-
canot-camping 2012 final
-
Quebec RV Adventure
-
Québec, Charlevoix, Saguenay-Lac-Saint-Jean: Your Snowmobile Destination
Transcription
Subdivisions
There are 25 subdivisions within the RCM:[2]
| Name | Type | Population (2016) |
Area (km2) |
Density (inhab./km2) |
|---|---|---|---|---|
| Boileau | Municipality | 335 | 136.33 | 2.5 |
| Bowman | Municipality | 658 | 129.30 | 5.1 |
| Chénéville | Municipality | 764 | 66.76 | 11.4 |
| Duhamel | Municipality | 430 | 434.57 | 1.0 |
| Fassett | Municipality | 431 | 12.49 | 34.5 |
| Lac-des-Plages | Municipality | 431 | 152.94 | 2.8 |
| Lac-Simon | Municipality | 944 | 97.48 | 9.7 |
| Lochaber | Township | 415 | 60.70 | 6.8 |
| Lochaber-Partie-Ouest | Township | 856 | 57.45 | 14.9 |
| Mayo | Municipality | 601 | 73.25 | 8.2 |
| Montebello | Municipality | 983 | 8.62 | 114.0 |
| Montpellier | Municipality | 985 | 249.14 | 4.0 |
| Mulgrave-et-Derry | Municipality | 369 | 293.75 | 1.3 |
| Namur | Municipality | 572 | 56.76 | 10.1 |
| Notre-Dame-de-Bonsecours | Municipality | 301 | 264.97 | 1.1 |
| Notre-Dame-de-la-Paix | Municipality | 648 | 106.62 | 6.1 |
| Notre-Dame-de-la-Salette | Municipality | 727 | 117.10 | 6.3 |
| Papineauville | Municipality | 2,101 | 61.33 | 34.3 |
| Plaisance | Municipality | 1,088 | 36.15 | 30.1 |
| Ripon | Municipality | 1,542 | 131.47 | 11.7 |
| Saint-André-Avellin | Municipality | 3,749 | 137.99 | 27.2 |
| Saint-Émile-de-Suffolk | Municipality | 477 | 56.68 | 8.4 |
| Saint-Sixte | Municipality | 469 | 85.33 | 5.5 |
| Thurso | City | 2,818 | 6.28 | 449.0 |
| Val-des-Bois | Municipality | 865 | 225.42 | 3.8 |
| Total | 22,832 | 2,941.79 | 7.8 | |
Demographics
In the 2021 Census of Population conducted by Statistics Canada, the RCM of Papineau had a population of 24,308 living in 11,504 of its 16,059 total private dwellings, a change of 6.5% from its 2016 population of 22,832. With a land area of 2,903.45 km2 (1,121.03 sq mi), it had a population density of 8.4/km2 (21.7/sq mi) in 2021.[4]
In 2021, the median age was 54.0, as opposed to 41.6 for all of Canada. French was the mother tongue of 91.2% of residents in 2021. The next most common mother tongues are English at 5.5% total, followed by Spanish and German at 0.2% each and by Portuguese at 0.1%. 1.9% reported both English and French as their first language. Additionally there were 0.1% who reported both French and a non-official language as their mother tongue and another 0.1% who reported both French, English and a non-official language as their mother tongue.
As of 2021, Indigenous peoples comprised 4.4% of the population, and visible minorities contributed 1.1%. The largest visible minority groups in the RCM of Papineau are Black (0.4%), Chinese (0.1%), and Arab (0.1%).
In 2021, 65.2% of the population identified as Catholic, while 26.1% said they had no religious affiliation. Baptists were the largest religious minority, making up 0.6% of the population. Buddhists were the largest non-Christian religious minority, making up just over 0.1% of the population.
| 2021 | 2016 | 2011 | |
|---|---|---|---|
| Population | 24,308 (+6.5% from 2016) | 22,832 (1.3% from 2011) | 22,541 (3.1% from 2006) |
| Land area | 2,903.45 km2 (1,121.03 sq mi) | 2,941.79 km2 (1,135.83 sq mi) | 2,941.82 km2 (1,135.84 sq mi) |
| Population density | 8.4/km2 (22/sq mi) | 7.8/km2 (20/sq mi) | 7.7/km2 (20/sq mi) |
| Median age | 54 (M: 54.4, F: 53.6) | 52.1 (M: 52.2, F: 52.0) | 49.9 (M: 49.8, F: 50.1) |
| Private dwellings | 11,505 (total) | 15,893 (total) | 14,569 (total) |
| Median household income | $51,196 | $44,308 |
| Year | Pop. | ±% |
|---|---|---|
| 1986 | 18,790 | — |
| 1991 | 19,526 | +3.9% |
| 1996 | 20,308 | +4.0% |
| 2001 | 20,367 | +0.3% |
| 2006 | 21,863 | +7.3% |
| 2011 | 22,541 | +3.1% |
| 2016 | 22,832 | +1.3% |
Mother tongue from Canada 2016 Census[3]
| Language | Population | Pct (%) |
|---|---|---|
| French only | 21,015 | 92.6% |
| English only | 1,150 | 5.1% |
| Both English and French | 250 | 1.1% |
| Other languages | 270 | 1.19% |
Transportation
Access Routes
Highways and numbered routes that run through the municipality, including external routes that start or finish at the county border:[10]
|
|
|
See also
References
- ^ "Reference number 141047 in Banque de noms de lieux du Québec". toponymie.gouv.qc.ca (in French). Commission de toponymie du Québec.
- ^ a b c "Geographic code 800 in the official Répertoire des municipalités". www.mamh.gouv.qc.ca (in French). Ministère des Affaires municipales et de l'Habitation.
- ^ a b c "Census Profile, 2021 Census: Papineau, Municipalité régionale de comté [Census division], Quebec + Notre-Dame-de-la-Salette, Municipalité [Census subdivision], Quebec". Statistics Canada. Retrieved May 16, 2023.
- ^ "Population and dwelling counts: Canada, provinces and territories, and census subdivisions (municipalities), Quebec". Statistics Canada. February 9, 2022. Retrieved May 16, 2023.
- ^ "2021 Community Profiles". 2021 Canadian Census. Statistics Canada. February 4, 2022. Retrieved 2022-04-27.
- ^ "2016 Community Profiles". 2016 Canadian Census. Statistics Canada. August 12, 2021. Retrieved 2019-12-20.
- ^ "2011 Community Profiles". 2011 Canadian Census. Statistics Canada. March 21, 2019. Retrieved 2019-12-20.
- ^ "2006 Community Profiles". 2006 Canadian Census. Statistics Canada. August 20, 2019.
- ^ "2001 Community Profiles". 2001 Canadian Census. Statistics Canada. July 18, 2021.
- ^ "Official Transport Quebec Road Map". Archived from the original on 2011-02-24. Retrieved 2009-05-30.
External links
Adjacent Counties & Equivalent Territories | |
|---|---|
| Regional county municipalities and equivalent territories | |
|---|---|
| Municipalities | |
| International | |
|---|---|
| National | |
| Geographic | |