
| |||||||||||||||||||||||||
All 18 Ohio seats to the United States House of Representatives | |||||||||||||||||||||||||
|---|---|---|---|---|---|---|---|---|---|---|---|---|---|---|---|---|---|---|---|---|---|---|---|---|---|
| |||||||||||||||||||||||||

| |||||||||||||||||||||||||
| Elections in Ohio |
|---|
 |
The 2006 United States House of Representatives elections in Ohio were held on Tuesday, November 7, 2006 to elect the 18 U.S. representatives from the state of Ohio, one from each of the state's 18 congressional districts. The elections coincided with the elections of other federal and state offices, including a gubernatorial election.
YouTube Encyclopedic
-
1/1Views:515
-
Democracy & Elections in the United States
Transcription
Overview
| United States House of Representatives elections in Ohio, 2006[1] | |||||||
|---|---|---|---|---|---|---|---|
| Party | Votes | Percentage | Seats before | Seats after | +/– | ||
| Republican | 1,870,460 | 47.22% | 12 | 11 | -1 | ||
| Democratic | 2,081,869 | 52.55% | 6 | 7 | +1 | ||
| Independent | 9,068 | 0.23% | 0 | 0 | - | ||
| Totals | 3,961,397 | 100% | 18 | 18 | — | ||
District 1
Primary results
| Party | Candidate | Votes | % | |
|---|---|---|---|---|
| Republican | Steve Chabot | 31,342 | 100 | |
| Party | Candidate | Votes | % | |
|---|---|---|---|---|
| Democratic | John Cranley | 17,344 | 100 | |
General election results
| Party | Candidate | Votes | % | |
|---|---|---|---|---|
| Republican | Steve Chabot (Incumbent) | 105,680 | 52.25 | |
| Democratic | John Cranley | 96,584 | 47.75 | |
| Total votes | 202,264 | 100 | ||
| Republican hold | ||||
District 2
Primary results
| Party | Candidate | Votes | % | |
|---|---|---|---|---|
| Republican | Jean Schmidt | 33,938 | 47.67 | |
| Republican | Bob McEwen | 30,297 | 42.56 | |
| Republican | Deborah A. Kraus | 4,433 | 6.23 | |
| Republican | James E. Constable | 2,526 | 3.55 | |
| Total votes | 71,194 | 100 | ||
| Party | Candidate | Votes | % | |
|---|---|---|---|---|
| Democratic | Victoria Wells Wulsin | 10,455 | 36.65 | |
| Democratic | Thor Jacobs | 6,535 | 22.91 | |
| Democratic | Jim Parker | 6,376 | 22.35 | |
| Democratic | Gaby Downey | 3,668 | 12.86 | |
| Democratic | Jeff Sinnard | 1,489 | 5.22 | |
| Total votes | 28,523 | 100 | ||
General election results
| Party | Candidate | Votes | % | |
|---|---|---|---|---|
| Republican | Jean Schmidt (Incumbent) | 120,112 | 50.45 | |
| Democratic | Victoria Wells Wulsin | 117,595 | 49.39 | |
| Independent | Nathan Noy (Write-in) | 298 | 0.13 | |
| Independent | James J. Condit, Jr. (Write-in) | 76 | 0.03 | |
| Total votes | 238,081 | 100 | ||
| Republican hold | ||||
District 3
Primary results
| Party | Candidate | Votes | % | |
|---|---|---|---|---|
| Republican | Mike Turner | 35,511 | 100 | |
| Party | Candidate | Votes | % | |
|---|---|---|---|---|
| Democratic | Stephanie Studebaker | 12,363 | 55.99 | |
| Democratic | Charles W. Sanders | 5,093 | 23.06 | |
| Democratic | David J. Fierst | 4,626 | 20.95 | |
| Total votes | 22,082 | 100 | ||
Studebaker withdrew her candidacy on August 15, 2006, following an arrest for a domestic dispute with her husband.[1]
A special primary election to fill the vacancy was held on September 15, 2006
Special primary results
| Party | Candidate | Votes | % | |
|---|---|---|---|---|
| Democratic | Richard Chema | 5,946 | 55.99 | |
| Democratic | Charles W. Sanders | 2,224 | 23.06 | |
| Total votes | 8,170 | 100 | ||
General election results
| Party | Candidate | Votes | % | |
|---|---|---|---|---|
| Republican | Mike Turner (Incumbent) | 127,978 | 58.54 | |
| Democratic | Richard Chema | 90,650 | 41.46 | |
| Total votes | 218,628 | 100 | ||
| Republican hold | ||||
District 4
Primary results
| Party | Candidate | Votes | % | |
|---|---|---|---|---|
| Republican | Jim Jordan | 38,017 | 50.57 | |
| Republican | Frank A. Guglielmi | 22,504 | 29.94 | |
| Republican | Kevin Nestor | 8,460 | 11.25 | |
| Republican | James R. Stahl | 2,596 | 3.45 | |
| Republican | Nathan J. Martin | 2,358 | 3.14 | |
| Republican | Charles W. Weasel | 1,239 | 1.65 | |
| Total votes | 75,174 | 100 | ||
| Party | Candidate | Votes | % | |
|---|---|---|---|---|
| Democratic | Richard E. Siferd | 26,591 | 36.65 | |
Endorsements
- Individuals
- Wesley Clark, General, 2004 democratic presidential candidate[5]
General election results
| Party | Candidate | Votes | % | |
|---|---|---|---|---|
| Republican | Jim Jordan | 129,958 | 59.99 | |
| Democratic | Richard E. Siferd | 86,678 | 40.01 | |
| Total votes | 216,636 | 100 | ||
| Republican hold | ||||
District 5
Primary results
| Party | Candidate | Votes | % | |
|---|---|---|---|---|
| Republican | Paul Gillmor | 54,168 | 100 | |
| Party | Candidate | Votes | % | |
|---|---|---|---|---|
| Democratic | Robin Weirauch | 28,373 | 100 | |
General election results
| Party | Candidate | Votes | % | |
|---|---|---|---|---|
| Republican | Paul Gillmor (Incumbent) | 129,813 | 56.85 | |
| Democratic | Robin Weirauch | 98,544 | 43.15 | |
| Total votes | 228,357 | 100 | ||
| Republican hold | ||||
District 6
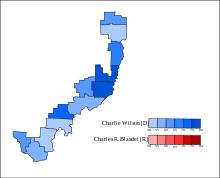
Primary results
| Party | Candidate | Votes | % | |
|---|---|---|---|---|
| Democratic | Charlie Wilson (Write-in) | 43,687 | 66.15 | |
| Democratic | Bob Carr | 14,900 | 22.56 | |
| Democratic | John Stephen Luchansky | 7,459 | 11.29 | |
| Total votes | 66,046 | 100 | ||
| Party | Candidate | Votes | % | |
|---|---|---|---|---|
| Republican | Chuck Blasdel | 18,519 | 47.31 | |
| Republican | Danny Harmon | 8,708 | 22.24 | |
| Republican | Tim Ginter | 7,606 | 19.43 | |
| Republican | Richard D. Stobbs | 4,315 | 11.02 | |
| Total votes | 39,148 | 100 | ||
General election results
| Party | Candidate | Votes | % | |
|---|---|---|---|---|
| Democratic | Charlie Wilson | 135,628 | 62.08 | |
| Republican | Chuck Blasdel | 82,848 | 37.92 | |
| Total votes | 218,476 | 100 | ||
| Democratic hold | ||||
District 7
Primary results
| Party | Candidate | Votes | % | |
|---|---|---|---|---|
| Republican | Dave Hobson | 49,808 | 100 | |
| Party | Candidate | Votes | % | |
|---|---|---|---|---|
| Democratic | William R. Conner | 20,648 | 100 | |
General election results
| Party | Candidate | Votes | % | |
|---|---|---|---|---|
| Republican | Dave Hobson (Incumbent) | 137,899 | 60.62 | |
| Democratic | William R. Conner | 89,579 | 39.38 | |
| Total votes | 227,478 | 100 | ||
| Republican hold | ||||
District 8
Primary results
| Party | Candidate | Votes | % | |
|---|---|---|---|---|
| Republican | John Boehner | 43,713 | 100 | |
| Party | Candidate | Votes | % | |
|---|---|---|---|---|
| Democratic | Mort Meier | 15,277 | 100 | |
General election results
| Party | Candidate | Votes | % | |
|---|---|---|---|---|
| Republican | John Boehner (Incumbent) | 136,863 | 63.80 | |
| Democratic | Mort Meier | 77,640 | 36.20 | |
| Total votes | 214,503 | 100 | ||
| Republican hold | ||||
District 9
Primary results
| Party | Candidate | Votes | % | |
|---|---|---|---|---|
| Democratic | Marcy Kaptur | 44,234 | 100 | |
| Party | Candidate | Votes | % | |
|---|---|---|---|---|
| Republican | Bradley S. Leavitt | 8,625 | 40.16 | |
| Republican | Ed Emery | 6,503 | 30.28 | |
| Republican | Dirk Kubala | 6,347 | 29.56 | |
| Total votes | 21,475 | 100 | ||
General election results
| Party | Candidate | Votes | % | |
|---|---|---|---|---|
| Democratic | Marcy Kaptur (Incumbent) | 153,880 | 73.63 | |
| Republican | Bradley S. Leavitt | 55,119 | 26.37 | |
| Total votes | 208,999 | 100 | ||
| Democratic hold | ||||
District 10
Primary results
| Party | Candidate | Votes | % | |
|---|---|---|---|---|
| Democratic | Dennis Kucinich | 51,485 | 76.42 | |
| Democratic | Barbara Ann Ferris | 15,890 | 23.58 | |
| Total votes | 67,375 | 100 | ||
| Party | Candidate | Votes | % | |
|---|---|---|---|---|
| Republican | Michael D. Dovilla | 15,270 | 65.16 | |
| Republican | Jason Werner | 8,166 | 34.84 | |
| Total votes | 23,436 | 100 | ||
General election results
| Party | Candidate | Votes | % | |
|---|---|---|---|---|
| Democratic | Dennis Kucinich (Incumbent) | 138,424 | 66.41 | |
| Republican | Michael D. Dovilla | 70,008 | 33.59 | |
| Total votes | 208,432 | 100 | ||
| Democratic hold | ||||
District 11
Primary results
| Party | Candidate | Votes | % | |
|---|---|---|---|---|
| Democratic | Stephanie Tubbs Jones | 55,319 | 100 | |
| Party | Candidate | Votes | % | |
|---|---|---|---|---|
| Republican | Lindsey N. String | 7,556 | 100 | |
General election results
| Party | Candidate | Votes | % | |
|---|---|---|---|---|
| Democratic | Stephanie Tubbs Jones (Incumbent) | 146,840 | 83.44 | |
| Republican | Lindsey N. String | 29,133 | 16.56 | |
| Total votes | 175,973 | 100 | ||
| Democratic hold | ||||
District 12
Primary results
| Party | Candidate | Votes | % | |
|---|---|---|---|---|
| Republican | Pat Tiberi | 76,457 | 100 | |
| Party | Candidate | Votes | % | |
|---|---|---|---|---|
| Democratic | Bob Shamansky | 19,387 | 43.32 | |
| Democratic | Patricia J. Shaffer | 13,815 | 30.87 | |
| Democratic | Edward S. Brown | 6,563 | 14.67 | |
| Democratic | Michael Reilly | 4,986 | 11.14 | |
| Total votes | 44,751 | 100 | ||
General election results
| Party | Candidate | Votes | % | |
|---|---|---|---|---|
| Republican | Pat Tiberi (Incumbent) | 145,943 | 57.30 | |
| Democratic | Bob Shamansky | 108,746 | 42.70 | |
| Total votes | 254,689 | 100 | ||
| Republican hold | ||||
District 13
Primary results
| Party | Candidate | Votes | % | |
|---|---|---|---|---|
| Democratic | Betty Sutton | 21,268 | 30.86 | |
| Democratic | Capri Cafaro | 16,915 | 24.54 | |
| Democratic | Thomas C. Sawyer | 14,837 | 21.53 | |
| Democratic | Gary Kucinich | 9,891 | 14.35 | |
| Democratic | Bill Grace | 3,537 | 5.13 | |
| Democratic | Michael Lyons | 1,030 | 1.49 | |
| Democratic | John L. Wolfe | 949 | 1.38 | |
| Democratic | Norbert G. Dennerll, Jr. | 495 | 0.72 | |
| Total votes | 68,922 | 100 | ||
| Party | Candidate | Votes | % | |
|---|---|---|---|---|
| Republican | Craig Foltin | 12,088 | 37.46 | |
| Republican | David McGrew | 7,079 | 21.94 | |
| Republican | Joe Ortega, III | 6,536 | 20.25 | |
| Republican | Paul S. Burtzlaff | 4,261 | 13.20 | |
| Republican | C.J. DeLorean | 2,306 | 7.15 | |
| Total votes | 32,270 | 100 | ||
General election results
| Party | Candidate | Votes | % | |
|---|---|---|---|---|
| Democratic | Betty Sutton | 135,643 | 61.22 | |
| Republican | Craig Foltin | 85,924 | 38.78 | |
| Total votes | 221,567 | 100 | ||
| Democratic hold | ||||
District 14
Primary results
| Party | Candidate | Votes | % | |
|---|---|---|---|---|
| Republican | Steve LaTourette | 38,137 | 100 | |
| Party | Candidate | Votes | % | |
|---|---|---|---|---|
| Democratic | Lewis R. Katz | 15,401 | 42.49 | |
| Democratic | Dale Virgil Blanchard | 11,313 | 31.21 | |
| Democratic | Palmer J. Peterson | 9,534 | 26.30 | |
| Total votes | 36,248 | 100 | ||
General election results
| Party | Candidate | Votes | % | |
|---|---|---|---|---|
| Republican | Steve LaTourette (Incumbent) | 144,069 | 57.55 | |
| Democratic | Lewis R. Katz | 97,754 | 39.05 | |
| Independent | Werner J. Lange | 8,500 | 3.40 | |
| Total votes | 250,323 | 100 | ||
| Republican hold | ||||
District 15
| |||||||||||||||||
| |||||||||||||||||
 County results Pryce: 60–70% Kilroy: 50–60% | |||||||||||||||||
| |||||||||||||||||


Primary results
| Party | Candidate | Votes | % | |
|---|---|---|---|---|
| Republican | Deborah Pryce | 44,020 | 100 | |
| Party | Candidate | Votes | % | |
|---|---|---|---|---|
| Democratic | Mary Jo Kilroy | 27,895 | 100 | |
General election results
| Party | Candidate | Votes | % | |
|---|---|---|---|---|
| Republican | Deborah Pryce (Incumbent) | 110,375 | 50.20 | |
| Democratic | Mary Jo Kilroy | 109,673 | 49.72 | |
| Independent | Bill Buckel (Write-in) | 194 | 0.09 | |
| Total votes | 220,242 | 100 | ||
| Republican hold | ||||
District 16
| |||||||||||||||||
| |||||||||||||||||
 County results Regula: 50–60% 60–70% | |||||||||||||||||
| |||||||||||||||||


Incumbent Representative Ralph Regula ran for re-election. He defeated Democrat Thomas Shaw with over 58% of the vote on election day.
Primary results
| Party | Candidate | Votes | % | |
|---|---|---|---|---|
| Republican | Ralph Regula | 32,526 | 58.40 | |
| Republican | Matt Miller | 23,170 | 41.60 | |
| Total votes | 55,696 | 100 | ||
| Party | Candidate | Votes | % | |
|---|---|---|---|---|
| Democratic | Thomas Shaw | 20,508 | 50.76 | |
| Democratic | Tom Mason | 19,897 | 49.24 | |
| Total votes | 40,405 | 100 | ||
General election results
| Party | Candidate | Votes | % | |
|---|---|---|---|---|
| Republican | Ralph Regula (Incumbent) | 137,167 | 58.34 | |
| Democratic | Thomas Shaw | 97,955 | 41.66 | |
| Total votes | 235,122 | 100 | ||
| Republican hold | ||||
District 17
| |||||||||||||||||
| |||||||||||||||||
 County results Ryan: 70–80% 80–90% | |||||||||||||||||
| |||||||||||||||||

Incumbent Representative Tim Ryan ran for re-election, facing Republican Don Manning II in the general election. Ryan defeated Manning by a wide margin, taking slightly over 80% of the vote.
Primary results
| Party | Candidate | Votes | % | |
|---|---|---|---|---|
| Democratic | Tim Ryan | 71,532 | 100 | |
| Party | Candidate | Votes | % | |
|---|---|---|---|---|
| Republican | Don Manning, II (Write-in) | 249 | 100 | |
General election results
| Party | Candidate | Votes | % | |
|---|---|---|---|---|
| Democratic | Tim Ryan (Incumbent) | 170,369 | 80.25 | |
| Republican | Don Manning II | 41,925 | 19.75 | |
| Total votes | 212,294 | 100 | ||
| Democratic hold | ||||
District 18
| |||||||||||||||||
| |||||||||||||||||
 County results Space: 50–60% 60–70% 70–80% Padgett: 50–60% | |||||||||||||||||
| |||||||||||||||||

Primary results
| Party | Candidate | Votes | % | |
|---|---|---|---|---|
| Democratic | Zack Space | 18,251 | 38.69 | |
| Democratic | Jennifer Stewart | 12,071 | 25.59 | |
| Democratic | Joe Sulzer | 11,340 | 24.04 | |
| Democratic | Ralph A. Applegate | 5,514 | 11.69 | |
| Total votes | 47,176 | 100 | ||
| Party | Candidate | Votes | % | |
|---|---|---|---|---|
| Republican | Bob Ney | 34,515 | 68.44 | |
| Republican | James Brodbelt Harris | 15,918 | 31.56 | |
| Total votes | 50,433 | 100 | ||
Special primary results
| Party | Candidate | Votes | % | |
|---|---|---|---|---|
| Republican | Joy Padgett | 9,523 | 67.71 | |
| Republican | James Brodbelt Harris | 2,113 | 15.02 | |
| Republican | Ray L. Feikert | 1,148 | 8.16 | |
| Republican | Ralph A. Applegate | 781 | 5.55 | |
| Republican | Jerry Firman | 500 | 3.55 | |
| Total votes | 14,065 | 100 | ||
General election results
| Party | Candidate | Votes | % | |||
|---|---|---|---|---|---|---|
| Democratic | Zack Space | 129,687 | 62.06 | |||
| Republican | Joy Padgett | 79,286 | 37.94 | |||
| Total votes | 208,973 | 100 | ||||
| Democratic gain from Republican | ||||||
References
- ^ a b c d e f g h i j k l m n o p q r s "U.S. House of Representatives: November 7, 2006". Ohio Secretary of State. Retrieved January 1, 2015.
- ^ a b c d e f g h i j k l m n o p q r "Republican U.S. House of Representatives: May 2, 2006". Ohio Secretary of State. Retrieved January 1, 2015.
- ^ a b c d e f g h i j k l m n o p q r "Democratic U.S. House of Representatives: May 2, 2006". Ohio Secretary of State. Retrieved January 1, 2015.
- ^ "Democratic Representative to Congress - 3rd District: September 15, 2006". Ohio Secretary of State. Retrieved January 1, 2015.
- ^ Archived copy Archived November 4, 2006, at the Wayback Machine
- ^ "Republican Representative to Congress - 18th District: September 14, 2006". Ohio Secretary of State. Retrieved January 1, 2015.