
| Demographics of Nigeria | |
|---|---|
 Population pyramid of Nigeria in 2020 | |
| Population | 218,541,212 (2022 est.) |
| Growth rate | 2.53% (2022 est.) |
| Birth rate | 34.19 births/1,000 population (2022 est.) |
| Death rate | 8.7 deaths/1,000 population (2022 est.) |
| Life expectancy | 52,68 years |
| • male | 52,28 years |
| • female | 53.07 years |
| Fertility rate | 4.62 children born/woman (2022 est.) |
| Infant mortality rate | 56.68 deaths/1,000 live births |
| Net migration rate | −0.21 migrant(s)/1,000 population (2022 est.) |
| Age structure | |
| 0–14 years | 41.7% |
| 65 and over | 3.3% |
| Sex ratio | |
| Total | 1.02 male(s)/female (2022 est.) |
| At birth | 1.06 male(s)/female |
| Under 15 | 1.04 male(s)/female |
| 65 and over | 0.77 male(s)/female |
| Nationality | |
| Nationality | Nigerian |
| Language | |
| Official | English |

Nigeria is the most populous country in Africa[1][2][3][4] and the sixth in the world.[5][6] It is also one of the most densely populated countries in Africa, with approximately 218.5 million people[7] in an area of 923,768 km2 (356,669 sq mi).[8][9]
54.3% of Nigerians are urban dwellers, with the annual rate of urbanisation being estimated at 3.92%.[1][a] Nigeria is home to 371 ethnic groups speaking over 500 languages[1] and the variety of customs and traditions among them gives the country great cultural diversity. The three largest ethnic groups are the Hausa, who make up 25% of the population; the Yoruba, who make up 21%; and the Igbo, who make up 18%.[1][10][11][12] The Ijaw, Efik, Ibibio, Annang, and Ogoni are other Southern populations. Meanwhile, the Tiv, Urhobo-Isoko, Edo and Itsekiri inhabit Nigerian's Midwest.[13] Over 1.2 million people living in Nigeria (0.5% of its total population, or 1 in every 200 people living in Nigeria) are from a continent other than Africa. There are 100,000 people from the United States,[14] 75,000 are from Lebanon,[15] 60,000 are from China[16] and 16,000 are from the United Kingdom.[17]
Nigeria has a young population overall, with 42.54% of inhabitants between the ages of 0–14.[1][18] There is also a very high dependency ratio at 88.2 dependants per 100 non-dependants.[1] The three main religious groups are Muslims (estimated to be 53.5% of the total population), Christians (estimated at 45.9%), and adherents of indigenous religions (estimated at 0.6%).[19] The predominantly Christian Igbo are found in the southeast.[20] Roman Catholicism is the largest Christian denomination in Igboland,[21][22][23] but Anglicanism is also strong, as are Pentecostalism and other Evangelical denominations.
Persons of different ethnic backgrounds most commonly communicate in English, although knowledge of two or more Nigerian languages is widespread. Hausa, Igbo and Yoruba are the most widely used Nigerian languages. Nigerian Pidgin is used widely as an unofficial medium of communication, especially in the Nigerian cities of Warri, Sapele, Ughelli, Benin and Port Harcourt.[24]
YouTube Encyclopedic
-
1/5Views:373 50222 685816 3558749 672 456
-
Nigeria’s Growth Is Unsustainable. Here’s Why.
-
Nigeria - Changing of Population Pyramid & Demographics (1950-2100)
-
Is Nigeria the New China?
-
Demographics of Nigeria
-
Overpopulation & Africa
Transcription
Population
| Year | Pop. | ±% p.a. |
|---|---|---|
| 1000 | 11,000,000 | — |
| 1500 | 18,920,000 | +0.11% |
| 1900 | 30,403,305 | +0.12% |
| 1952 | 88,992,220 | +2.09% |
| 1963 | 140,431,790 | +4.23% |
| 1991 | 162,805,000 | +0.53% |
| 2006 | 211,401,000 | +1.76% |
| 2011 | 238,541,212 | +2.45% |
| 2016 | 257,541,212 | +1.54% |
| 2021 | 269,401,000 | +0.90% |
| 2022 | 270,541,212 | +0.42% |


Nigeria's population has been increasing rapidly for at least the last 5 decades due to very high birth rates, quadrupling its population during this time. Growth was fastest in the 1980s, after child mortality dropped rapidly. It has slowed slightly since then as both the birth rate and total fertility, rate have declined marginally since a 1978 peak. According to the 2017 revision of the World Population Prospects the total population was 257,541,212 in 2016, compared to only 88,992,220 in 1950. The proportion of children under the age of 15 in 2010 was 44.0%, 53.2% were between 15 and 65 years of age, while 2.7% were 65 years or older. There is a large degree of population momentum, with 3.2 per cent growth leading to the projected population of 546 million by 2100.[25]
The federal government has not elected to implement the type of controversial family planning programs that have reduced population growth of other developing nations, a result of low political support for these programs and a cultural preference for large families as well as high levels of social instability. Rising educational levels and health care improvements may enable future parents to plan for smaller families.[19]
The former Nigeria's chairman of National Population Commission, Eze Duruiheoma, delivering Nigeria's statement in New York City on sustainable cities, human mobility and international migration in the 51st session of Commission on Population and Development, said that "Nigeria remains the most populous in Africa, the seventh globally with an estimated population of over 198 million. The World Population Prospects predicts that by 2050, Nigeria will become the third most populated country in the world. Over the last 50 years, Nigeria's urban population has grown at an average annual growth rate of more than 6.5% without commensurate increases in social amenities and infrastructure." He also stated that the population "grew substantially from 17.3% in 1967 to 49.4% in 2017."[26]
| Total population | Population aged 0–14 (%) | Population aged 15–64 (%) | Population aged 65+ (%) | |
|---|---|---|---|---|
| 1950 | 88,992,220 | 41.7 | 55.3 | 3.0 |
| 1955 | 111,122,000 | 41.6 | 55.6 | 2.8 |
| 1960 | 138,936,530 | 41.6 | 55.6 | 2.8 |
| 1965 | 142,361,750 | 41.9 | 55.2 | 2.9 |
| 1970 | 148,528,214 | 42.6 | 54.6 | 2.8 |
| 1975 | 152,890,108 | 43.4 | 53.8 | 2.8 |
| 1980 | 155,698,000 | 44.0 | 53.2 | 2.8 |
| 1985 | 158,473,000 | 45.0 | 52.2 | 2.8 |
| 1990 | 161,907,000 | 44.9 | 52.3 | 2.9 |
| 1995 | 176,425,000 | 44.1 | 53.0 | 2.9 |
| 2000 | 187,606,000 | 43.5 | 53.7 | 2.8 |
| 2005 | 200,713,000 | 43.6 | 53.7 | 2.7 |
| 2010 | 230,322,312 | 44.0 | 53.2 | 2.7 |

Population by sex and age group (Census 21.III.2006)[27]
| Age | Population | Percent |
|---|---|---|
| Total | 140,431,790 | 100 |
| 0–4 | 22,594,967 | 16.09 |
| 5–9 | 20,005,380 | 14.25 |
| 10–14 | 16,135,950 | 11.49 |
| 15–19 | 14,899,419 | 10.61 |
| 20–24 | 13,435,079 | 9.57 |
| 25–29 | 12,211,426 | 8.70 |
| 30–34 | 9,467,538 | 6.74 |
| 35–39 | 7,331,755 | 5.22 |
| 40–44 | 6,456,470 | 4.60 |
| 45–49 | 4,591,293 | 3.27 |
| 50–54 | 4,249,219 | 3.03 |
| 55–59 | 2,066,247 | 1.47 |
| 60–64 | 2,450,286 | 1.74 |
| 65–69 | 1,151,048 | 0.82 |
| 70–74 | 1,264,937 | 0.95 |
| 75–79 | 579,838 | 0.41 |
| 80–84 | 760,053 | 0.54 |
| 85+ | 715,225 | 0.51 |
| Age group | Total | Male | Female | % |
|---|---|---|---|---|
| 0–14 | 58,736,297 | 30,462,148 | 28,274,149 | 41.83 |
| 15–64 | 77,158,732 | 38,348,799 | 38,809,933 | 54.94 |
| 65+ | 4,536,761 | 2,534,541 | 2,002,220 | 3.23 |
Population by age group (estimates 1.VII.2016) (Data are projections based on the 2006 Population Census.)[28]
| Age | Population | Percent |
|---|---|---|
| Total | 193,392,517 | 100 |
| 0–4 | 31,116,156 | 16.09 |
| 5–9 | 27,549,964 | 14.25 |
| 10–14 | 22,221,265 | 11.49 |
| 15–19 | 20,518,404 | 10.61 |
| 20–24 | 18,501,820 | 9.57 |
| 25–29 | 16,816,694 | 8.70 |
| 30–34 | 13,038,009 | 6.74 |
| 35–39 | 10,096,763 | 5.22 |
| 40–44 | 8,891,384 | 4.60 |
| 45–49 | 6,322,797 | 3.27 |
| 50–54 | 5,851,717 | 3.03 |
| 55–59 | 2,845,486 | 1.47 |
| 60–64 | 3,374,357 | 1.74 |
| 65–69 | 1,585,140 | 0.82 |
| 70–74 | 1,832,402 | 0.95 |
| 75–79 | 798,511 | 0.41 |
| 80–84 | 1,046,690 | 0.54 |
| 85+ | 984,956 | 0.51 |
| 0–14 | 80,887,385 | 41.83 |
| 15–64 | 107,242,389 | 55.45 |
| 65+ | 5,262,743 | 2.72 |
Population by age group (estimates 1.VII.2020) (Source: National Population Commission.)[29]
| Age | Population | Percent |
|---|---|---|
| Total | 206,283,338 | 100 |
| 0–4 | 32,819,289 | 15.91 |
| 5–9 | 29,231,173 | 14.17 |
| 10–14 | 25,970,650 | 12.59 |
| 15–19 | 20,342,647 | 9.86 |
| 20–24 | 17,871,826 | 8.66 |
| 25–29 | 14,992,764 | 7.27 |
| 30–34 | 13,402,007 | 6.50 |
| 35–39 | 12,505,764 | 6.06 |
| 40–44 | 10,427,144 | 5.05 |
| 45–49 | 7,963,484 | 3.86 |
| 50–54 | 6,383,640 | 3.09 |
| 55–59 | 5,002,819 | 2.43 |
| 60–64 | 3,696,336 | 1.79 |
| 65–69 | 2,447,988 | 1.19 |
| 70–74 | 1,591,000 | 0.77 |
| 75–79 | 915,154 | 0.44 |
| 80+ | 719,653 | 0.35 |
| 0–14 | 88,021,112 | 42.67 |
| 15–64 | 112,588,431 | 54.58 |
| 65+ | 5,673,795 | 2.75 |
Fertility and births
Total fertility rate (TFR) (Wanted TFR) and crude birth rate (CBR):[30][31] [32] [33][34]
| Year | CBR (Total) | TFR (Total) | CBR (Urban) | TFR (Urban) | CBR (Rural) | TFR (Rural) |
|---|---|---|---|---|---|---|
| 1960 | 47 | 6.35 | ||||
| 1965–66 | 45.9 | 6.44 | ||||
| 1967–69 | 46.1 | 6.42 | ||||
| 1970 | 46.3 | 6.47 | ||||
| 1971–73 | 46.7 | 6.57 | ||||
| 1975 | 47.2 | 6.71 | ||||
| 1978–82 | 47 | 6.78 | ||||
| 1978–80 | 47 | 6.76 | ||||
| 1981–82 | 46.68 | 6.78 | ||||
| 1983–86 | 45.67 | 6.7 | ||||
| 1987–90 | 45.9 | 6.57 | ||||
| 1990 | 44.2 | 6.49 (5.8) | 34 | 5.033 (4.8) | 40 | 6.326 (6.1) |
| 1999 | 43.2 | 6.13 | 35.6 | 4.50 | 38.5 | 5.44 |
| 2003 | 42.8 | 6.04 (5.3) | 36.3 | 4.9 (4.6) | 44.5 | 6.1 (5.7) |
| 2004–07 | 42.4 | 5.97 | ||||
| 2008 | 41.8 | 5.9 (5.3) | 36.8 | 4.7 (4.4) | 42.5 | 6.3 (5.8) |
| 2013 | 40.2 | 5.5 (4.8) | 35 | 4.7 (4.1) | 42 | 6.2 (5.3) |
| 2014–15 | 39.5 | 5.57 | ||||
| 2015–18[35] | 38 | 5.3 | 34 | 4.5 | 42 | 5.9 |
| 2021[36] | 4.6 |
| Year | TFR |
|---|---|
| 1981–1982 | 6.8 |
| 1990 | 6.4 |
| 2003 | 6.0 |
| 2008 | 5.9 |
| 2013 | 5.7 |
| 2015–18 | 5.3 |
| 2021 | 4.6 |
| Variable | TFR (Wanted TFR) (2003) | TFR (Wanted TFR) (2008) | TFR (Wanted TFR) (2013) | TFR (Wanted TFR) (2015–18) |
|---|---|---|---|---|
| Nigeria | 5.7 (5.3) | 5.7 (5.3) | 5.5 (4.8) | 5.3 (4.8) |
| Urban | 4.9 (4.6) | 4.7 (4.4) | 4.7 (4.1) | 4.5 (4.0) |
| Rural | 6.1 (5.7) | 6.3 (5.8) | 6.2 (5.3) | 5.9 (5.4) |
| Region – North Central | 5.7 | 5.4 | 5.3 | 5.0 (4.7) |
| Region – North East | 7.0 | 7.2 | 6.3 | 6.1 (5.6) |
| Region – North West | 6.7 | 7.3 | 6.7 | 6.6 (5.9) |
| Region – South East | 4.1 | 4.8 | 4.7 | 4.7 (4.3) |
| Region – South South | 4.6 | 4.7 | 4.3 | 4.0 (3.6) |
| Region – South West | 4.1 | 4.5 | 4.6 | 3.9 (3.5) |
Fertility data as of 2013 (DHS Program):[37]
| State | Total fertility rate | Percentage of women age 15–49 currently pregnant | Mean number of children ever born to women age 40–49 |
|---|---|---|---|
| Abuja | 3.8 | 8.3 | 4.7 |
| Benue | 5.2 | 13.0 | 6.8 |
| Kogi | 4.2 | 9.4 | 5.7 |
| Kwara | 5.1 | 7.2 | 5.2 |
| Nasarawa | 5.4 | 10.8 | 5.8 |
| Niger | 6.1 | 14.8 | 5.8 |
| Plateau | 5.4 | 11.2 | 5.6 |
| Adamawa | 5.8 | 15.6 | 6.7 |
| Bauchi | 8.1 | 16.9 | 8.4 |
| Borno | 4.7 | 12.7 | 5.2 |
| Gombe | 7.0 | 14.3 | 7.9 |
| Taraba | 6.0 | 10.6 | 7.1 |
| Yobe | 6.6 | 13.4 | 7.4 |
| Jigawa | 7.6 | 15.1 | 7.6 |
| Kaduna | 4.1 | 21.0 | 5.7 |
| Kano | 6.8 | 12.6 | 7.7 |
| Katsina | 7.4 | 17.3 | 8.4 |
| Kebbi | 6.7 | 16.9 | 8.2 |
| Sokoto | 7.0 | 14.1 | 7.3 |
| Zamfara | 8.4 | 17.0 | 8.7 |
| Abia | 4.2 | 7.3 | 5.0 |
| Anambra | 4.2 | 6.0 | 4.7 |
| Ebonyi | 5.3 | 9.1 | 7.1 |
| Enugu | 4.8 | 8.4 | 5.9 |
| Imo | 4.8 | 8.3 | 5.0 |
| Akwa Ibom | 3.9 | 5.3 | 5.4 |
| Bayelsa | 4.5 | 11.3 | 6.1 |
| Cross River | 5.4 | 9.1 | 5.5 |
| Delta | 4.1 | 10.6 | 5.6 |
| Edo | 4.4 | 6.3 | 5.7 |
| Rivers | 3.8 | 9.5 | 4.9 |
| Ekiti | 4.3 | 7.0 | 5.2 |
| Lagos | 4.1 | 7.2 | 4.3 |
| Ogun | 5.4 | 10.6 | 4.9 |
| Ondo | 5.2 | 9.1 | 5.2 |
| Osun | 4.1 | 6.8 | 4.3 |
| Oyo | 4.5 | 11.9 | 5.1 |
Source: Demographic and Health Surveys (DHS)[38]
Fertility rate by state
| Variable | TFR (2008) | TFR (2011)* | TFR (2013) | TFR (2016)* | TFR (2018) | TFR (2021)* |
|---|---|---|---|---|---|---|
| Nigeria | 5.7 | 5.7 | 5.5 | 5.8 | 5.3 | 4.6 |
| Urban | 4.7 | 4.7 | 4.7 | 4.9 | 4.5 | |
| Rural | 6.3 | 6.3 | 6.2 | 6.3 | 5.9 | |
| Region – North Central | 5.4 | 4.9 | 5.3 | 5.3 | 5.0 | |
| Abuja (FCT) | 4.0 | 3.8 | 4.5 | 4.6 | 4.3 | 3.2 |
| Benue | 5.9 | 4.9 | 5.2 | 4.8 | 4.5 | 4.3 |
| Kogi | 4.2 | 3.9 | 4.2 | 3.7 | 4.8 | 3.3 |
| Kwara | 4.5 | 5.1 | 5.1 | 4.4 | 5.2 | 3.7 |
| Nasarawa | 4.7 | 5.5 | 5.4 | 5.7 | 5.3 | 4.5 |
| Niger | 7.5 | 6.1 | 6.1 | 6.4 | 5.8 | 4.6 |
| Plateau | 5.3 | 4.5 | 5.4 | 5.6 | 4.7 | 4.4 |
| Region – North East | 7.2 | 6.7 | 6.3 | 6.4 | 6.1 | |
| Adamawa | 6.8 | 5.6 | 5.8 | 5.5 | 6.1 | 4.2 |
| Bauchi | 8.1 | 8.6 | 8.1 | 6.8 | 7.2 | 6.5 |
| Borno | 7.1 | 6.7 | 4.7 | 6.1 | 5.2 | 5.9 |
| Gombe | 7.4 | 5.6 | 7.0 | 7.3 | 6.6 | 5.3 |
| Taraba | 5.9 | 5.3 | 6.0 | 5.5 | 5.4 | 4.9 |
| Yobe | 7.5 | 7.9 | 6.6 | 6.8 | 5.9 | 6.1 |
| Region – North West | 7.3 | 7.2 | 6.7 | 7.3 | 6.6 | |
| Jigawa | 7.1 | 6.7 | 7.6 | 8.5 | 7.1 | 7.6 |
| Kaduna | 6.3 | 7.9 | 4.1 | 5.6 | 5.9 | 5.7 |
| Kano | 8.1 | 7.5 | 6.8 | 7.7 | 6.5 | 6.4 |
| Katsina | 7.2 | 8.2 | 7.4 | 7.5 | 7.3 | 7.4 |
| Kebbi | 6.0 | 7.0 | 6.7 | 7.7 | 6.5 | 6.6 |
| Sokoto | 8.7 | 5.2 | 7.0 | 7.3 | 7.0 | 5.2 |
| Zamfara | 7.5 | 6.5 | 8.4 | 7.3 | 6.4 | 5.3 |
| Region – South East | 4.8 | 5.1 | 4.7 | 4.6 | 4.7 | |
| Abia | 4.4 | 5.2 | 4.2 | 5.1 | 4.9 | 4.1 |
| Anambra | 5.0 | 5.7 | 4.2 | 4.3 | 4.7 | 3.0 |
| Ebonyi | 5.6 | 6.1 | 5.3 | 5.2 | 5.4 | 3.7 |
| Enugu | 4.4 | 4.3 | 4.8 | 3.8 | 4.1 | 3.4 |
| Imo | 4.8 | 4.6 | 4.8 | 5.1 | 4.5 | 3.6 |
| Region – South South | 4.7 | 4.9 | 4.3 | 4.3 | 4.0 | |
| Akwa Ibom | 4.0 | 4.0 | 3.9 | 4.5 | 3.6 | 3.6 |
| Bayelsa | 5.8 | 6.7 | 4.5 | 4.8 | 4.4 | 4.2 |
| Cross River | 5.4 | 5.8 | 5.4 | 4.4 | 3.7 | 3.1 |
| Delta | 4.5 | 5.3 | 4.1 | 5.2 | 4.4 | 4.0 |
| Edo | 5.3 | 5.3 | 4.4 | 3.8 | 4.8 | 3.2 |
| Rivers | 4.3 | 4.3 | 3.8 | 3.3 | 3.9 | 3.1 |
| Region – South West | 4.5 | 5.1 | 4.6 | 4.4 | 3.9 | |
| Ekiti | 5.0 | 4.8 | 4.3 | 4.4 | 4.6 | 3.9 |
| Lagos | 4.0 | 4.7 | 4.1 | 4.0 | 3.4 | 3.2 |
| Ogun | 5.4 | 5.6 | 5.4 | 4.5 | 3.8 | 4.8 |
| Ondo | 4.9 | 3.9 | 5.2 | 4.5 | 4.1 | 3.6 |
| Osun | 4.0 | 4.9 | 4.1 | 4.7 | 3.8 | 3.5 |
| Oyo | 5.0 | 6.4 | 4.5 | 4.9 | 4.5 | 3.7 |
∗ MICS surveys
Contraceptive prevalence
Contraceptive prevalence, any methods (% of women ages 15–49)
| Year | 1982 | 1990 | 1994 | 1999 | 2003 | 2007 | 2008 | 2011 | 2012 | 2013 | 2016 | 2017 |
|---|---|---|---|---|---|---|---|---|---|---|---|---|
| % of women ages 15–49 | 6.8% | 6.0% | 13.4% | 15.3% | 12.6% | 14.7% | 14.6% | 14.1% | 13.5% | 15.1% | 20.4% | 13.4% |
∗ UNICEFs state of the worlds children and child info, United Nations population divisions world contraceptive use, household surveys including demographic and health surveys and multiple indicator cluster surveys.[39]
Population projections
The total population in sub-Saharan Africa is projected to increase to almost one billion people, making it the most populated region outside of South-Central Asia.[40] According to the United Nations, the population of Nigeria will reach 375 million by 2050. Nigeria might then be the 3rd most populous country in the world. In 2100, the population of Nigeria may reach 541 million.[41]While the overall population is expected to increase, the growth rate is estimated to decrease from 1.2 per cent per year in 2010 to 0.4 per cent per year in 2050.[40] The birth rate is also projected to decrease from 20.7 to 13.7, while the death rate is projected to increase from 8.5 in 2010 to 9.8 in 2050.[40] By 2050, 69.6% of the population is estimated to be living in urban areas compared to 50.6% in 2010.[40]
Vital statistics
Registration of vital events in Nigeria is not complete. The Population Department of the United Nations prepared the following estimates (UN World Population Prospects 2022).[42]
| Period | Population per year | Live births per year | Deaths per year | Natural change per year | CBR* | CDR* | NC* | TFR* | IMR* |
|---|---|---|---|---|---|---|---|---|---|
| 1950 | 36 836 000 | 1,697,000 | 1,010,000 | 687,000 | 45.6 | 27.1 | 18.5 | 6.42 | 184.0 |
| 1951 | 37 543 000 | 1,731,000 | 1,028,000 | 702,000 | 45.7 | 27.1 | 18.5 | 6.42 | 183.2 |
| 1952 | 38 263 000 | 1,760,000 | 1,044,000 | 716,000 | 45.6 | 27.0 | 18.5 | 6.39 | 181.6 |
| 1953 | 38 986 000 | 1,797,000 | 1,056,000 | 741,000 | 45.7 | 26.8 | 18.8 | 6.40 | 180.4 |
| 1954 | 39 710 000 | 1,831,000 | 1,074,000 | 757 000 | 45.7 | 26.8 | 18.9 | 6.40 | 179.0 |
| 1955 | 40 455 000 | 1,869,000 | 1,088,000 | 781,000 | 45.7 | 26.6 | 19.1 | 6.40 | 177.9 |
| 1956 | 41 223 000 | 1,909,000 | 1,109,000 | 800,000 | 45.8 | 26.6 | 19.2 | 6.41 | 176.9 |
| 1957 | 42 010 000 | 1,948,000 | 1,124,000 | 824,000 | 45.9 | 26.5 | 19.4 | 6.40 | 176.0 |
| 1958 | 42 817 000 | 1,988,000 | 1,145,000 | 843,000 | 46.0 | 26.5 | 19.5 | 6.39 | 175.1 |
| 1959 | 43 613 000 | 2,026,000 | 1,159,000 | 866,000 | 46.0 | 26.3 | 19.7 | 6.38 | 173.8 |
| 1960 | 44 476 000 | 2,072,000 | 1,179,000 | 893,000 | 46.1 | 26.2 | 19.9 | 6.36 | 172.4 |
| 1961 | 45 381 000 | 2,120,000 | 1,192,000 | 928,000 | 46.2 | 26.0 | 20.2 | 6.35 | 171.0 |
| 1962 | 46 330 000 | 2,174,000 | 1,214,000 | 960,000 | 46.4 | 25.9 | 20.5 | 6.36 | 169.6 |
| 1963 | 47 314 000 | 2,220,000 | 1,224,000 | 996,000 | 46.4 | 25.6 | 20.8 | 6.35 | 167.2 |
| 1964 | 48 332 000 | 2,270,000 | 1,242,000 | 1,028,000 | 46.5 | 25.4 | 21.0 | 6.36 | 165.9 |
| 1965 | 49 381 000 | 2,320,000 | 1,258,000 | 1,061,000 | 46.5 | 25.2 | 21.3 | 6.37 | 165.0 |
| 1966 | 50 471 000 | 2,373,000 | 1,281,000 | 1,092,000 | 46.5 | 25.1 | 21.4 | 6.39 | 164.2 |
| 1967 | 51 570 000 | 2,424,000 | 1,365,000 | 1,059,000 | 46.5 | 26.2 | 20.3 | 6.40 | 165.8 |
| 1968 | 52 643 000 | 2,478,000 | 1,349,000 | 1,129,000 | 46.6 | 25.4 | 21.2 | 6.42 | 163.6 |
| 1969 | 53 577 000 | 2,533,000 | 1,367,000 | 1,166,000 | 46.6 | 25.2 | 21.4 | 6.44 | 162.6 |
| 1970 | 54 945 000 | 2,595,000 | 1,353,000 | 1,241,000 | 46.7 | 24.3 | 22.3 | 6.47 | 160.7 |
| 1971 | 56 194 000 | 2,671,000 | 1,348,000 | 1,323,000 | 47.0 | 23.7 | 23.3 | 6.53 | 156.9 |
| 1972 | 57 481 000 | 2,741,000 | 1,343,000 | 1,398,000 | 47.1 | 23.1 | 24.0 | 6.58 | 153.0 |
| 1973 | 58 866 000 | 2,819,000 | 1,341,000 | 1,479,000 | 47.3 | 22.5 | 24.8 | 6.63 | 149.0 |
| 1974 | 60 344 000 | 2,922,000 | 1,340,000 | 1,583,000 | 47.8 | 21.9 | 25.9 | 6.70 | 144.9 |
| 1975 | 61 971 000 | 3,021,000 | 1,336,000 | 1,684,000 | 48.1 | 21.3 | 26.8 | 6.77 | 141.0 |
| 1976 | 63 731 000 | 3,106,000 | 1,324,000 | 1,781,000 | 48.1 | 20.5 | 27.6 | 6.81 | 137.2 |
| 1977 | 65 585 000 | 3,203,000 | 1,323,000 | 1,880,000 | 48.1 | 19.9 | 28.2 | 6.86 | 133.8 |
| 1978 | 67 594 000 | 3,308,000 | 1,340,000 | 1,968,000 | 48.2 | 19.5 | 28.7 | 6.92 | 130.7 |
| 1979 | 69 673 000 | 3,385,000 | 1,367,000 | 2,017,000 | 47.9 | 19.3 | 28.5 | 6.89 | 128.1 |
| 1980 | 71 828 000 | 3,460,000 | 1,397,000 | 2,063,000 | 47.5 | 19.2 | 28.3 | 6.85 | 126.1 |
| 1981 | 74 075 000 | 3,537,000 | 1,426,000 | 2,111,000 | 47.1 | 19.0 | 28.1 | 6.82 | 124.4 |
| 1982 | 76 276 000 | 3,613,000 | 1,462,000 | 2,151,000 | 46.7 | 18.9 | 27.8 | 6.80 | 123.5 |
| 1983 | 78 500 000 | 3,704,000 | 1,494,000 | 2,210,000 | 46.5 | 18.8 | 27.8 | 6.78 | 123.1 |
| 1984 | 80 203 000 | 3,726,000 | 1,524,000 | 2,202,000 | 45.8 | 18.7 | 27.1 | 6.70 | 123.2 |
| 1985 | 82 472 000 | 3,777,000 | 1,571,000 | 2,206,000 | 45.2 | 18.8 | 26.4 | 6.62 | 123.5 |
| 1986 | 84 698 000 | 3,824,000 | 1,624,000 | 2,200,000 | 44.6 | 18.9 | 25.6 | 6.56 | 123.9 |
| 1987 | 86 910 000 | 3,884,000 | 1,656,000 | 2,228,000 | 44.1 | 18.8 | 25.3 | 6.50 | 124.3 |
| 1988 | 89 178 000 | 3,963,000 | 1,689,000 | 2,274,000 | 43.9 | 18.7 | 25.2 | 6.50 | 124.6 |
| 1989 | 91 525 000 | 4,080,000 | 1,723,000 | 2,357,000 | 44.0 | 18.6 | 25.4 | 6.49 | 124.6 |
| 1990 | 93 963 000 | 4,168,000 | 1,773,000 | 2,395,000 | 43.8 | 18.6 | 25.2 | 6.46 | 124.5 |
| 1991 | 96 465 000 | 4,266,000 | 1,839,000 | 2,428,000 | 43.7 | 18.8 | 24.9 | 6.43 | 124.4 |
| 1992 | 98 906 000 | 4,373,000 | 1,884,000 | 2,489,000 | 43.7 | 18.8 | 24.9 | 6.39 | 123.9 |
| 1993 | 101 458 000 | 4,495,000 | 1,922,000 | 2,573,000 | 43.7 | 18.7 | 25.0 | 6.35 | 123.4 |
| 1994 | 104 092 000 | 4,619,000 | 1,989,000 | 2,629,000 | 43.8 | 18.9 | 24.9 | 6.32 | 122.6 |
| 1995 | 106 820 000 | 4,732,000 | 2,040,000 | 2,692,000 | 43.7 | 18.9 | 24.9 | 6.27 | 121.6 |
| 1996 | 109 555 000 | 4,828,000 | 2,081,000 | 2,747,000 | 43.5 | 18.8 | 24.8 | 6.22 | 120.3 |
| 1997 | 112 357 000 | 4,910,000 | 2,108,000 | 2,801,000 | 43.2 | 18.5 | 24.6 | 6.14 | 118.4 |
| 1998 | 115 225 000 | 5,002,000 | 2,134,000 | 2,868,000 | 42.9 | 18.3 | 24.6 | 6.07 | 116.2 |
| 1999 | 118 156 000 | 5,177,000 | 2,138,000 | 3,039,000 | 43.2 | 17.9 | 25.4 | 6.08 | 113.7 |
| 2000 | 121 235 000 | 5,345,000 | 2,146,000 | 3,199,000 | 43.5 | 17.5 | 26.0 | 6.12 | 110.9 |
| 2001 | 124 468 000 | 5,496,000 | 2,165,000 | 3,331,000 | 43.6 | 17.2 | 26.4 | 6.14 | 108.1 |
| 2002 | 127 837 000 | 5,645,000 | 2,192,000 | 3,453,000 | 43.6 | 16.9 | 26.6 | 6.14 | 105.2 |
| 2003 | 131 329 000 | 5,779,000 | 2,202,000 | 3,577,000 | 43.4 | 16.5 | 26.9 | 6.12 | 102.3 |
| 2004 | 134 910 000 | 5,902,000 | 2,225,000 | 3,676,000 | 43.2 | 16.3 | 26.9 | 6.09 | 99.5 |
| 2005 | 138,603,000 | 6,054,000 | 2,232,000 | 3,822,000 | 43.1 | 15.9 | 27.2 | 6.07 | 96.6 |
| 2006 | 142,378,000 | 6,191,000 | 2,247,000 | 3,945,000 | 42.9 | 15.6 | 27.3 | 6.08 | 94.0 |
| 2007 | 146,281,000 | 6,337,000 | 2,273,000 | 4,064,000 | 42.7 | 15.3 | 27.4 | 6.08 | 91.7 |
| 2008 | 150,307,000 | 6,506,000 | 2,311,000 | 4,195,000 | 42.7 | 15.2 | 27.5 | 6.08 | 89.6 |
| 2009 | 154,458,000 | 6,645,000 | 2,321,000 | 4,323,000 | 42.4 | 14.8 | 27.6 | 6.04 | 87.8 |
| 2010 | 158,733,000 | 6,776,000 | 2,355,000 | 4,421,000 | 42.1 | 14.6 | 27.5 | 5.98 | 86.4 |
| 2011 | 163,173,000 | 6,916,000 | 2,372,000 | 4,544,000 | 41.8 | 14.3 | 27.5 | 5.92 | 85.1 |
| 2012 | 167,755,000 | 7,014,000 | 2,414,000 | 4,600,000 | 41.2 | 14.2 | 27.0 | 5.83 | 84.0 |
| 2013 | 172,397,000 | 7,095,000 | 2,447,000 | 4,648,000 | 40.6 | 14.0 | 26.6 | 5.74 | 83.1 |
| 2014 | 177,055,000 | 7,189,000 | 2,493,000 | 4,697,000 | 40.1 | 13.9 | 26.2 | 5.66 | 82.4 |
| 2015 | 181,703,000 | 7,273,000 | 2,541,000 | 4,732,000 | 39.5 | 13.8 | 25.7 | 5.62 | 81.6 |
| 2016 | 186,289,000 | 7,384,000 | 2,574,000 | 4,810,000 | 39.1 | 13.6 | 25.5 | 5.58 | 80.6 |
| 2017 | 191,045,000 | 7,487,000 | 2,600,000 | 4,887,000 | 38.7 | 13.4 | 25.3 | 5.52 | 79.4 |
| 2018 | 195,947,000 | 7,590,000 | 2,627,000 | 4,963,000 | 38.2 | 13.2 | 25.0 | 5.45 | 77.9 |
| 2019 | 200,828,000 | 7,698,000 | 2,642,000 | 5,056,000 | 37.8 | 13.0 | 24.9 | 5.38 | 76.3 |
| 2020 | 205,781,000 | 7,806,000 | 2,708,000 | 5,098,000 | 37.5 | 13.0 | 24.5 | 5.31 | 74.7 |
| 2021 | 210,874,000 | 7,923,000 | 2,793,000 | 5,131,000 | 37.1 | 13.1 | 24.0 | 5.24 | 73.0 |
| * CBR = crude birth rate (per 1000); CDR = crude death rate (per 1000); NC = natural change (per 1000); IMR = infant mortality rate per 1000 births; TFR = total fertility rate (number of children per woman) | |||||||||
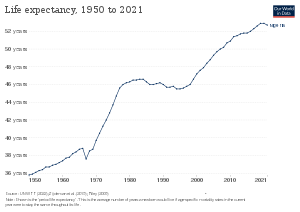
Life expectancy at birth
Life expectancy from 1950 to 2015 (UN World Population Prospects):[43]

| Period | Life expectancy in Years |
|---|---|
| 1950–1955 | 33.81 |
| 1955–1960 | |
| 1960–1965 | |
| 1965–1970 | |
| 1970–1975 | |
| 1975–1980 | |
| 1980–1985 | |
| 1985–1990 | |
| 1990–1995 | |
| 1995–2000 | |
| 2000–2005 | |
| 2005–2010 | |
| 2010–2015 |
Other demographic statistics
The following demographic statistics of Nigeria in 2022 are from the World Population Review.[44]
- One birth every 4 seconds
- One death every 13 seconds
- One net migrant every 9 minutes
- Net gain of one person every 6 seconds
The following demographic statistics are from The World Factbook, unless otherwise indicated.[19]
Population
- 218,541,212 (2022 est.)
- 203,452,505 (July 2018 est.)
- 178.5 million (2014 est.)[45]
- 174,507,539 (July 2013 est.)
Religions
- Muslim 53.5%, Roman Catholic 10.6%, other Christian 35.3%, other 0.6% (2018 est.)
- 50% Muslim, 48.2% Christian, 1.8% other[46]
Age structure
- 0–14 years: 41.7% (male 45,571,738 / female 43,674,769).
- 15–24 years: 20.27% (male 22,022,660 / female 21,358,753)
- 25–54 years: 30.6% (male 32,808,913 / female 32,686,474)
- 55–64 years: 4.13% (male 4,327,847 / female 4,514,264)
- 65 years and over: 3.3% (male 3,329,083 / female 3,733,801) (2020 est.)
- 0–14 years: 42.45% (male 44,087,799 / female 42,278,742)
- 15–24 years: 19.81% (male 20,452,045 / female 19,861,371)
- 25–54 years: 30.44% (male 31,031,253 / female 30,893,168)
- 55–64 years: 4.04% (male 4,017,658 / female 4,197,739)
- 65 years and over: 3.26% (male 3,138,206 / female 3,494,524) (2018 est.)
- 0–14 years: 42.5% (male 41,506,288 / female 39,595,720)
- 15–24 years: 19.6% (male 19,094,899 / female 18,289,513)
- 25–54 years: 30.7% (male 30,066,196 / female 28,537,846)
- 55–64 years: 3.9% (male 3,699,947 / female 3,870,080)
- 65 years and over: 3% (male 2,825,134 / female 3,146,638) (2017 est.)
- 0–14 years: 43.8% (male 39,127,615 / female 37,334,281)
- 15–24 years: 19.3% (male 17,201,067 / female 16,451,357)
- 25–54 years: 30.1% (male 25,842,967 / female 26,699,432)
- 55–64 years: 3.8% (male 3,016,896 / female 3,603,048)
- 65 years and over: 3% (male 2,390,154 / female 2,840,722) (2013 est.)
Birth rate
- 34.19 births/1,000 population (2022 est.) Country comparison to the world: 18th
- 35.2 births/1,000 population (2018 est.) Country comparison to the world: 20th
- 36.9 births/1,000 population (2017 est.)
- 38.78 births/1,000 population (2013 est.)
Death rate
- 8.7 deaths/1,000 population (2022 est.). Country comparison to the world: 70th
- 9.6 deaths/1,000 population (2018 est.). Country comparison to the world: 46th
- 12.4 deaths/1,000 population (2017 est.)
- 13.2 deaths/1,000 population (2013 est.)
Total fertility rate
- 4.57 children born/woman (2023 est.) Country comparison to the world: 14th
- 4.62 children born/woman (2022 est.) Country comparison to the world: 16th
- 4.85 children born/woman (2018 est.) Country comparison to the world: 16th
- 5.07 children born/woman (2017 est.)
Population growth rate
- 2.53% (2022 est.). Country comparison to the world: 22nd
- 2.54% (2018 est.). Country comparison to the world: 21st
- 2.43% (2017 est.). Country comparison to the world: 24th
- 2.54% (2013 est.)
Median age
- Total: 18.6 years. Country comparison to the world: 207th
- Male: 18.4 years
- Female: 18.9 years (2020 est.)
Mother's mean age at first birth
- 20.4 years (2018 est.)
- Note: median age at first birth among women 25–49
- 20.3 years
- Note: median age at first birth among women 25–29 (2013 est.)
Contraceptive prevalence rate
- 16.6% (2018)
- 13.4% (2016/17)
Net migration rate
- −0.21 migrant(s)/1,000 population (2022 est.). Country comparison to the world: 113rd
- −0.2 migrant(s)/1,000 population (2017 est.). Country comparison to the world: 106th
- −0.22 migrant(s)/1,000 population (2013 est.)
Dependency ratios
- Total dependency ratio: 88.2
- Youth dependency ratio: 83
- Potential support ratio: 19.4 (2015 est.)
Urbanisation
- Urban population: 53.5% of total population (2022)
- Rate of urbanisation: 3.92% annual rate of change (2020–25 est.)
- Urban population: 50.3% of total population (2018)
- Rate of urbanisation: 4.2% annual rate of change (2015–20 est.)
Life expectancy at birth
- Total population: 61.33 years. Country comparison to the world: 217th
- Male: 59.51 years
- Female: 63.27 years (2022 est.)
- Total population: 59.3 years (2018 est.)
- Male: 57.5 years (2018 est.)
- Female: 61.1 years (2018 est.)
- Total population: 52.05 years
- Male: 48.95 years
- Female: 55.33 years (2012 est.)
- Total population: 46.94 years
- Male: 46.16 years
- Female: 47.76 years (2009 est.)
- Total population: 51.56 years
- Male: 51.58 years
- Female: 51.55 years (2000 est.)
Major infectious diseases
- Degree of risk: very high (2020)
- Food or waterborne diseases: bacterial and protozoal diarrhoea, hepatitis A and E, and typhoid fever
- Vectorborne diseases: malaria, dengue fever, and yellow fever
- Water contact diseases: leptospirosis and schistosomiasis
- Animal contact diseases: rabies
- Respiratory diseases: meningococcal meningitis
- Aerosolised dust or soil contact diseases: Lassa fever
Note 1: on 30 September 2021, the Centers for Disease Control and Prevention issued a Travel Health Notice for a Yellow Fever outbreak in Nigeria; a large, ongoing outbreak of yellow fever in Nigeria began in September 2017; the outbreak is now spread throughout the country with the Nigerian Ministry of Health reporting cases of the disease in multiple states (Bauchi, Benue, Delta, Ebonyi, and Enugu); the CDC recommends travellers going to Nigeria should receive vaccination against yellow fever at least 10 days before travel and should take steps to prevent mosquito bites while there; those never vaccinated against yellow fever should avoid travel to Nigeria during the outbreak
Note 2: widespread ongoing transmission of a respiratory illness caused by the novel coronavirus (COVID-19) is occurring throughout Nigeria; as of 6 June 2022, Nigeria has reported a total of 256,148 cases of COVID-19 or 124.3 cumulative cases of COVID-19 per 100,000 population with a total of 3,148 cumulative deaths or a rate of 1.5 cumulative death per 100,000 population; as of 22 May 2022, 12.97% of the population has received at least one dose of COVID-19 vaccine
Note 3: on 21 March 2022, the US Centers for Disease Control and Prevention (CDC) issued a Travel Alert for polio in Africa; Nigeria is currently considered a high risk to travellers for circulating vaccine-derived polioviruses (cVDPV); vaccine-derived poliovirus (VDPV) is a strain of the weakened poliovirus that was initially included in oral polio vaccine (OPV) and that has changed over time and behaves more like the wild or naturally occurring virus; this means it can be spread more easily to people who are unvaccinated against polio and who come in contact with the stool or respiratory secretions, such as from a sneeze, of an “infected” person who received oral polio vaccine; the CDC recommends that before any international travel, anyone unvaccinated, incompletely vaccinated, or with an unknown polio vaccination status should complete the routine polio vaccine series; before travel to any high-risk destination, CDC recommends that adults who previously completed the full, routine polio vaccine series receive a single, lifetime booster dose of polio vaccine
Ethnic groups
HIV/AIDS
- Adult prevalence rate: 2.8% (2017 est.)
- People living with HIV/AIDS: 2.6 million (2007 est.), 3.3 million (2009 est.)
School life expectancy (primary to tertiary education)
- Total: 9 years
- Male: 9 years
- Female: 8 years (2011)
Literacy
Definition: age 15 and over can read and write
- Total population: 62%
- Male: 71.3%
- Female: 52.7% (2018)
- Total population: 67.6%
- Male: 71.2%
- Female: 53.7% (2015 est.)
- Total population: 78.6%
- Male: 84.35%
- Female: 72.65% (2010 est.)[48]
Unemployment, youth ages 15–24
- Total: 18.3%
- Male: 18.4%
- Female: 18.2% (2019 est.) NA
Population distribution
Nigeria is Africa's most populous country. Significant population clusters are scattered throughout the country, with the highest density areas being in the south and southwest.
Emigration
Today millions of ethnic Nigerians live abroad, the largest communities can be found in the United Kingdom (500,000–3,000,000)[49] and the United States (600,000–1,000,000 Nigerians), other countries that followed closely are South Africa, Gambia, and Canada respectively. There are also large groups in Ireland, Portugal and many other countries.[50] Inspiration for emigration is based heavily on socio-economical issues such as warfare, insecurity, economical instability and civil unrest.
Between 1400 and 1900, of 1.4 million of 2 million emigrants were slaves sent to the Americas with the other 600,000 being sent to other destinations via the trans-Saharan, Red Sea and Indian Ocean routes. This is due to the fact that the land now known as Nigeria was a central point for 4 slave trades during the 19th century. Though bondage represented a great deal, an estimated 30,000 Nigerian inhabitants would relocate to Kano City and Gambia to take advantage of financial opportunities afforded by fertile land and available natural resources. What's more, the presence of gold mines and rail lines along the Gold Coast, present-day Ghana, attracted an estimated 6,500 Nigerian citizens to attain financial gain and opportunity. The population of Nigerians in Ghana rose to roughly 149,000 before the 1969 alien expulsion order would displace nearly the entire population to surrounding countries.[51]
Religion
Nigeria is nearly equally divided between Islam and Christianity. The majority of Nigerian Muslims are Sunni and mostly live in the northern, central and south-western states of the country, while Christians dominate in some central states (especially Plateau and Benue states), and the south-east and south-south regions. Other religions practised in Nigeria include African Traditional Religion, Hinduism, Baháʼí Faith, Judaism, The Grail Movement, and the Reformed Ògbóni Fraternity, one of the traditional socio-religious institutions of the Yorùbá people and their Òrìṣà religion known as Ẹ̀sìn Òrìṣà Ìbílẹ̀ in the Yorùbá language.[52]
According to a 2009 Pew survey, 50.4% of Nigeria's population were Muslims.[53] A later Pew study in 2011 calculated that Christians now formed 50.8% of the population.[54][55] Adherents of other religions made up 1% of the population.[56]
The shift of population balance between Muslims and Christians is a result of northern and southern Nigeria being in different stages of demographic transition. The Muslim-dominated north is in an earlier stage of the demographic transition with much higher fertility rates than the south, whose split Christian/Muslim population is further along in the transition, and whose fertility rates are declining. Decreasing fertility can be linked to more access to education, use of contraceptives, and differing beliefs regarding family planning.[57]
The 1999 introduction of Sharia law in twelve northern Nigerian states led to massive violence and unrest and caused an ethnic and religious rift between Sharia and Non-Sharia states, a divide that has deepened with time.[57]
Crime
Nigeria is home to a substantial network of organised crime, active especially in drug trafficking. Nigerian criminal groups are heavily involved in drug trafficking, shipping heroin from Asian countries to Europe and America; and cocaine from South America to Europe and South Africa.[58]
The various Nigerian confraternities or "campus cults" are active in both organised crime and in political violence as well as providing a network of corruption within Nigeria. As confraternities have extensive connections with political and military figures, they offer excellent alumni networking opportunities. The Supreme Vikings Confraternity, for example, boasts that twelve members of the Rivers State House of Assembly are cult members.[59] On lower levels of society, there are the "area boys", these are organised gangs mostly active in Lagos who specialise in mugging and small-scale drug dealing. According to official statistics, gang violence in Lagos resulted in 273 civilians and 84 policemen killed in the period of August 2000 to May 2001.[60]
"The result of factors such as endemic local corruption, which facilitates illicit trafficking; the Nigerian Civil War, which contributed to a proliferation of firearms; the oil boom of the 1970s, which led to the embezzlement of public funds; and the economic crisis of the 1980s, which was accompanied by a rise in robberies. The expansion of the Nigerian diaspora and organized crime went hand in hand. Global migration boosted prostitution, drug trafficking and fraud, the three main activities of Nigerian syndicates. The smuggling of Nigerian sex workers became a whole industry that now extends from Switzerland to France and Italy (where black prostitutes are called "fireflies"), and has even reached the Prudish Kingdom of Saudi Arabia, from which 1,000 women are said to be deported every month by the authorities."[61]
The high crime rate among Nigerian migrants also leads to stereotyping Nigerians as criminals; thus, in Cameroon, Nigerian migrants are perceived collectively by the inhabitants of Cameroon as likely to be oil smugglers or dealers in stolen cars. In the Netherlands, the debate on Nigerian crime reached an intensity described as a "moral panic" by one scholar.[62][63] In Switzerland, the crime rate of Nigerian young males was reported as 620% that of Swiss males in same age group (2009 data), the second highest crime rate of any nationality, just below that of Angolan nationals (at 630%).[64]
Nigeria is also pervaded by political corruption. It is ranked 136 out of 168 countries in Transparency International's 2015 Corruption Perceptions Index.[65]
Notes
- ^ compare to Nigeria's overall growth rate 2.53%
See also
References
- ^ a b c d e f "Nigeria". The World Factbook. Central Intelligence Agency. Retrieved 10 April 2018.
- ^ "Nigeria, African Countries Lead as World Population Hits Eight Billion". thisdaylive.com. Retrieved 27 November 2022.
- ^ "Population in Africa, by country 2020". Statista. Retrieved 27 November 2022.
- ^ "From the World's most populated countries to the least populated nations". nationsonline.org. Retrieved 27 November 2022.
- ^ "Country Comparison :: Population". The World Factbook. Central Intelligence Agency. Archived from the original on 18 December 2018. Retrieved 24 November 2020.
- ^ "Experts worry as Nigeria becomes 4th most populous country". Daily Trust. 12 July 2022. Retrieved 27 November 2022.
- ^ "World Bank Open Data". World Bank Open Data.
- ^ Akinyemi, Akanni Ibukun; Isiugo-Abanihe, Uche C. (24 March 2014). "Demographic dynamics and development in Nigeria". African Population Studies. 27 (2): 239–248. doi:10.11564/27-2-471.
- ^ "Buhari: By 2050, Nigeria's Population Projected to Rank Third Worldwide after India, China – THISDAYLIVE". thisdaylive.com. Retrieved 27 November 2022.
- ^ "Largest Ethnic Groups In Nigeria". WorldAtlas. 18 July 2019. Retrieved 27 November 2022.
- ^ "Full list of all 371 tribes in Nigeria, states where they originate". Vanguard News. 10 May 2017. Retrieved 27 November 2022.
- ^ "Nigeria – The Road North". PBS. January 2003. Retrieved 27 November 2022.
- ^ LeVan, A. Carl; Ukata, Patrick (25 October 2018). The Oxford Handbook of Nigerian Politics. Oxford University Press. ISBN 978-0-19-880430-7.
- ^ "Impacts of Coronavirus on Developing Countries". Trinità dei Monti (in Italian). 30 April 2020. Retrieved 27 November 2022.
- ^ "Planes and pyramids: The surreal mansions of Lebanon's Nigeria Avenue". Middle East Eye édition française.
- ^ Shinn, David H.; Eisenman, Joshua (2012). China and Africa. University of Pennsylvania Press. ISBN 9780812244199. JSTOR j.ctt3fhwkz.
- ^ "Brits Abroad". BBC News.
- ^ Lysonski, Steven; Durvasula, Srinivas (28 October 2013). "Nigeria in transition: acculturation to global consumer culture". Journal of Consumer Marketing. 30 (6): 493–508. doi:10.1108/JCM-07-2013-0626.
- ^ a b c "Nigeria". The World Factbook. Central Intelligence Agency. 2018.
- ^ Okeke, Chukwuma O.; Ibenwa, Christopher N.; Okeke, Gloria Tochukwu (April 2017). "Conflicts Between African Traditional Religion and Christianity in Eastern Nigeria: The Igbo Example". SAGE Open. 7 (2). doi:10.1177/2158244017709322.
- ^ Nwaka, Jacinta C. (2011). "Beyond the Service of Schools: The Catholic Church and the Use of Creative Art in the Evangelization of the Lower Niger". Journal of the Historical Society of Nigeria. 20: 67–86. ISSN 0018-2540. JSTOR 41857175.
- ^ "Catholic life in Igboland, Nigeria's Catholic stronghold". Catholics & Cultures. 7 May 2020. Retrieved 27 November 2022.
- ^ "Christianity in Nigeria". rpl.hds.harvard.edu. Retrieved 27 November 2022.
- ^ Osoba, Joseph Babasola (2015). "Analysis of Discourse in Nigerian Pidgin". Journal of Universal Language. 16: 131–159. doi:10.22425/jul.2015.16.1.131. Retrieved 27 May 2020.
- ^ "Archived copy". Archived from the original on 12 September 2023. Retrieved 27 February 2024.
{{cite web}}: CS1 maint: archived copy as title (link) - ^ "NIGERIA'S POPULATION HITS 198M PEOPLE – NPopC CHAIRMAN". National Population Commission of Nigeria. Archived from the original on 29 June 2018. Retrieved 14 July 2018.
- ^ "Federal Republic of Nigeria: 2006 Population and Housing Census - Population distribution by age & sex" (PDF). Archived from the original (PDF) on 20 January 2017. Retrieved 19 April 2013.
- ^ "Demographic and Social Statistics". United Nations.
- ^ "Demographic and Social Statistics". United Nations.
- ^ "MEASURE DHS: Demographic and Health Surveys". World Bank. Retrieved 29 August 2017.
- ^ "In the News: The Nigerian Census". Prb.org. Archived from the original on 25 February 2013. Retrieved 29 August 2017.
- ^ "Map of Central Africa" (GIF). Businessmonitor.com. Retrieved 29 August 2017.[permanent dead link]
- ^ "FIELD LISTING :: TOTAL FERTILITY RATE". The World Factbook. Central Intelligence Agency. Archived from the original on 13 June 2007.
- ^ "Birth rate, crude (per 1,000 people)". World Bank Group.
- ^ "Demographic and Health Survey 2018" (PDF). The DHS Program.
- ^ "2021 Multiple Indicator Cluster Survey Nigeria p. 23" (PDF). UNICEF. Retrieved 5 September 2022.
- ^ "Demographic and Health Survey: 2013" (PDF). Archived from the original (PDF) on 6 July 2017. Retrieved 27 August 2017.
- ^ "Country Main". The DHS Program. Retrieved 29 August 2017.
- ^ "Contraceptive prevalence, any methods (% of women ages 15–49)". World Bank Group.
- ^ a b c d Dyson, Tim (2010). Population and Development: The Demographic Transition. Zed Books. pp. 70–77.
- ^ "Archived copy". Archived from the original on 12 September 2023. Retrieved 27 February 2024.
{{cite web}}: CS1 maint: archived copy as title (link) - ^ "World Population Prospects – Population Division – United Nations". United Nations. Retrieved 11 July 2022.
- ^ "World Population Prospects – Population Division – United Nations". Retrieved 15 July 2017.
- ^ "Nigeria Population 2022". World Population Review. 2022.
- ^ THE STATE OF WORLD POPULATION 2014, 2014. Retrieved 20 June 2015
- ^ "2022 Report on International Religious Freedom: Nigeria". Office of International Religious Freedom.
- ^ "Nigeria". The World Factbook. Central Intelligence Agency. 8 March 2022. Retrieved 14 March 2022.
- ^ "National literacy main report" (PDF). Archived from the original (PDF) on 29 September 2011. Retrieved 29 August 2011.
- ^ "Country Profile: Nigeria". Foreign and Commonwealth Office. 25 June 2010. Archived from the original on 29 June 2011. Retrieved 29 August 2011.
- ^ "NOI-Polls: US And UK Top List Of Countries Most Nigerians Abroad Reside In. Key Reason For Migration Is For Economic Opportunities". Noi-polls.com. Archived from the original on 27 August 2017. Retrieved 29 August 2017.
- ^ "Nigeria: Multiple Forms of Mobility in Africa's Demographic Giant". Migrationpolicy.org. 30 June 2010. Retrieved 29 August 2017.
- ^ Ikenwa, Chizoba (24 September 2019). "All Types of Religions in Nigeria Explained". Nigerian Infopedia. Archived from the original on 30 January 2022. Retrieved 30 January 2022.
- ^ "Mapping out the Global Muslim Population" (PDF). Archived from the original (PDF) on 10 October 2009. Retrieved 29 August 2011.
- ^ "Global Christianity: A Report on the Size and Distribution of the World's Christian Population" (PDF). Pewforum.org. Archived from the original (PDF) on 23 July 2013. Retrieved 29 December 2011.
- ^ "Future of the World Muslim Population". Pewforum.org. 27 January 2011. Retrieved 16 May 2014.
- ^ "Nigeria: Facts and figures". BBC News. 17 April 2007.
- ^ a b Stonawski, Marcin; Potančoková, Michaela; Cantele, Matthew; Skirbekk, Vegard (September 2016). "The changing religious composition of Nigeria: causes and implications of demographic divergence" (PDF). The Journal of Modern African Studies. 54 (3): 361–387. doi:10.1017/s0022278x16000409.
- ^ "Organized Crime: African Criminal Enterprises". Federal Bureau of Investigation. Archived from the original on 6 September 2015. Retrieved 7 June 2011.
- ^ "Cults of violence – How student fraternities turned into powerful and well-armed gangs". The Economist. 31 July 2008. Retrieved 7 June 2011.
- ^ Olukoya, Sam (20 February 2003). "Crime war rages in Nigeria". BBC News. Retrieved 7 June 2011.
- ^ Pérouse de Montclos, Marc-Antoine (2005). "'The Dark Side of Diaspora Networking: Organised Crime and Terrorism' in Diasporas, Remittances and Africa South of the Sahara: A Strategic Assessment". Iss.co.za. Archived from the original on 2 July 2008. Retrieved 29 August 2017.
- ^ van Dijk, Rijk (November 2001), "'Voodoo' on the Doorstep: Young Nigerian Prostitutes and Magic Policing in the Netherlands", Africa, 71 (4): 558–586, doi:10.3366/afr.2001.71.4.558, S2CID 145384427
- ^ van Heelsum, Anja; Hessels, Thomas (January 2006), "Nigerianen" (PDF), Afrikanen uit Angola, DR Congo, Ethiopië, Eritrea, Nigeria en Sudan in Nederland, Den Haag: Ministerie van Justitie, p. 80, OCLC 150216568
- ^ Neue Statistik: Tamilen sind krimineller als Ex-Jugoslawen, Tages-Anzeiger 12 September 2010. In April 2010, the director of the Swiss Federal Office for Migration (BFM), Alard du Bois-Reymond, issued a statement to the effect that 99.5% of asylum seekers of Nigerian origin in Switzerland were criminals who entered Europe with the intention of pursuing petty crime and drug dealing. Task-Force gegen Asylmissbrauch Archived 23 July 2011 at the Wayback Machine 11 April 2010.
- ^ "The Global Anti-Corruption Coalition". Transparency International. Archived from the original on 13 November 2019. Retrieved 19 May 2016.
Further reading
- "Nigeria". Demographic Dividend Initiative. Bill & Melinda Gates Institute for Population and Reproductive Health at the Johns Hopkins Bloomberg School of Public Health. Retrieved 15 March 2018.
- Demographic dynamics and development in Nigeria (Report). ProQuest 1706105013.
- Dyson, Tim (October 2010). Population and Development: The Demographic Transition. Zed Books. ISBN 978-1-84277-960-6.
- Omoju, Oluwasola E; Abraham, Terfa W (24 March 2014). "Youth bulge and demographic dividend in Nigeria". African Population Studies. 27 (2): 352–360. doi:10.11564/27-2-480.
- Reed, H. E., & Mberu, B. U. (2014). Capitalizing on Nigeria's demographic dividend: reaping the benefits and diminishing the burdens. Etude de La.
- Reed, Holly E; Mberu, Blessing U (24 March 2014). "Capitalizing on Nigeria's demographic dividend: reaping the benefits and diminishing the burdens". African Population Studies. 27 (2): 319–330. doi:10.11564/27-2-477. PMC 4335263. PMID 25705077.
- "Nigeria". The World Factbook. Central Intelligence Agency. Retrieved 10 April 2018.