
| Liverpool, Walton | |
|---|---|
| Borough constituency for the House of Commons | |
 Boundary of Liverpool, Walton in Merseyside | |
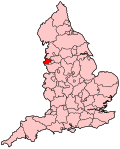 Location of Merseyside within England | |
| County | Merseyside |
| Electorate | 62,628 [1] |
| Major settlements | Fazakerley, Orrell Park, Walton |
| Current constituency | |
| Created | 1885 |
| Member of Parliament | Dan Carden (Labour) |
| Seats | One |
| Created from | Liverpool |
Liverpool, Walton is a constituency[n 1] represented in the House of Commons of the UK Parliament since 2017 by Dan Carden of the Labour Party.[n 2] Carden won the highest percentage share of the vote in June 2017 of 650 constituencies, 85.7%.[2] It is the safest Labour seat in the United Kingdom, and the safest seat in the country having been won by 85% of the vote in the most recent election in 2019.
YouTube Encyclopedic
-
1/1Views:301
-
Liverpool | Wikipedia audio article
Transcription
Boundaries


1918–1950: The County Borough of Liverpool wards of Fazakerley, Walton, and Warbreck.
1950–1955: As above plus the civil parish of Aintree in the Rural District of West Lancashire.
1955–1983: The County Borough of Liverpool wards of County, Fazakerley, Pirrie, and Warbreck.
1983–2010: The City of Liverpool wards of Anfield, Breckfield, County, Fazakerley, Melrose, and Warbreck.
2010–present: The City of Liverpool wards of Anfield, Clubmoor, County, Everton, Fazakerley, and Warbreck.
The constituency is one of five covering the city of Liverpool and covers the north-centre of the city thereby taking in Walton, Clubmoor, Orrell Park, Anfield, Everton and Fazakerley. The grounds of Liverpool F.C. (Anfield) and Everton F.C. (Goodison Park), the city's two major football clubs, are in the constituency.
Proposed
Further to the 2023 Periodic Review of Westminster constituencies, enacted by the Parliamentary Constituencies Order 2023, from the next general election, due by January 2025, the constituency will be composed of the following wards (as they existed on 1 December 2020):
- The City of Liverpool wards of: Clubmoor; County; Croxteth; Fazakereley; Norris Green; Warbreck.
- The Metropolitan Borough of Sefton ward of Molyneux (polling districts C4, C5 and C6).[3]
The constituency will be subject to significant change, with the addition of the Croxteth and Norris Green wards from Liverpool West Derby and the Aintree district in the Sefton Borough ward of Molyneux from Sefton Central. These will be partly offset by the transfer of the Anfield and Everton wards to Liverpool Riverside.
History
Created by the Redistribution of Seats Act 1885, Liverpool Walton has been held by the Labour Party since the 1964 general election, and is the party's safest seat by size of majority. In 2010 and 2015, it had the largest Labour majority in the country by percentage terms.[4] Labour has won over 70% of the vote at every general election in the Walton constituency since 1992, although for many years it was looked on as a reasonably safe Conservative seat. Until 1964, Labour had only gained Walton once, at their landslide victory after the Second World War in 1945. Like other seats in Merseyside, the Conservative Party's share of the vote declined rapidly during the 1980s, and Conservative candidates failed to poll in second place from 1997 until 2017. From 1964 until his death in 1991, the seat was held by the notable left-winger Eric Heffer; the subsequent by-election was won by Peter Kilfoyle, who held the seat until 2010. Steve Rotheram won the seat in 2010 after Kilfoyle stood down.
At both the 2010 and 2015 general elections, Liverpool Walton saw the highest share of the vote for a winning candidate in the country, and in the latter election, the 81.3% of the vote won by Rotheram was the highest of any candidate in an election in the UK since 1997.[5]
In 2015, Liverpool Walton was the only constituency in England where the Conservative candidate (Norsheen Bhatti) lost their deposit.
In May 2017, Steve Rotheram was elected as Mayor of the Liverpool City Region and chose not to stand for re-election as an MP at the 2017 general election held one month later. In that election, the seat was won by the Labour candidate Dan Carden with the highest vote share for any Labour candidate nationally at 85.7%.[6]
Members of Parliament
Elections
Elections in the 2020s
| Party | Candidate | Votes | % | ±% | |
|---|---|---|---|---|---|
| Liberal Democrats | Sean Cadwallader[8] | ||||
| Labour | Dan Carden | ||||
| Green | Martyn Madeley | ||||
| Majority | |||||
| Turnout | |||||
Elections in the 2010s
| Party | Candidate | Votes | % | ±% | |
|---|---|---|---|---|---|
| Labour | Dan Carden | 34,538 | 84.7 | ―1.0 | |
| Conservative | Alex Phillips | 4,018 | 9.9 | +1.3 | |
| Green | Ted Grant | 814 | 2.0 | +0.8 | |
| Liberal Democrats | David Newman | 756 | 1.9 | +0.4 | |
| Liberal | Billy Lake | 660 | 1.6 | New | |
| Majority | 30,520 | 74.8 | ―2.3 | ||
| Turnout | 40,786 | 65.1 | ―2.2 | ||
| Labour hold | Swing | ―1.1 | |||
In percentage terms, Carden's vote share and majority were unmatched by any candidate in any constituency at the 2019 election,[10] although higher turnouts and larger electorates saw fifteen other MPs — twelve Labour in London and one in Merseyside, and three Conservatives in Lincolnshire and Essex — win with bigger numerical majorities.
| Party | Candidate | Votes | % | ±% | |
|---|---|---|---|---|---|
| Labour | Dan Carden | 36,175 | 85.7 | +4.4 | |
| Conservative | Laura Evans | 3,624 | 8.6 | +3.9 | |
| Independent | Terry May | 1,237 | 2.9 | New | |
| Liberal Democrats | Kris Brown | 638 | 1.5 | ―0.8 | |
| Green | Colm Feeley | 523 | 1.2 | ―1.3 | |
| Majority | 32,551 | 77.1 | +4.8 | ||
| Turnout | 42,197 | 67.3 | +6.2 | ||
| Labour hold | Swing | +0.3 | |||
| Party | Candidate | Votes | % | ±% | |
|---|---|---|---|---|---|
| Labour | Steve Rotheram | 31,222 | 81.3 | +9.3 | |
| UKIP | Steven Flatman | 3,445 | 9.0 | +6.4 | |
| Conservative | Norsheen Bhatti | 1,802 | 4.7 | ―1.8 | |
| Green | Jonathan Clatworthy | 956 | 2.5 | New | |
| Liberal Democrats | Patrick Moloney | 899 | 2.3 | ―11.9 | |
| Independent | Alexander Karran | 56 | 0.1 | New | |
| The Pluralist Party | Jonathan Bishop | 23 | 0.1 | New | |
| Majority | 27,777 | 72.3 | +14.5 | ||
| Turnout | 38,403 | 61.1 | +6.3 | ||
| Labour hold | Swing | +1.5 | |||
| Party | Candidate | Votes | % | ±% | |
|---|---|---|---|---|---|
| Labour | Steve Rotheram | 24,709 | 72.0 | +0.2 | |
| Liberal Democrats | Patrick Moloney | 4,891 | 14.2 | ―2.7 | |
| Conservative | Adam Marsden | 2,241 | 6.5 | +0.6 | |
| BNP | Peter Stafford | 1,104 | 3.2 | New | |
| UKIP | Joseph Nugent | 898 | 2.6 | ―0.7 | |
| CPA | John Manwell | 297 | 0.9 | New | |
| TUSC | Darren Ireland | 195 | 0.6 | New | |
| Majority | 19,818 | 57.8 | +3.0 | ||
| Turnout | 34,335 | 54.8 | +8.1 | ||
| Labour hold | Swing | +1.5 | |||
Elections in the 2000s
| Party | Candidate | Votes | % | ±% | |
|---|---|---|---|---|---|
| Labour | Peter Kilfoyle | 20,322 | 72.8 | ―5.0 | |
| Liberal Democrats | Kiron Reid | 4,365 | 15.6 | +1.0 | |
| Conservative | Sharon Buckle | 1,655 | 5.9 | ―0.2 | |
| UKIP | Joseph Moran | 1,108 | 4.0 | +2.4 | |
| Liberal | Daniel J. Wood | 480 | 1.7 | New | |
| Majority | 15,957 | 57.2 | ―6.0 | ||
| Turnout | 27,930 | 45.0 | +2.0 | ||
| Labour hold | Swing | ―3.0 | |||
| Party | Candidate | Votes | % | ±% | |
|---|---|---|---|---|---|
| Labour | Peter Kilfoyle | 22,143 | 77.8 | ―0.6 | |
| Liberal Democrats | Kiron Reid | 4,147 | 14.6 | +3.5 | |
| Conservative | Stephen Horgan | 1,726 | 6.1 | ―0.2 | |
| UKIP | Paul Forrest | 442 | 1.6 | New | |
| Majority | 17,996 | 63.2 | ―4.1 | ||
| Turnout | 28,458 | 43.0 | ―16.5 | ||
| Labour hold | Swing | ―2.1 | |||
Elections in the 1990s
| Party | Candidate | Votes | % | ±% | |
|---|---|---|---|---|---|
| Labour | Peter Kilfoyle | 31,516 | 78.4 | +6.0 | |
| Liberal Democrats | Richard J. Roberts | 4,478 | 11.1 | ―0.9 | |
| Conservative | Mark K. Kotecha | 2,551 | 6.3 | ―6.2 | |
| Referendum | Charles Grundy | 620 | 1.5 | New | |
| Socialist Alternative | Lesley Mahmood | 444 | 1.1 | New | |
| Liberal | Hazel L. Williams | 352 | 0.9 | ―1.1 | |
| ProLife Alliance | Veronica P. Mearns | 246 | 0.6 | New | |
| Majority | 27,038 | 67.3 | +8.4 | ||
| Turnout | 40,207 | 59.5 | ―7.9 | ||
| Labour hold | Swing | ||||
| Party | Candidate | Votes | % | ±% | |
|---|---|---|---|---|---|
| Labour | Peter Kilfoyle | 34,214 | 72.4 | +8.0 | |
| Conservative | Berkeley Greenwood | 5,915 | 12.5 | ―1.9 | |
| Liberal Democrats | Joseph Lang | 5,672 | 12.0 | ―9.2 | |
| Liberal | Tom Newall | 963 | 2.0 | New | |
| Protestant Reformation | David J.E. Carson | 393 | 0.8 | New | |
| Natural Law | Dianne Raiano | 98 | 0.2 | New | |
| Majority | 28,299 | 59.9 | +16.7 | ||
| Turnout | 47,255 | 67.4 | ―6.2 | ||
| Labour hold | Swing | +4.9 | |||
| Party | Candidate | Votes | % | ±% | |
|---|---|---|---|---|---|
| Labour | Peter Kilfoyle | 21,317 | 53.1 | ―11.3 | |
| Liberal Democrats | Paul Clark | 14,457 | 36.0 | +14.8 | |
| Walton Real Labour | Lesley Mahmood | 2,613 | 6.5 | New | |
| Conservative | Berkeley Greenwood | 1,155 | 2.9 | ―11.5 | |
| Monster Raving Loony | Screaming Lord Sutch | 546 | 1.4 | New | |
| Independent | George Lee-Delisle | 63 | 0.1 | New | |
| Majority | 6,860 | 17.1 | ―26.1 | ||
| Turnout | 40,151 | 56.7 | ―16.9 | ||
| Labour hold | Swing | ||||
Elections in the 1980s
| Party | Candidate | Votes | % | ±% | |
|---|---|---|---|---|---|
| Labour | Eric Heffer | 34,661 | 64.4 | +11.7 | |
| Liberal | Paul Clark | 11,408 | 21.2 | ―0.2 | |
| Conservative | Iain Mays | 7,738 | 14.4 | ―10.7 | |
| Majority | 23,253 | 43.2 | +15.6 | ||
| Turnout | 53,807 | 73.6 | +4.0 | ||
| Labour hold | Swing | +6.0 | |||
| Party | Candidate | Votes | % | ±% | |
|---|---|---|---|---|---|
| Labour | Eric Heffer | 26,980 | 52.7 | ―2.5 | |
| Conservative | Alan Maddox | 12,865 | 25.1 | ―11.5 | |
| Liberal | David M.B. Croft | 10,970 | 21.4 | +11.9 | |
| BNP | Donald J.M. McKechnie | 343 | 0.7 | New | |
| Majority | 14,115 | 27.6 | +6.0 | ||
| Turnout | 51,158 | 69.6 | ―3.2 | ||
| Labour hold | Swing | ||||
Elections in the 1970s
| Party | Candidate | Votes | % | ±% | |
|---|---|---|---|---|---|
| Labour | Eric Heffer | 20,231 | 55.2 | ―2.5 | |
| Conservative | R. Gould | 12,673 | 34.6 | +4.4 | |
| Liberal | N. Cardwell | 3,479 | 9.5 | ―2.4 | |
| National Front | W.F. Haire | 254 | 0.7 | New | |
| Majority | 7,558 | 20.6 | |||
| Turnout | 36,637 | 72.8 | |||
| Labour hold | Swing | ―3.5 | |||
| Party | Candidate | Votes | % | ±% | |
|---|---|---|---|---|---|
| Labour | Eric Heffer | 20,568 | 58.0 | ||
| Conservative | R. Gould | 10,706 | 30.2 | ||
| Liberal | J. Watton | 4,221 | 11.9 | ||
| Majority | 9,862 | 27.79 | |||
| Turnout | 35,495 | 68.30 | |||
| Labour hold | Swing | ||||
| Party | Candidate | Votes | % | ±% | |
|---|---|---|---|---|---|
| Labour | Eric Heffer | 20,057 | 53.7 | ||
| Conservative | R.W. Rollins | 11,841 | 31.7 | ||
| Liberal | J. Watton | 4,842 | 13.0 | New | |
| National Front | C. Gibbon | 647 | 1.7 | New | |
| Majority | 8,216 | 22.0 | |||
| Turnout | 37,387 | 72.69 | |||
| Labour hold | Swing | ||||
| Party | Candidate | Votes | % | ±% | |
|---|---|---|---|---|---|
| Labour | Eric Heffer | 20,530 | 56.0 | ―1.3 | |
| Conservative | Joseph Norton | 16,124 | 44.0 | +1.3 | |
| Majority | 4,406 | 12.0 | |||
| Turnout | 36,654 | 68.0 | |||
| Labour hold | Swing | ―1.3 | |||
Elections in the 1960s
| Party | Candidate | Votes | % | ±% | |
|---|---|---|---|---|---|
| Labour | Eric Heffer | 20,950 | 57.3 | +3.7 | |
| Conservative | Kenneth Thompson | 15,617 | 42.7 | ―3.7 | |
| Majority | 5,333 | 14.6 | |||
| Turnout | 36,567 | 71.2 | ―4.4 | ||
| Labour hold | Swing | +3.7 | |||
| Party | Candidate | Votes | % | ±% | |
|---|---|---|---|---|---|
| Labour | Eric Heffer | 21,452 | 53.6 | +8.1 | |
| Conservative | Kenneth Thompson | 18,546 | 46.4 | ―8.1 | |
| Majority | 2,906 | 7.3 | N/A | ||
| Turnout | 39,998 | 75.6 | |||
| Labour gain from Conservative | Swing | +8.1 | |||
Elections in the 1950s
| Party | Candidate | Votes | % | ±% | |
|---|---|---|---|---|---|
| Conservative | Kenneth Thompson | 24,288 | 54.5 | +1.3 | |
| Labour | George McCartney | 20,254 | 45.5 | ―1.3 | |
| Majority | 4,034 | 9.1 | |||
| Turnout | 44,542 | 77.7 | |||
| Conservative hold | Swing | ||||
| Party | Candidate | Votes | % | ±% | |
|---|---|---|---|---|---|
| Conservative | Kenneth Thompson | 23,851 | 53.2 | ||
| Labour | Joseph Cleary | 20,989 | 46.8 | ||
| Majority | 2,862 | 6.4 | |||
| Turnout | 44,840 | 75.3 | |||
| Conservative hold | Swing | ||||
| Party | Candidate | Votes | % | ±% | |
|---|---|---|---|---|---|
| Conservative | Kenneth Thompson | 28,014 | 53.59 | ||
| Labour | Ian Isidore Levin | 24,262 | 46.41 | ||
| Majority | 3,752 | 7.18 | |||
| Turnout | 52,276 | 81.05 | |||
| Conservative hold | Swing | ||||
| Party | Candidate | Votes | % | ±% | |
|---|---|---|---|---|---|
| Conservative | Kenneth Thompson | 26,250 | 49.40 | ||
| Labour | James Haworth | 21,983 | 41.37 | ||
| Liberal | Ewart Heywood | 4,901 | 9.22 | ||
| Majority | 4,267 | 8.03 | N/A | ||
| Turnout | 53,134 | 83.07 | |||
| Conservative gain from Labour | Swing | ||||
Elections in the 1940s
| Party | Candidate | Votes | % | ±% | |
|---|---|---|---|---|---|
| Labour | James Haworth | 18,385 | 43.61 | ||
| Conservative | Reginald Purbrick | 15,749 | 37.35 | ||
| Liberal | Ernest Ronald Webster | 8,028 | 19.04 | ||
| Majority | 2,636 | 6.26 | N/A | ||
| Turnout | 42,162 | 69.55 | |||
| Labour gain from Conservative | Swing | ||||
Elections in the 1930s
| Party | Candidate | Votes | % | ±% | |
|---|---|---|---|---|---|
| Conservative | Reginald Purbrick | 22,623 | 61.64 | ||
| Labour | Frederick Lees McGhee | 14,079 | 38.36 | ||
| Majority | 8,544 | 23.28 | |||
| Turnout | 36,702 | 64.24 | |||
| Conservative hold | Swing | ||||
| Party | Candidate | Votes | % | ±% | |
|---|---|---|---|---|---|
| Conservative | Reginald Purbrick | 31,135 | 73.57 | ||
| Labour | F. A. P. Rowe | 11,183 | 26.43 | ||
| Majority | 19,952 | 47.14 | |||
| Turnout | 42.318 | 77.50 | |||
| Conservative hold | Swing | ||||
Election results 1885–1929
Elections in the 1880s

| Party | Candidate | Votes | % | ±% | |
|---|---|---|---|---|---|
| Conservative | John George Gibson | 3,492 | 58.3 | ||
| Liberal | Augustine Birrell | 2,500 | 41.7 | ||
| Majority | 992 | 16.6 | |||
| Turnout | 5,992 | 78.0 | |||
| Registered electors | 7,683 | ||||
| Conservative win (new seat) | |||||
| Party | Candidate | Votes | % | ±% | |
|---|---|---|---|---|---|
| Conservative | John George Gibson | 2,872 | 63.1 | +4.8 | |
| Liberal | Charles Hamilton Bromby | 1,681 | 36.9 | -4.8 | |
| Majority | 1,191 | 26.2 | +9.6 | ||
| Turnout | 4,553 | 59.3 | −18.7 | ||
| Registered electors | 7,683 | ||||
| Conservative hold | Swing | +4.8 | |||
Gibson was appointed Solicitor-General for Ireland, requiring a by-election.
| Party | Candidate | Votes | % | ±% | |
|---|---|---|---|---|---|
| Conservative | John George Gibson | Unopposed | |||
| Conservative hold | |||||
Gibson resigned after being appointed a Judge of the Queen's Bench Division in the High Court of Justice in Ireland, causing a by-election.
| Party | Candidate | Votes | % | ±% | |
|---|---|---|---|---|---|
| Conservative | Miles Walker Mattinson | Unopposed | |||
| Conservative hold | |||||
Elections in the 1890s

| Party | Candidate | Votes | % | ±% | |
|---|---|---|---|---|---|
| Conservative | James Henry Stock | 3,707 | 59.8 | −3.3 | |
| Liberal | Benjamin Ward Richardson | 2,493 | 40.2 | +3.3 | |
| Majority | 1,214 | 19.6 | −6.6 | ||
| Turnout | 6,200 | 68.9 | +9.6 | ||
| Registered electors | 9,004 | ||||
| Conservative hold | Swing | −3.3 | |||
| Party | Candidate | Votes | % | ±% | |
|---|---|---|---|---|---|
| Conservative | James Henry Stock | Unopposed | |||
| Conservative hold | |||||
Elections in the 1900s
| Party | Candidate | Votes | % | ±% | |
|---|---|---|---|---|---|
| Conservative | James Henry Stock | Unopposed | |||
| Conservative hold | |||||

| Party | Candidate | Votes | % | ±% | |
|---|---|---|---|---|---|
| Conservative | F. E. Smith | 5,862 | 53.2 | N/A | |
| Liberal | Edwin George Jellicoe | 5,153 | 46.8 | New | |
| Majority | 709 | 6.4 | N/A | ||
| Turnout | 11,015 | 74.0 | N/A | ||
| Registered electors | 14,889 | ||||
| Conservative hold | Swing | N/A | |||
Elections in the 1910s
| Party | Candidate | Votes | % | ±% | |
|---|---|---|---|---|---|
| Conservative | F. E. Smith | 6,627 | 52.6 | -0.6 | |
| Liberal | Francis L'Estrange Joseph | 5,513 | 43.8 | -3.0 | |
| Independent Liberal | Edwin George Jellicoe | 451 | 3.6 | -43.2 | |
| Majority | 1,114 | 8.8 | +2.4 | ||
| Turnout | 12,591 | 80.4 | +6.4 | ||
| Conservative hold | Swing | +1.2 | |||
| Party | Candidate | Votes | % | ±% | |
|---|---|---|---|---|---|
| Conservative | F. E. Smith | 6,383 | 55.9 | +3.3 | |
| Liberal | William Permewan | 5,039 | 44.1 | +0.3 | |
| Majority | 1,344 | 11.8 | +3.0 | ||
| Turnout | 11,422 | 72.9 | -7.5 | ||
| Conservative hold | Swing | ||||
General Election 1914–15:
Another General Election was required to take place before the end of 1915. The political parties had been making preparations for an election to take place and by July 1914, the following candidates had been selected;
- Unionist: F. E. Smith
- Liberal: Thomas Berridge[28]
| Party | Candidate | Votes | % | ±% | |
|---|---|---|---|---|---|
| C | Unionist | Warden Chilcott | 11,457 | 71.4 | +15.5 |
| Labour | Robert Dixon Smith | 4,580 | 28.6 | New | |
| Majority | 6,877 | 42.8 | +31.0 | ||
| Turnout | 16,037 | 55.1 | −20.8 | ||
| Registered electors | 29,128 | ||||
| Unionist hold | Swing | N/A | |||
| C indicates candidate endorsed by the coalition government. | |||||
Elections in the 1920s
| Party | Candidate | Votes | % | ±% | |
|---|---|---|---|---|---|
| Unionist | Warden Chilcott | Unopposed | |||
| Unionist hold | |||||
| Party | Candidate | Votes | % | ±% | |
|---|---|---|---|---|---|
| Unionist | Warden Chilcott | Unopposed | |||
| Unionist hold | |||||
| Party | Candidate | Votes | % | ±% | |
|---|---|---|---|---|---|
| Unionist | Warden Chilcott | 13,387 | 55.3 | N/A | |
| Labour | Tom Gillinder | 8,924 | 36.8 | New | |
| Liberal | Samuel Skelton | 1,910 | 7.9 | New | |
| Majority | 4,463 | 18.5 | N/A | ||
| Turnout | 24,221 | 76.9 | N/A | ||
| Registered electors | 31,482 | ||||
| Unionist hold | Swing | N/A | |||
| Party | Candidate | Votes | % | ±% | |
|---|---|---|---|---|---|
| Unionist | Reginald Purbrick | 16,623 | 42.7 | −12.6 | |
| Labour | F. A. P. Rowe | 16,395 | 42.2 | +5.4 | |
| Liberal | Glyn Howard Howard-Jones | 5,857 | 15.1 | +7.2 | |
| Majority | 228 | 0.5 | −18.0 | ||
| Turnout | 38,875 | 76.0 | −0.9 | ||
| Registered electors | 51,175 | ||||
| Unionist hold | Swing | −9.0 | |||
See also
Notes
- ^ A borough constituency (for the purposes of election expenses and type of returning officer)
- ^ As with all constituencies, the constituency elects one Member of Parliament (MP) by the first past the post system of election at least every five years.
References
- ^ https://members.parliament.uk/constituency/3582/election-history.
{{cite web}}: Missing or empty|title=(help) - ^ See Results of the 2017 United Kingdom general election
- ^ "The Parliamentary Constituencies Order 2023". Schedule 1 Part 5 North West region.
- ^ "UK Polling Report". ukpollingreport.co.uk. Archived from the original on 5 November 2017. Retrieved 15 August 2013.
- ^ "Labour Members of Parliament 2015". UK Political.info. Archived from the original on 29 September 2018.
- ^ "GE2017 - Constituency results". Britain Elects (Google Docs). Archived from the original on 30 April 2020. Retrieved 11 June 2017.
- ^ Leigh Rayment's Historical List of MPs – Constituencies beginning with "W" (part 1)
- ^ "Liberal Democrat Prospective Parliamentary Candidates". Mark Pack. Retrieved 3 February 2024.
- ^ "Liverpool Walton Parliamentary constituency". BBC News. Archived from the original on 13 December 2019. Retrieved 13 December 2019.
- ^ a b "Commons Briefing Paper 8749. General Election 2019: results and analysis" (PDF). London: House of Commons Library. 28 January 2020. Archived (PDF) from the original on 18 November 2021. Retrieved 19 January 2022.
- ^ Fitzgerald, Ged (11 May 2017). "Statement of persons nominated, notice of poll. Election of a Member of Parliament for the Liverpool Walton Constituency". Liverpool City Council. Archived from the original on 2 January 2020.
- ^ "Commons Briefing Paper 7979. General Election 2017: results and analysis" (PDF) (Second ed.). House of Commons Library. 29 January 2019 [7 April 2018]. Archived (PDF) from the original on 12 November 2019.
- ^ "Election Data 2015". Electoral Calculus. Archived from the original on 17 October 2015. Retrieved 17 October 2015.
- ^ "Liverpool Walton". Liverpool City Council. Archived from the original on 12 November 2019. Retrieved 11 May 2015.
- ^ "Election Data 2010". Electoral Calculus. Archived from the original on 26 July 2013. Retrieved 17 October 2015.
- ^ "Election Data 2005". Electoral Calculus. Archived from the original on 15 October 2011. Retrieved 18 October 2015.
- ^ "Election Data 2001". Electoral Calculus. Archived from the original on 15 October 2011. Retrieved 18 October 2015.
- ^ "Election Data 1997". Electoral Calculus. Archived from the original on 15 October 2011. Retrieved 18 October 2015.
- ^ "Election Data 1992". Electoral Calculus. Archived from the original on 15 October 2011. Retrieved 18 October 2015.
- ^ "UK General Election results April 1992". Richard Kimber's Political Science Resources. Politics Resources. 9 April 1992. Archived from the original on 26 October 2016. Retrieved 6 December 2010.
- ^ "Election Data 1987". Electoral Calculus. Archived from the original on 15 October 2011. Retrieved 18 October 2015.
- ^ "Election Data 1983". Electoral Calculus. Archived from the original on 15 October 2011. Retrieved 18 October 2015.
- ^ a b c d e f g h i j British Parliamentary Election Results 1885-1918, FWS Craig
- ^ a b c d e f g h The Liberal Year Book, 1907
- ^ Debrett's House of Commons & Judicial Bench, 1886
- ^ a b Debrett's House of Commons & Judicial Bench, 1901
- ^ a b Debrett's House of Commons & Judicial Bench, 1916
- ^ Liverpool Daily Post 27 Jun 1914
- ^ a b c d e British Parliamentary Election Results 1918-1949, FWS Craig
External links
53°26′49″N 2°58′01″W / 53.447°N 2.967°W