
| U.S. cities with significant Chinese-American populations | |
|---|---|
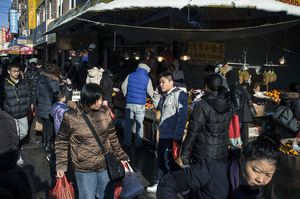 New York City is home to the largest Chinese-American population of any city proper, with over half a million.[1] Multiple large Chinatowns in Manhattan, Brooklyn (above), and Queens are thriving as traditionally urban enclaves, as large-scale Chinese immigration continues into New York,[2][3][4][5] with the largest metropolitan Chinese population outside Asia.[6] |
Cities considered to have significant Chinese-American populations are large U.S. cities or municipalities with a critical mass of at least 1% of the total urban population; medium-sized cities with a critical mass of at least 1% of their total population; and small cities with a critical mass of at least 10% of the total population.
According to the 2012 Census estimates,[7] the three metropolitan areas with the largest Chinese-American populations were the Greater New York Combined Statistical Area at 735,019 people, the San Jose-San Francisco-Oakland Combined Statistical Area at 629,243 people, and the Greater Los Angeles Combined Statistical Area at about 566,968 people. In the post-1965 era, first- and second-generation immigrants include those from Mainland China, Hong Kong, Macau, and Taiwan. Also included in the Chinese-American population enumeration are ethnic Chinese from Malaysia and Vietnam who might identify themselves as Chinese, thus skewing the census reporting.
New York City is home to by far the highest Chinese-American population of any city proper, with an estimated 573,388 Chinese-Americans in New York City,[1] significantly higher than the total of the next five cities combined; multiple large Chinatowns in Manhattan, Brooklyn (three), and Queens (three) are thriving as traditionally urban enclaves, as large-scale Chinese immigration continues into New York,[8][9][10][11] with the largest metropolitan Chinese population outside Asia.[12] The Los Angeles County city of Monterey Park has the highest percentage of Chinese-Americans of any municipality, at 43.7% of its population, or 24,758 people. The San Gabriel Valley region of Los Angeles County is the single largest concentration of combined Chinese and Taiwanese Americans in the country,[13] having a collections of U.S. suburbs with large foreign-born Chinese-speaking populations, ranging from working-class individuals residing in Rosemead and El Monte to wealthier immigrants living in Arcadia, San Marino, and Diamond Bar. A similar demographic shift has also taken place in the southern half of the San Francisco Bay Area. Conversely, the suburbs of New York City within the state of New Jersey are notable for their widespread and increasing prevalence of Chinese-Americans (see list below), reflecting their general affluence and propensity for professional occupation.
YouTube Encyclopedic
-
1/5Views:1 493 3613 909 950536 1645 560 6242 317 617
-
Growth, Cities, and Immigration: Crash Course US History #25
-
Is the United States a Country?
-
New York City vs London - City Comparison
-
The Black Legend, Native Americans, and Spaniards: Crash Course US History #1
-
China vs United States (USA) 2016 - Who Would Win - Military Comparison 💣
Transcription
Episode 25: Immigrant Cities Hi, I’m John Green, this is CrashCourse U.S. History and today we’re going to continue our extensive look at American capitalism. Mr. Green, Mr. Green, I’m sorry are you saying that I grow up to be a tool of the bourgeoisie… Oh not just a tool of the bourgeoise, Me from the Past, but a card-carrying member of it. I mean, you have employees whose labor you can exploit because you own the means of production, which in your case includes a chalkboard, a video camera, a desk, and a xenophobic globe. Meanwhile Stan, Danica, Raoul, and Meredith toil in crushing poverty--STAN, DID YOU WRITE THIS PART? THESE ARE ALL LIES. CUE THE INTRO. intro So, last week we saw how commercial farming transformed the American west and gave us mythical cowboys and unfortunately not-so-mythical Indian reservations. Today we leave the sticks and head for the cities--as so many Americans and immigrants have done throughout this nation’s history. I mean we may like to imagine that the history of America is all “Go west young man,” but in fact from Mark Twain to pretty much every hipster in Brooklyn, it’s the opposite. So, population was growing everywhere in America after 1850. Following a major economic downturn in the 1890s, farm prices made a comeback, and that drew more and more people out west to take part in what would eventually be called agriculture’s golden age. Although to be fair agriculture’s real golden age was in like 3000 BCE when Mesopotamians were like, “Dude, if we planted these in rows, we could have MORE OF IT THAN WE CAN EAT.” So it was really more of a second golden age. But anyway, more than a million land claims were filed under the Homestead Act in the 1890s. And between 1900 and 1910 the populations of Texas and Oklahoma together increased by almost 2 million people. And another 800,000 moved into Kansas, the Dakotas, and Nebraska. That’s right. People moved to Nebraska. Sorry, I just hadn’t yet offended Nebraskans. I’m looking to get through the list before the end of the year. But one of the central reasons that so many people moved out west was that the demand for agricultural products was increasing due to … the growth of cities. In 1880, 20% of the American population lived in cities and there were 12 cities with a population over 100,000 people. This rose to 18 cities in 1900 with the percentage of urban dwellers rising to 38%. And by 1920, 68% of Americans lived in cities and 26 cities had a population over 100,000. So in the 40 years around the turn of the 20th century, America became the world’s largest industrial power and went from being predominantly rural to largely urban. This is, to use a technical historian term, a really big deal. Because it didn’t just make cities possible, but also their products. It’s no coincidence that while all this was happening, we were getting cool stuff like electric lights and moving picture cameras. Neither of which were invented by Thomas Edison. I don’t know if you’ve noticed, but suddenly there are a lot more photographs in Crash Course U.S. History b-roll. So the city leading the way in this urban growth was New York, especially after Manhattan was consolidated with Brooklyn (and the Bronx, Queens and Staten Island) in 1898. At the turn of the century, the population of the 23 square miles of Manhattan Island was over 2 million and the combined 5 boroughs had a population over 4 million. But, while New York gets most of the attention in this time period, and all time periods since, it wasn’t alone in experiencing massive growth. Like, my old hometown of Chicago, after basically burning to the ground in 1871, became the second largest city in America by the 1890s. Also, they reversed the flow of the freaking Chicago River. Probably the second most impressive feat in Chicago at the time. The first being that the Cubs won two World Series. Even though I’m sorely tempted to chalk up the growth of these metropolises to a combination of better nutrition and a rise in skoodilypooping, I’m going to have to bow to stupid historical accuracy and tell you that much of the growth had to do with the phenomenon that this period is most known for: immigration. Of course, by the end of the 19th century, immigration was not a new phenomenon in the United States. After the first wave of colonization by English people, and Spanish people, and other Europeans, there was a new wave of Scandinavians, French people, and especially the Irish. Most of you probably know about the potato famine of the 1840s that led a million Irish men and women to flee. If you don’t know about it, it was awful. And the second largest wave of immigrants was made up of German speakers, including a number of liberals who left after the abortive revolutions of 1848. Alright, let’s go to the ThoughtBubble. The Irish had primarily been farmers in the motherland, but in America, they tended to stay in cities, like New York and Boston. Most of the men began their working lives as low-wage unskilled laborers, but over time they came to have much more varied job opportunities. Irish immigrant women worked too, some in factories or as domestic servants in the homes of the growing upper class. Many women actually preferred the freedom that factory labor provided and one Irish factory woman compared her life to that of a servant by saying: “Our day is ten hours long, but when it’s done, it’s done, and we can do what we like with the evenings. That’s what I’ve heard from every nice girl that’s tried service. You’re never sure that your soul is your own except when you’re out of the house.” [1] Most German speakers had been farmers in their home countries and would remain farmers in the U.S., but a number of skilled artisans also came. They tended to stay in cities and make a go of entrepreneurship. Bismarck himself saw emigration from Germany as a good thing saying, “The better it goes for us, the higher the volume of emigration.”[2] And that’s why we named a city in North Dakota after him. Although enough German immigrants came to New York that the lower east side of Manhattan came to be known for a time as Kleindeutschland (little Germany), many moved to the growing cities of the Midwest like Cincinnati and St. Louis. Some of the most famous German immigrants became brewers, and America is much richer for the arrival of men like Frederick Pabst, Joseph Schlitz, and Adolphus Busch. And by richer, I mean more drunker. Hey. Thanks for not ending on a downer, Thought Bubble. I mean, unless you count alcoholism. So but by the 1890s, over half of the 3.5 million immigrants who came to our shores came from southern and eastern Europe, in particular Italy and the Russian and Austro Hungarian empires. They were more likely than previous immigrants to be Jewish or Catholic, and while almost all of them were looking for work, many were also escaping political or religious persecution. And by the 1890s they also had to face new “scientific” theories, which I’m putting in air quotes to be clear because there was nothing scientific about them, which consigned them to different “races” whose low level of civilization was fit only for certain kinds of work and predisposed them to criminality. The Immigration Restriction League was founded in Boston in 1894 and lobbied for national legislation that would limit the numbers of immigrants, and one such law even passed Congress in 1897 only to be vetoed by President Grover Cleveland. Good work, Grover! You know, his first name was Stephen, but he called himself Grover. I would have made a different choice. But before you get too excited about Grover Cleveland, Congress and the President were able to agree on one group of immigrants to discriminate against: the Chinese. Chinese immigrants, overwhelmingly male, had been coming to the United States, mostly to the West, since the 1850s to work in mines and on the railroads. They were viewed with suspicion because they looked different, spoke a different language, and they had “strange” habits, like regular bathing. By the time the Chinese Exclusion Act went into effect in 1882 there were 105,000 people of Chinese descent living in the United States, mainly in cities on the West Coast. San Francisco refused to educate Asians until the state Supreme Court ordered them to do so and even then the city responded by setting up segregated schools. The immigrants fought back through the courts. In 1886, in the case of Yick Wo v. Hopkins the United States Supreme court ordered San Francisco to grant Chinese-operated laundries licenses to operate. Then in 1898 in United States v. Wong Kim Ark, the Court ruled that American born children of Chinese immigrants were entitled to citizenship under the 14th Amendment, which should have been a duh but wasn’t. We’ve been hard on the Supreme Court here at Crash Course, but those were two good decisions. You go, Supreme Court! But despite these victories Asian immigrants continued to face discrimination in the form of vigilante-led riots like the one in Rock Springs, Wyoming that killed 26 people, and congressionally approved restrictions, many of which the Supreme Court did uphold, so meh. Also it’s important to remember that this large-scale immigration--and the fear of it--was part of a global phenomenon. At its peak between 1901 and the outbreak of World War 1 in 1914, 13 million immigrants came to the United States. In the entire period touched off by the industrialization from 1840 until 1914, a total of 40 million people came to the U.S. But at least 20 million people emigrated to other parts of the Western Hemisphere, including Brazil, the Caribbean, Canada (yes, Canada) and Argentina. As much as we have Italian immigrants to thank for things like pizza (and we do thank you), Argentina can be just as grateful for the immigrant ancestors of Leo Messi. Also the Pope, although he has never once won La Liga. And there was also extensive immigration from India to other parts of the British Empire like South Africa; Chinese immigration to South America and the Caribbean; I mean, the list goes on and on. In short, America is not as special as it fancies itself. Oh it’s time for the Mystery Document? The rules are simple. I guess the author of the Mystery Document. I get it wrong and then I get shocked with the shock pen. Sorry I don’t mean to sound defeatist, but I don’t have a good feeling about this. Alright. “The figure that challenged attention to the group was the tall, straight, father, with his earnest face and fine forehead, nervous hands eloquent in gesture, and a voice full of feeling. This foreigner, who brought his children to school as if it were an act of consecration, who regarded the teacher of the primer class with reverence, who spoke of visions, like a man inspired, in a common classroom...I think Miss Nixon guessed what my father’s best English could not convey. I think she divined that by the simple act of delivering our school certificates to her he took possession of America.”[3] Uhh, I don’t know. At first I thought it might be someone who worked with immigrants, like Jane Addams, but then at the end suddenly it’s her own father. Jane Addams’s father was not an immigrant. Mary Antin? Does she even have a Wikipedia page?! She does? Did you write it, Stan? Stan wrote her Wikipedia page. AH. So, this document, while it was written by someone who should not have a Wikipedia page, points out that most immigrants to America were coming for the most obvious reason: opportunity. Industrialization, both in manufacturing and agriculture, meant that there were jobs in America. There was so much work, in fact, that companies used labor recruiters who went to Europe to advertise opportunities. Plus, the passage was relatively cheap, provided you were only going to make it once in your life, and it was fast, taking only 8 to 12 days on the new steam powered ships. The Lower East Side of Manhattan became the magnet for waves of immigrants, first Germans then Eastern European Jews and Italians, who tended to re-create towns and neighborhoods within blocks and sometimes single buildings. Tenements, these 4, 5 and 6 story buildings that were designed to be apartments, sprang up in the second half of the 19th century and the earliest ones were so unsanitary and crowded that the city passed laws requiring a minimum of light and ventilation. And often these tenement apartments doubled as workspaces because many immigrant women and children took in piecework, especially in the garment industry. Despite laws mandating the occasional window and outlawing the presence of cows on public streets, conditions in these cities were pretty bad. Things got better with the construction of elevated railroads and later subways that helped relieve traffic congestion but they created a new problem: pickpockets. “Pickpockets take advantage of the confusion to ply their vocation… The foul, close, heated air is poisonous. A healthy person cannot ride a dozen blocks without a headache.” So that’s changed! This new transportation technology also enabled a greater degree of residential segregation in cities. Manhattan’s downtown area had at one time housed the very rich as well as the very poor but improved transportation meant that people no longer had to live and work in the same place. The wealthiest, like Cornelius Vanderbilt and J.P. Morgan, constructed lavish palaces for themselves and uptown townhouses were common.[4][5] But until then, one of the most notable feature of gilded age cities like New York was that the rich and the poor lived in such close proximity to each other. And this meant that with America’s growing urbanization, the growing distance between rich and poor was visible to both rich and poor. And much as we see in today’s megacity, this inability to look away from poverty and economic inequality became a source of concern. Now one way to alleviate concern is to create suburbs so you don’t have to look at poor people, but another response to urban problems was politics, which in cities like New York, became something of a contact sport. Another response was the so-called progressive reform movement. And in all these responses and in the issues that prompted them – urbanization, mechanization, capitalism, the distribution of resources throughout the social order -- we can see modern industrial America taking shape. And that is the America we live in today. Thank you for watching. I’ll see you next week. Crash Course is produced and directed by Stan Muller. The script supervisor is Meredith Danko. The show is written by my history teacher, Raoul Meyer, Rosianna Halse Rojas, and myself. Our associate producer is Danica Johnson. And our graphics team is Thought Café. Every week, there’s a new caption for the libertage. If you’d like to suggest one, you can do so in comments where you can also ask questions about today’s video that will be answered by our team of historians. Thanks for watching Crash Course and as we say in my hometown, don’t forget to be awesome. Immigrant Cities - ________________ [1] Quoted in H.W. Brands, American Colossus: The Triumph of Capitalism 1865-1900. p. 265. [2] Ibid p. 267 [3] Quoted in Brands, American Colossus, p. 324 [4] Ibid p. 315 [5] quoted in Brands, American Colossus p. 320
Metropolitan areas with more than 20,000 Chinese-Americans
The list of metropolitan areas with a Chinese-American population of 20,000 or more as of the 2011-2015 American Community Survey[update].
Large-sized cities
The list of large cities (population greater than 250,000) with a Chinese-American population of at least 1% of the total population, as of the 2011-2016 American Community Survey[update].
New York City boroughs
![The busy intersection of Main Street, Kissena Boulevard, and 41st Avenue in the Flushing Chinatown (法拉盛華埠), Queens, New York City, the Chinese "Times Square". The segment of Main Street between Kissena Boulevard and Roosevelt Avenue, punctuated by the Long Island Rail Road trestle overpass, represents the cultural heart of Flushing Chinatown. Housing over 30,000 individuals born in China alone, the largest by this metric outside Asia, Flushing has become home to the largest and one of the fastest-growing Chinatowns in the world.[14] Approximately 250,000 Chinese live in the Queens borough of New York City.](/wikipedia/commons/thumb/3/33/Flushing_Queens_May_2015_2.jpg/im624-800px-Flushing_Queens_May_2015_2.jpg)
As the city proper with the nation's largest Chinese-American population by a wide margin, with an estimated 562,205 in 2016 by the 2010-2016 American Community Survey, and as the primary destination for new Chinese immigrants,[3] New York City is subdivided into official municipal boroughs, which themselves are home to significant Chinese populations, with Brooklyn and Queens, adjacently located on Long Island, leading the fastest growth.[15][16] After the City of New York itself, the boroughs of Queens and Brooklyn encompass the largest Chinese populations, respectively, of all municipalities in the United States.
| Rank | Borough | County | Chinese-Americans | Percentage |
|---|---|---|---|---|
| 1 | Queens (Chinatowns) | Queens | 232,317 | 10.1 |
| 2 | Brooklyn (Chinatowns) | Kings | 204,225 | 7.8 |
| 3 | Manhattan (Chinatown) | New York | 104,176 | 6.4 |
| 4 | Staten Island | Richmond | 14,416 | 3.0 |
| 5 | The Bronx | Bronx | 7,071 | 0.5 |
Medium-sized cities
List of medium-sized cities (population between 100,000 and 250,000) with a Chinese-American population of at least one percent of the total population, according to the American Community Survey.
Small-sized cities
The following is a list of places in the United States with a population fewer than 100,000 in which at least three percent (five percent in Los Angeles or San Francisco Bay areas) of the total population is Chinese, according to the 2010-2015 American Community Survey, and the 2010 U.S. Census for the U.S. territories.
American Samoa
| Rank | City [17] | Percentage |
|---|---|---|
| 1 | Atu'u | 6.7 |
California
| City | County | Chinese-Americans | Percentage |
|---|---|---|---|
| Davis | Yolo | 6,448 | 9.7 |
| Isla Vista | Santa Barbara | 2,298 | 8.7 |
| Florin | Sacramento | 2,803 | 5.5 |
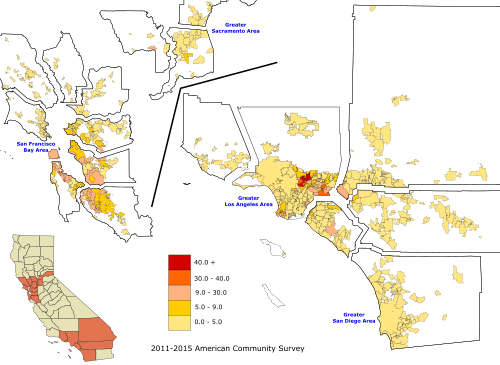
- Greater Los Angeles Area
The majority of the Chinese-American population of more than 400,000 in Los Angeles County lives within the San Gabriel Valley, which is particularly noted for cities that have a large Chinese-American ethnic plurality. The following cities have the highest percentage of Chinese-Americans in Greater Los Angeles.
- San Francisco Bay Area
Traditionally centered in San Francisco and Chinatown Oakland, the suburbanization of the Bay Area's Chinese-American population has resulted in significant concentrations in the southwestern East Bay, eastern Peninsula, and northern Santa Clara County. Chinese enclaves have also formed in many of these cities, in a similar manner to that of Southern California's San Gabriel Valley.
Delaware
| Rank | City | Percentage |
|---|---|---|
| 1 | Hockessin | 5.0 |
Georgia
| Rank | City | Percentage |
|---|---|---|
| 1 | Berkeley Lake, Georgia | 6.0 |
| 2 | Duluth, Georgia | 5.4 |
| 3 | Doraville, Georgia | 4.0 |
Guam
| Rank | City [18] | Percentage |
|---|---|---|
| 1 | Tamuning (including Tumon) | 5.0 |
| 2 | Hagåtña | 4.0 |
Hawaii
| Rank | City | County | Chinese-Americans | Percentage |
|---|---|---|---|---|
| 1 | East Honolulu | Honolulu | 5,190 | 10.8 |
| 2 | Kalaheo | Kauai | 297 | 6.8 |
| 3 | Waimea | Kauai | 92 | 5.4 |
| 4 | Volcano | Hawaii | 128 | 5.3 |
| 5 | Aiea | Honolulu | 428 | 4.6 |
| 6 | Halawa | Honolulu | 656 | 4.4 |
| 7 | Laie | Honolulu | 225 | 4.0 |
| 8 | He'eia | Honolulu | 173 | 3.9 |
| 9 | Ko Olina | Honolulu | 71 | 3.8 |
| 10 | Pearl City | Honolulu | 1,700 | 3.6 |
| 11 | Kaneohe | Honolulu | 1,222 | 3.6 |
| 12 | Waikele | Honolulu | 282 | 3.6 |
| 13 | Punaluu | Honolulu | 38 | 3.6 |
| 14 | Wailuā Homesteads | Kauai | 197 | 3.5 |
| 15 | Discovery Harbour | Hawaii | 38 | 3.4 |
| 16 | Maunawili | Honolulu | 64 | 3.0 |
| 17 | Wailuku | Maui | 428 | 2.7 |
| 18 | Kailua | Honolulu | 966 | 2.5 |
| 19 | Waimalu | Honolulu | 386 | 2.9 |
Indiana
| Rank | City | Percentage |
|---|---|---|
| 1 | West Lafayette | 11.1 |
| 2 | Carmel | 3.5 |
New Jersey
| Rank | City | Percentage |
|---|---|---|
| 1 | Kingston | 16.0 |
| 2 | Holmdel Township | 12.1 |
| 3 | West Windsor Township | 11.6 |
| 4 | Montgomery Township | 11.4 |
| 5 | Plainsboro Township | 9.7 |
| 6 | Englewood Cliffs | 9.7 |
| 7 | Fort Lee | 8.7 |
| 8 | Harrison | 8.4 |
| 9 | Bernards Township | 8.0 |
| 10 | East Brunswick | 7.1 |
| 11 | Warren Township | 7.1 |
| 12 | Livingston | 6.9 |
| 13 | Montville | 6.9 |
| 14 | Bridgewater Township | 6.7 |
| 15 | Alpine | 6.5 |
| 16 | Marlboro Township | 6.4 |
| 17 | New Providence | 6.2 |
| 18 | Edison | 6.1 |
| 19 | Parsippany-Troy Hills | 6.1 |
| 20 | Cranbury Township | 6.0 |
| 21 | Piscataway Township | 5.8 |
| 22 | Kendall Park | 5.5 |
| 23 | East Hanover | 5.4 |
| 24 | South Brunswick Township | 4.9 |
| 25 | Closter | 4.6 |
| 26 | Princeton Township | 4.5 |
| 27 | Highland Park | 4.3 |
| 28 | Berkeley Heights | 4.1 |
| 29 | Princeton Junction | 4.1 |
| 30 | Dayton | 3.9 |
| 31 | Millburn | 3.9 |
| 32 | Cresskill | 3.9 |
| 33 | Paramus | 3.1 |
| 34 | Edgewater | 3.0 |
Northern Mariana Islands
| Rank | City [19] | Percentage |
|---|---|---|
| 1 | Tinian | 7.6 |
| 2 | Saipan | 7.1 |
Within Saipan, villages with significant Chinese populations include Garapan (19.7% Chinese), Chalan Piao (18.1% Chinese), Chalan Kanoa IV (15.1% Chinese), and San Antonio (19.8% Chinese).[19]
Ohio
| Rank | City | Percentage |
|---|---|---|
| 1 | Glenwillow | 7.0 |
| 2 | Solon | 5.3 |
| 3 | Oxford | 4.7 |
| 4 | Athens | 4.2 |
| 5 | Dublin | 3.9 |
Texas
| Rank | City | Percentage |
|---|---|---|
| 1 | Sugar Land | 12.8 |
| 2 | New Territory | 5.0 |
| 3 | Bellaire | 8.7 |
| 4 | Richardson | 4.0 |
| 5 | Jollyville | 3.2 |
Washington
The overwhelming majority of these cities are in King County, while three others (Edmonds, Lynnwood, and Mill Creek) are in Snohomish County. Pullman is in Whitman County.
| Rank | City | Percentage |
|---|---|---|
| 1 | Newcastle | 11.5 |
| 2 | Redmond | 8.6 |
| 3 | Sammamish | 7.9 |
| 4 | Mercer Island | 7.4 |
| 5 | Clyde Hill | 7.4 |
| 6 | Pullman | 5.5 |
| 7 | West Lake | 4.0 |
| 8 | Bryn Mawr-Skyway | 3.7 |
| 9 | Shoreline | 3.4 |
See also
- Chinatown
- List of U.S. cities with Asian American majority populations
- List of U.S. cities with large Japanese-American populations
- List of U.S. cities with significant Korean-American populations
- List of U.S. cities with large Vietnamese-American populations
- Lists of U.S. cities with large ethnic identity populations
- Palmdale, California
Notes
- ^ San Francisco is a consolidated city-county.
- ^ Further subdivided into 5 boroughs which are also counties of its own rights.
- ^ Honolulu is a consolidated city-county.
- ^ Officially, a County under Urban County Executive Form of Government. (Essentially, a highly urbanized county-city.)
- ^ Philadelphia is a consolidated city-county.
- ^ Lexington is a consolidated city-county.
- ^ Washington is a federal district.
- ^ Officially, a County under County Manager Plan of government. (Essentially, a highly urbanized county with a population density of at least 500 people per square mile.)
References
- ^ a b "SELECTED POPULATION PROFILE IN THE UNITED STATES - 2014 American Community Survey 1-Year Estimates - New York City - Chinese alone". U.S. Census Bureau. Archived from the original on February 14, 2020. Retrieved September 22, 2015.
- ^ "Yearbook of Immigration Statistics: 2013 Supplemental Table 2". U.S. Department of Homeland Security. Retrieved 2014-10-01.
- ^ a b "Yearbook of Immigration Statistics: 2012 Supplemental Table 2". U.S. Department of Homeland Security. Retrieved 2014-02-23.
- ^ "Yearbook of Immigration Statistics: 2011 Supplemental Table 2". U.S. Department of Homeland Security. Retrieved 2014-02-23.
- ^ John Marzulli (May 9, 2011). "Malaysian man smuggled illegal Chinese immigrants into Brooklyn using Queen Mary 2: authorities". New York: © Copyright 2012 NY Daily News.com. Retrieved 2014-02-23.
- ^ "Chinese New Year 2012 in Flushing". QueensBuzz.com. January 25, 2012. Retrieved 2014-02-23.
- ^ "ACS DEMOGRAPHIC AND HOUSING ESTIMATES 2012 American Community Survey 1-Year Estimates New York-Newark-Bridgeport, NY-NJ-CT-PA CSA". U.S. Census Bureau. Archived from the original on 2020-02-12. Retrieved 2013-10-27.
- ^ "Yearbook of Immigration Statistics: 2012 Supplemental Table 2". U.S. Department of Homeland Security. Retrieved 2014-02-22.
- ^ "Yearbook of Immigration Statistics: 2011 Supplemental Table 2". U.S. Department of Homeland Security. Retrieved 2014-02-22.
- ^ "Yearbook of Immigration Statistics: 2010 Supplemental Table 2". U.S. Department of Homeland Security. Retrieved 2014-02-22.
- ^ John Marzulli (May 9, 2011). "Malaysian man smuggled illegal Chinese immigrants into Brooklyn using Queen Mary 2: authorities". New York: © Copyright 2012 NY Daily News.com. Retrieved 2014-02-22.
- ^ "Chinese New Year 2012 in Flushing". QueensBuzz.com. January 25, 2012. Retrieved 2014-02-22.
- ^ "About the San Gabriel Valley" (PDF). Advancingjustu=ice-la.org. Retrieved 27 May 2018.
- ^ Melia Robinson (May 27, 2015). "This is what it's like in one of the biggest and fastest growing Chinatowns in the world". Business Insider. Archived from the original on July 30, 2017. Retrieved March 3, 2019.
- ^ "Kings County (Brooklyn Borough), New York QuickLinks". U.S. Census Bureau. Retrieved 2014-03-04.
- ^ "Queens County (Queens Borough), New York QuickLinks". U.S. Census Bureau. Retrieved 2014-03-04.
- ^ U.S. Census Bureau. American FactFinder - 2010 summary file [Geography set to "Atu'u village, American Samoa".] URL unavailable.
- ^ U.S. Census Bureau. American FactFinder. 2010 summary file [Geography set to "Tamuning village, Guam" / "Hagatna village, Guam"]. URL unavailable.
- ^ a b U.S. Census Bureau. American FactFinder. 2010 summary file [Geography set to "Tinian municipality, Commonwealth of the Northern Mariana Islands" / "Saipan municipality, Commonwealth of the Northern Mariana Islands"]. URL unavailable.
- ^ "American FactFinder - Results". Archived from the original on 2014-03-05. Retrieved 2012-11-25.
Further reading
- Wei Li. "Building Ethnoburbia: The Emergence and Manifestation of the Chinese Ethnoburb in Los Angeles' San Gabriel Valley." Journal of Asian American Studies 2(1): 1-28 (1999).